

Abstract
Semiconductor quantum dots (Qdots) are a promising new technology with benefits in the areas of medical diagnostics and therapeutics. Qdots generally consist of a semiconductor core, capping shell, and surface coating. The semiconductor core of Qdots is often composed of Group II and VI metals (e.g. Cd, Se, Te, Hg) that are known to have toxic properties. Various surface coatings have been shown to stabilize Qdots and thus shield cells from the toxic properties of their core elements. In this study, HepG2 cells and primary human liver (PHL) cells were chosen as in vitro tissue culture models of human liver to examine the possible adverse effects of tri-n-octylphosphine oxide, poly(maleic anhydride-alt-1-tetradecene) co-polymer (TOPO-PMAT)-coated CdSe/ZnS Qdots (TOPO-PMAT Qdots). The TOPO-PMAT coating is desirable for increasing aqueous solubility and ease of conjugation to targeting moieties (e.g. aptamers and peptides). HepG2 cells avidly incorporated these TOPO-PMAT Qdots into subcellular vesicles. However, PHL cells did not efficiently take up TOPO-PMAT Qdots, but nonparenchymal cells did (especially Kupffer cells). No acute toxicity or morphological changes were noted in either system at the exposure levels used (up to 40 nM). However, cellular stress markers and pro-inflammatory cytokines/chemokines were increased in the PHL cell cultures, suggesting that TOPO-PMAT Qdots are not likely to cause acute cytotoxicity in the liver, but may elicit inflammation/hepatitis, demonstrating the importance of relevant preclinical safety models. Thus, further in vivo studies are warranted to ensure that TOPO-PMAT coated Qdots used in biomedical applications do not induce inflammatory responses as a consequence of hepatic uptake.
Keywords: Human liver, hepatocytes, nanotoxicology, quantum dots, HepG2 cells
Semiconductor quantum dots (Qdots) are a distinct category of nanotechnology that has potential for medical applications, in addition to other industrial applications. Compared to fluorescent proteins and organic dyes, Qdots offer greater brightness and photostability, tunable emission from visible to infrared wavelengths, and large absorption coefficients across a broad spectral range. This allows for highly specific, quantitative optical imaging and multiplex assays. Recent studies from our group,1,2 as well as others,3 have shown that nanometer-sized Qdots can be covalently-linked to a variety of biomolecules, such as antibodies, DNA and RNA for use as addressable fluorescent probes. For example, we have conjugated antibodies targeting PSMA (prostate specific membrane antigen) to CdSe/ZnS core/shell Qdots (emission 640 nm) for simultaneous imaging and targeting prostate tumors in mouse models,4 and more recently, we have developed silica-polymer dual encapsulated Qdots which are stable in a wide range of chemical conditions1. A recent study by Ling et al.5 reported no adverse events after intravenous dosing of rhesus macaques with phospholipid encapsulated CdSe/CdS/ZnS Qdots, further illustrating the potential promise and apparent safety of this technology.
However, while this technology shows much promise, the semiconductor crystalline core of Qdots is generally made from toxic heavy metals in groups II-VI and III-V of the chemical periodic table, including Cd, Se, Te and Hg. It is therefore important to investigate the disposition of Qdots in an attempt to understand and mitigate any possible toxicity that may be associated with exposure. Previously reported studies utilizing Qdots with a CdSe core have presented conflicting toxicity results. Derfus et al. 6 reported that Qdot toxicity is due primarily to the release of Cd+ ions, rather than the surface properties of Qdots. These results were further substantiated in another study.7 Additionally, Su et al.8,9 found that various CdTe/CdSe/ZnS core-structured Qdots formed by aqueous synthesis were highly toxic in a variety of cell lines, and that the toxicity was related to release of Cd ions, which could be ameliorated with the addition of a ZnS shell. While a ZnS shell may help ameliorate toxicity due to release of Cd atoms, surface coatings used to improve biocompatibility also hold potential for toxicity. For example, a study by Shiohara and colleagues10 concluded that cytotoxicity was predicted primarily by Qdot surface properties. Thus, a variety of cellular responses in different cell types have been observed with Qdots of differing surface properties and coatings. These differences are likely due to the particular cell types and in vitro culture methods used in these studies, as well as to differences in surface properties of the Qdots.7,11
In vivo, Fischer and coworkers have previously shown that up to 99% of an intravenous dose of bovine serum albumin (BSA)-conjugated Qdots was found within the liver of Sprague-Dawley rats 90 minutes after administration.12 Furthermore, it was also shown that these Qdots were sequestered primarily by macrophages (Kupffer cells) within the liver.12 Another study showed the importance of Kupffer cells in the sequestration of epidermal growth factor (EGF)-conjugated Qdots in rat liver, since pre-administration of gadolinium chloride (a Kupffer cell specific toxicant) was able to severely diminish retention of these Qdots to the liver.13 These studies suggest that the liver is a primary site of Qdot accumulation following intravenous exposure.
Cell culture models are necessary for preclinical safety assessment during the development of biomedical nanoparticles. The biological relevance of the model system must be accounted for to generate a reliable prediction of in vivo responses. Primary human hepatocytes are regarded as the “gold standard” for preclinical safety testing of therapeutic molecules.14 Culturing these cells in various “sandwich culture” formats allows for the maintenance of many liver specific functions.15 This in vitro system has been shown to maintain gene expression levels similar to those in vivo with both primary human16 and rat17 hepatocyte cultures. However, the utility of this system has not been established for testing of nanoparticles. Because the liver is likely one of the primary sites of uptake after intravenous administration, we chose to analyze the disposition of multifunctional Qdots in primary human liver (PHL) cell cultures, utilizing the transformed human liver cell line HepG2 as a comparison. Specifically, we investigated the effects of tri-n-octylphosphine oxide, poly(maleic anhydride-alt-1-tetradecene) co-polymer (TOPO-PMAT) coated CdSe/ZnS Qdots on cultured HepG2 cells and PHL cells.
Results
Characterization of TOPO-PAMT Qdots
Characterization data used in all of the experiments reported in this study are detailed in Figure 1. Qdots used in this study contain a CdSe core with a ZnS shell, and a polymer (TOPO-MAT) coating (Fig 1A). TEM evaluation of the stock solution of Qdots revealed individual nanoparticles (Fig 1B) with a mean hydrodynamic diameter of 12.7 ± 0.5 nM (Fig 1C) and peak fluorescence emission spectra of 620 nm (Fig 1D). TOPO-PMAT Qdots showed very little agglomeration in the cell culture conditions utilized (S1).
Fig 1. Particle characterization.

A Schematic representation of TOPO-PMAT Qdots with associated coatings (A). The sphere represents the CdSe core with a ZnS and TOPO-PMAT coating. Illustrations on the right of panel A depict polymers utilized for coating. A transmission electron microscope (TEM) image (B) of TOPO-PMAT Qdots used in these studies. Dynamic light scattering (DLS) analysis demonstrated the average size of particles in PBS (C). Absorbance and fluorescence emission scans of particles suspended in PBS (D).
Uptake of TOPO-PMAT Qdots in HepG2 and PHL cells
To quantify the amount of TOPO-PMAT Qdot uptake in HepG2 and PHL cultures, the cells were exposed to a range of concentrations (0 - 40nM). Both culture systems showed TOPO-PMAT Qdot sequestration in a dose-dependent manner at 24 hrs. Qdot specific fluorescence intensity was normalized to cell count using Hoechst nuclear staining (Fig. 2A, B). The fluorescence signal attributable to TOPO-PMAT Qdots in PHL cell cultures appeared to be saturated at lower concentrations versus that obtained for HepG2 cell cultures (Fig. 2C). Visually, TOPO-PMAT Qdots were present in a subpopulation of cells within the PHL cell cultures (Fig 2A.); whereas, nearly all HepG2 cells showed some uptake (Fig. 2B).
Fig 2. Quantum dot uptake.

Representative fluorescence microscopy digital images of Qdot (red) and nuclei (blue) for HepG2 cells (A), and PHL cells (B). Cells were exposed to 40 nM Qdots for 24 h. Differential interference contrast images were taken of each field to confirm Qdot fluorescence was localized to cells (C). Quantification of Qdot uptake in HepG2 cells (open bars) and PHL cells (solid bars). Qdots were added to cell cultures at the indicated concentrations and after 24 hrs, the level of Qdot fluorescence (normalized to nuclear Hoechst fluorescence) was quantified using digital imaging as indicated in Materials and Methods. Data presented was collected from duplicate images of each well in three separate 6-well plates (n=36).
Effect of TOPO-PMAT Qdots on cellular viability and markers of cellular stress
To investigate the effect of TOPO-PMAT Qdots on cell viability, cultures were exposed to a range of concentrations and examined for their ability to carry out the reduction of MTT to formazan. Administration of TOPO-PMAT Qdots to either culture system did not affect cell viability at the concentrations tested over a period of 24-72 hrs (Fig 3A; 48 and 72h data not shown).
Fig 3. Effect of Qdots on cellular viability and glutathione content.
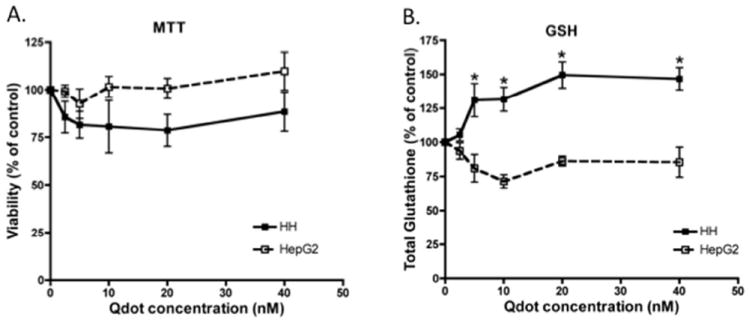
Quantum dots were added to HepG2 cells (open squares) and PHL cells (solid circles) at the indicated concentrations for 24 hr. A) Cell viability was measured by the reduction of MTT to Formazan. Formazan amounts were measured in triplicate in three different 24-well plates. B) Glutathione levels were measured as described in Materials and Methods. Solid and open squares represent the mean (± S.E.M.) of three individual experiments in PHL and HepG2 cultures, respectively. Asterisks depict points that were significantly different from vehicle treated controls.
To determine if TOPO-PMAT Qdots were causing sub-lethal changes in cell function, several markers of cellular stress were examined. HepG2 and PHL cells were analyzed for total GSH content (Figure 3B). GSH was significantly increased over controls in PHL cells exposed to TOPO-PMAT Qdots at 5, 10, 20, and 40 nM with values of 131, 132 150, and 147% of control respectively. In contrast, HepG2 cultures showed no dose-related effect on GSH levels.
The mRNA expression of four oxidative stress responsive genes (MT1A, HMOX1, GCLC and GCLM) and their corresponding protein levels were measured in both HepG2 and PHL cell cultures (Fig 4A-D). The levels of GCLC and GCLM mRNA were relatively unaffected in HepG2 cultures (Fig. 4A and 4B). However, the mRNA expression of GCLC, and to a lesser extent GCLM, was down-regulated in PHL cell cultures, in spite of the increased levels of GSH detected in these cells (Figure 3B). HMOX1 mRNA expression was maximally increased 3-fold at 10 nM TOPO-PMAT Qdot concentration (Fig. 4C). No significant changes were noted in HMOX1 mRNA levels in HepG2 cultures (Fig. 4C). MT1A mRNA expression was similar in both culture systems (Fig. 4D). To address the possibility that small traces of Cd may either be present or leaching from the TOPO-PMAT Qdots, we measured the residual amounts of Cd in medium containing a 40 nM concentration of Qdots after removal by centrifugation. The remaining levels after centrifugation were 23.7 nM and 60.1 nM in WEM and MEMα, respectively.
Fig. 4. Changes in mRNA levels after exposure to Qdots.

Expression of cellular stress response gene mRNAs were quantitated with qRT-PCR as described in Materials and Methods for A) GCLC, B) GCLM, C) HMOX1, and D) MT1A. Values are shown as fold change from control with all samples normalized to GAPDH mRNA levels. Solid and open bars represent the mean (± SEM) of three individual experiments in PHL and HepG2 cultures, respectively. Asterisks denote statistically significant difference from vehicle treated controls by repeated measures ANOVA (P<0.05).
To more thoroughly investigate the cellular response to TOPO-PMAT Qdots of these cellular stress markers, GCLC, GCLM and HMOX1 protein levels were examined using Western immunoblotting (Fig. 5). HMOX1 protein levels appeared to be increased in a dose-dependent manner in both cell culture models but were not statistically significant (Fig. 5C). GCLC protein levels appeared to be down-regulated after 24h of treatment with TOPO-PMAT Qdots in PHL cell cultures, while GCLM was unaffected (Fig. 5A and 5B).
Fig 5. Expression of cellular stress response proteins after exposure to Qdots.
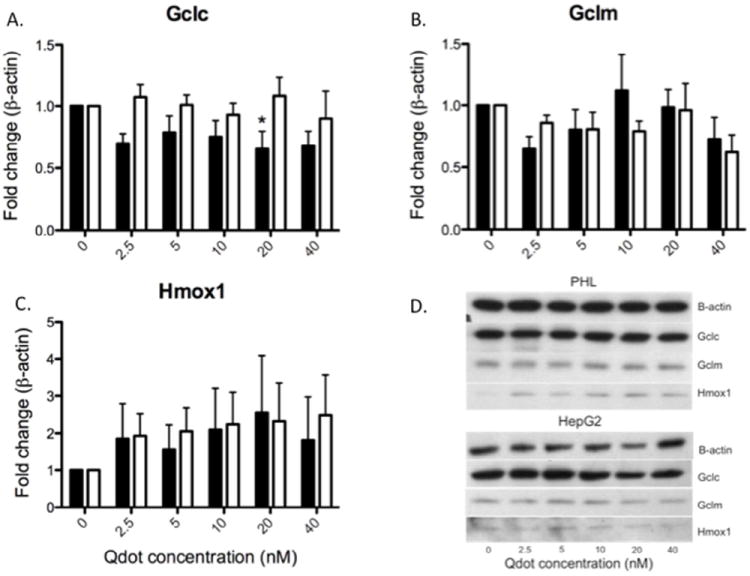
Protein levels of cellular stress response genes were quantitated as described in Materials and Methods for A) GCLC, B) GCLM, and C) HMOX1. A representative Western blot is shown in image D) with samples from the same gel. All quantitated values were normalized to β-actin expression and expressed as relative to untreated controls. Solid and open bars represent the mean (± SEM) of three individual experiments in PHL and HepG2 cultures, respectively. Asterisks denote statistical significant difference from vehicle treated controls by repeated measures ANOVA (P<0.05).
Pro-inflammatory effects of TOPO-PMAT Qdots
Because the liver is often involved in systemic immune response18, we investigated the potential of TOPO-PMAT Qdots to elicit an inflammatory response in both HepG2 and PHL cell cultures. The mRNA levels of several pro-inflammatory cytokines/chemokines known to play a role in liver pathologies were measured by qRT-PCR (Fig. 6A-D). TNFα, CXCL8, CCL4, and CXCL10 were measured after 24h of exposure to TOPO-PMAT Qdots. Exposure of HepG2 cells to TOPO-PMAT Qdots resulted in very little change in mRNA levels for these pro-inflammatory cytokines/chemokines. However, there were marked increases in CXCL8 and CCL4 mRNA levels (3.3-fold and 5.5-fold, respectively) in the PHL cells (Fig. 6B and 6C). TNFα and CXCL10 were not significantly affected by Qdot exposure in PHL cells (Fig. 6A and 6D).
Fig. 6. Changes in mRNA levels of pro-inflammatory genes after exposure to Qdots.

Cellular mRNA levels were quantitated with qRT-PCR as described in Materials and Methods for A) TNFα, B) CXCL8, C) CCL4, and D) CXCL10. Values are shown as fold change from control with all samples normalized to GAPDH mRNA levels. Solid and open bars represent the mean (± SEM) of three individual experiments in PHL and HepG2 cultures, respectively. Asterisks denote statistically significant difference from vehicle treated controls by repeated measures ANOVA (P<0.05).
To determine if these changes in mRNA were also reflected in changes in protein we measured the levels of these pro-inflammatory cytokines/chemokines in media collected after 24 h of exposure to Qdots (Fig. 7). The levels of CXCL8, CCL4, and CXCL10 were increased across all doses in PHL cultures, while TNFα was only detectable at low levels (Fig. 7A-C). No changes in cytokine or chemokine levels were evident after Qdot exposure in HepG2 cells (Fig. 7).
Fig. 7. Expression of pro-inflammatory cytokines after Qdot exposure.

Protein levels of pro-inflammatory response were quantitated as mentioned in Materials and Methods the range of Qdot doses tested A) CXCL8, B) CCL4, and C) CXCL10. Solid and open bars represent the mean (± S.E.M.) of three individual experiments in PHL and HepG2 cultures, respectively. Asterisks depict a statistically significant difference from vehicle treated controls by repeated measures ANOVA (P<0.05).
Discussion
In this study, we have found that cultured HepG2 cells and PHL cells sequester TOPO-PMAT Qdots in a dose-dependent manner with no overt cytotoxicity after 24h. The TOPO-PMAT coating appears to protect cells from acute toxicity due to Cd2+ ions, as reported by others for various uncoated, Cd-containing Qdot cores.8,9,11,19 However, these particles cause increases in total glutathione levels and HMOX and MT1A expression in PHL cell cultures. HepG2 cells were minimally responsive to Qdots, showing only changes in MT1A mRNA expression, but no response in the other stress response indicators, nor in pro-inflammatory signaling molecules. PHL cell cultures responded with robust increases in CCL4 and CXCL8 mRNA expression and protein levels. Additionally, CXCL10 protein, but not mRNA, was increased after exposure. These results suggest the need for more thorough characterization of liver cell pro-inflammatory responses in order to avoid possible bystander liver injury due to inflammation.
Metallothionein was the only gene with increased expression in both culture systems. Increased (MT1) expression is acknowledged as a marker of cellular stress induced by heavy metals, including cadmium.20 As mentioned in the Results, we measured the residual amounts of Cd by ICP-MS in medium containing 40 nM of TOPO-PMAT Qdots subsequent to centrifugation. The remaining levels after centrifugation were 23.7 nM and 60.1 nM in WEM and MEMα, respectively. The calculated amount of Cd in a 40 nM concentration of TOPO-PMAT Qdots is approximately 140 μM. Previous studies have reported that 6 μM CdCl2 induced MT1 in HepG2 cells approximately 50-fold.21,22 Given that the concentration of Cd2+ present in media was 100-fold lower, it is unlikely this was a substantial contributor to MT1 induction in these experiments, suggesting a different mechanism.
The concentration of the intracellular antioxidant, glutathione (GSH), was significantly increased in PHL cultures after exposure to TOPO-PMAT Qdots. Glutathione has been shown to be important in Cd-induced toxicity.23 Glutamate-cysteine ligase (GCL) is the rate-limiting enzyme for glutathione synthesis in mammalian cells, and is composed of catalytic (GCLC) and modifier (GCLM) subunits. Interestingly, TOPO-PMAT Qdot exposed PHL cultures exhibited a significantly increased level of GSH, while HepG2 cultures show slightly decreased levels. The mRNA and protein levels of GCLC are decreased in Qdot exposed cultures and the levels of GCLM mRNA appear to be slightly decreased in PHL cultures. Both mRNA and protein are relatively unaffected in HepG2 cultures. The discrepancy between increased total GSH levels and decreased mRNA expression and protein is suggestive of a post-translational or biochemical mechanism. Previously, we reported similar results in a co-culture system of RAW264.7 and SVEC4-10 in response to diesel exhaust particulate exposure.24 This finding may be due to oxidative stress increasing the formation of GCL holoenzyme, resulting in more efficient generation of the dipeptide and glutathione synthesis intermediate γ-glutamyl-cysteine.25
HMOX1 is responsible for the degradation of heme to carbon monoxide (CO), biliverdin, and free iron. These products have been shown to have antioxidant and anti-inflammatory effects.26HMOX1 mRNA expression is significantly increased at all doses of TOPO-PMAT Qdot treatment with only a slight increase at higher concentrations in HepG2 cells. A trend towards increased protein expression of HMOX1 is evident in both culture systems, suggesting there may be post-transcriptional events affecting the ultimate translation of HMOX1 mRNA to protein. A previous report by our group identified HMOX1 as a sensitive biomarker to TOPO-PMAT Qdots.27
There is also evidence to suggest that HMOX1 plays a role in reducing pro-inflammatory effects in response to toxic insult.28 Our results show robust increases in mRNA and protein levels for several pro-inflammatory cytokines. Based on our finding that TOPO-PMAT Qdots are sequestered in a subpopulation of cells, most likely Kupffer cells, an increase in inflammatory cytokines is not unexpected. Multiple studies have shown the sequestration of intravenously administered Qdots in Kupffer cells within the liver. Fischer et al.29 reported an increase in pro-inflammatory signaling (TNFα and IL-6) after exposure of rats to Qdots (PEG and BSA-coated), but they did not find an increase in IL-1β. These results differ from what we found, possibly due to either species or nanoparticle differences.
The pro-inflammatory cytokine CXCL8 was chosen for analysis due to its role in the response to infectious agents. CXCL8 is known as a potent neutrophil chemoattractant and has been shown to be elevated in individuals with chronic liver diseases.22 Our results demonstrate a dose-dependent increase in CXCL8 mRNA and a corresponding increase in CXCL8 protein at all doses of PMAT-TOPO Qdots in PHL cultures. In contrast, HepG2 cultures showed no change in either CXCL8 mRNA or protein. This suggests that Kupffer cells are most likely responsible, directly or indirectly, for the release of CXCL8. This study does not account for responses that may originate from outside of the liver in vivo, such as recruitment of extrahepatic monocytes/macrophages into the liver.
IFN inducible protein 10 (CXCL10) is upregulated in autoimmune hepatitis as well as chronic HBV and HCV. It is released as a soluble factor by hepatocytes near inflamed lobular regions and induces a type I immune response by activating the CXCR3 receptor on CD4+ TH1, CD8+ Tc, and NK cells.30 CXCL10 has also been shown to be involved in liver fibrosis by inhibiting NK cell inactivation of hepatic stellate cells (HSCs).31 Exposure to Qdots results in an increase of CXCL10 protein after 24h in PHL cultures with no concomitant increase in mRNA and no response in HepG2 cultures. Again, this is suggestive of Kupffer cells playing a role in inflammatory response in PHL cultures. Kupffer cells are generally present in these cultures at around 1% of the total cell population as measured by flow cytometry (data not shown) and thus are unlikely to contribute significantly to the amount of mRNA expression.
Similar to the response in two measured C-X-C chemokines, PHL cultures also show increases in both mRNA and protein expression of CCL4. Like CXCL10, CCL4 mRNA expression was increased in a dose-dependent manner, while increased protein expression occurred at all concentrations tested. Consistent with other cytokines, there were no changes in CCL4 expression in HepG2 cultures. Chemokines of the Macrophage inflammatory protein 1 (MIP1) family are responsible for recruiting pro-inflammatory cells from the systemic circulation to a local site. It has been reported that IL-1β from monocyte conditioned medium was able to stimulate the production of CCL4 in HepG2 and Huh-7 human carcinoma cells lines.32 Our results show an increase in IL-1β mRNA expression (data not shown) and CCL4 mRNA and protein expression in PHL cultures. Taken together, increases in IL-1β may be responsible for the increases seen in CCL4.
Interestingly, there were only slight increases in tumor necrosis factor alpha (TNFα) mRNA expression at intermediate Qdot doses. TNFα is recognized to be one of the most commonly expressed inflammatory cytokines. HMOX1 has been shown to block expression of TNFα, as well as IL-1β and MIP-1β, via the production of CO. The mechanism underlying this effect of TNFα has been shown to be mediated through MAP kinase-related pathways.33 While this does not explain the failure of HMOX1 to block the expression of MIP-1β, HMOX-1 is thought to play a role in angiogenesis by interacting with vascular endothelial growth factor (VEGF).34 Furthermore, CXCL10 can be modulated by HMOX-1 expression in renal tubular epithelial cells.35 Thus, it is possible that TOPO-PMAT Qdot exposure could interfere with homeostatic balances of pro- and anti-angiogenic signaling as well as other chemokine pathways.36
Collectively, these results demonstrate that TOPO-PMAT Qdots elicit an inflammatory response in primary human liver cultures containing hepatocytes and a small population of Kupffer cells. The increase in gene expression and release of cytokines/chemokines measured suggest a pro-inflammatory macrophage phenotype (M1) versus the normally tolerogenic state of Kupffer cells (M2) which reside in the liver to process microbes from the intestinal tract.37 While primary inflammatory cytokines (TNFα and IL-1β) are only slightly elevated, the robust increases in IL8 and CCL4 are suggestive of an altered hepatic state associated with chronic liver disease. 22
Conclusions
In summary, our results show that TOPO-PMAT coated CdSe Qdots do not exhibit significant overt cytotoxicity. However, secondary responses to TOPO-PMAT Qdots may result in a pro-inflammatory response within the liver. We saw an increase of pro-inflammatory chemokines/cytokines associated with immune cell recruitment in hepatitis, as well as cellular stress markers in PHL cultures, but not HepG2 cultures. While in vivo studies are important to investigate biological response to nanoparticles at the organ level, appropriate in vitro models containing relevant cell types have value for estimating tissue level responses. Further studies in primary liver cultures and in vivo mouse models are necessary to more thoroughly investigate the mechanism and relevance of this response. Also, the variability between various liver preparations illustrates the heterogeneity of the human population and reflects the importance of considering variable responses from different donors.
Materials and Methods
Materials and Instruments
TOPO coated CdSe/ZnS core/shell QDs (620nm emission) were provided by Oceannanotech LLC as a gift (Springdale, Arkansas, USA). Poly(maleic anhydride-alt-tetradecene) was purchased from Sigma-Aldrich, Inc. (St. Louis, MO). A UV-2450 spectrophotometer (Shimadzu, Columbia, MD) and a Fluoromax4 fluorimeter (Horiba Jobin Yvon, Edison, NJ) were used to characterize the absorption and emission spectra of the modified QDs. A tabletop ultracentrifuge (Beckman TL120) was used for nanoparticle purification and isolation. The diameters of dry QDs were measured on a FEI Tecnai transmission electron microscope (FEI Corporate Headquarters, Hillsboro, OR, USA) and a Zetasizer NanoZS size analyzer (Malvern, Worcestershire, UK).
Synthesis of quantum dots
TOPO-PMAT Qdots were synthesized as previously described.2,27,38 Briefly, 40 mg of PMAT was mixed with 17.7 nmol of QDs in chloroform. The solvent was then allowed to slowly dry in air, leading to the formation a thin film of QD-PMAT complexes. The dried film was dissolved in 50 mM borate buffer (pH 8.5) with agitation or sonication. Free PMAT polymers (unbound polymers) were removed by 3 rounds of ultracentrifugation (50k rpm for 1 h each). Absorption and fluorescence emission spectra of the modified Qdots were measured on a UV-2450 spectrophotometer (Shimadzu, Columbia, MD) and a Fluoromax4 spectrofluorometer (Horiba Jobin Yvon, Edison, NJ), respectively. A Zetasizer NanoZS size analyzer (Malvern, Worcestershire, UK) was used to measure the hydrodynamic diameter (12.7 ± 0.5 nM) and zeta potential (-43 mV) of the Qdots.27 Concentration determination of TOPO-PMAT Qdots was determined by absorption with a standard curve.
Cell culture
HepG2 cells were obtained from ATCC (Manassas, GA) and cultured in MEM-α medium supplemented with 5% NuSerum (BD Biosciences, Bedford, MA), 100 IU/ml penicillin and 100 ug/ml streptomycin, and maintained in 5% CO2/95% humidified air at 37°C. Cells were plated in 35 mm tissue culture dishes at 5 × 10⁵ cells/cm2 and allowed to grow for 48 h prior to Qdot exposure. Qdots were suspended in medium and then sterile filtered with a 0.22 μM pore polyvinylidene difluoride (PVDF) membrane (Millipore, Billerica, MA) prior to addition in cell cultures. PHL cell cultures were derived from viable human livers that were rejected for transplantation for various reasons. PHL cells were obtained from Dr. Steven Strom (University of Pittsburgh), through the NIH Liver Cell and Tissue Distribution System (LCTDS). All human subjects’ protocols for organ collection were reviewed and approved by the University of Pittsburgh Internal Review Board. The use of these samples does not constitute human subjects research as determined by the University of Washington IRB. Isolation of human liver cells was performed as described previously.16 PHL cells were maintained at 37°C under 5% CO2/95% humidified air on a rigid collagen substratum overlaid with Matrigel (BD Biociences, San Jose CA, USA) in supplemented Williams E media as previously reported.16 Previous studies have shown that the collagen/Matrigel “sandwich” culture decreases expression of cellular stress genes and increases the expression of biotransformation enzymes, as well as other genes associated with liver-specific function.39 These conditions maintain albumin secretion for up to 10 days15. PHL cells were incubated for 24h after receiving them to allow for recovery from shipment. The cells were then treated with Qdots or an equal volume of medium for 24 h at a range of doses (0 – 40 nM) prior to analysis.
Fluorescence microscopy
Qdot uptake was evaluated by digital fluorescence imaging using a Nuance hyperspectral imaging camera (Cambridge Research, Inc, Hopkinton MA), mounted on a Nikon Optiphot microscope (Nikon USA, Melville, NY). After 24 hr of incubation, medium containing Qdots was removed and cultures were washed 2X with PBS. Nuclei were then stained with cell membrane permeable Hoechst dye (HO33342) and fluorescence measurements were recorded. Two color digital images were obtained using UV excitation (365 nm) and blue emission (460 ± 5 nm band pass filter) to detect Hoechst dye nuclear staining, and fluorescence emission collected at 620 ± 5 nm band pass filter for Qdot specific fluorescence. Averaging time for imaging was held constant among treatments within each cell line. Tiff images were then exported to Metamorph software (Molecular Devices, Sunnyvale, CA) for further processing and quantitation.
MTT Assay
Cells were incubated with Qdots for 24 h in 24-well plates. Cellular viability was quantitated by a colorimetric method utilizing the metabolic dye 3-(4,5-dimethylthiazol-2-yl)-2,5 diphenyltetrazolium bromide (MTT).40 MTT is reduced by mitochondrial dehydrogenases in metabolically active cells causing the development of an intracellular purple formazan precipitate that can be solubilized with DMSO and quantified by spectrophotometry. An aliquot of 50 μl of a 5 mg/ml solution of MTT was added to each well and incubated for 1 h at 37 °C. Subsequently, the medium containing Qdots and MTT solution was carefully removed and the formazan reaction product dissolved with DMSO (150 μl/well). Absorbance was read at 570 nm, and the results expressed as percent viability relative to controls.
Measurement of glutathione levels
Total intracellular glutathione (GSH) levels were measured as described previously.41 Briefly, cells were homogenized by incubation with Mammalian Purification Extraction Reagent (MPER; Thermo Fisher Scientific, Rockford, IL, USA) as per the manufacturer’s instructions. An aliquot was taken to measure the protein concentration while a second aliquot was diluted (1:1) with 10% 5-sulfosalicylic acid (SSA). The SSA fraction was centrifuged at 12,000 rpm for 5 min at 4 °C and the supernatant measured for GSH quantitation. Aliquots from the SSA fraction were added to a 96-well plate and the pH was adjusted to 7.0 with 0.2 M N-ethylmorpholine/0.02 M KOH. Glutathione disulfide (GSSG) was reduced to GSH by adding 10 μl of 10 mM tris (2-carboxyethyl)-phosphine hydrochloride (TCEP) for 15 min at room temperature. The pH was then adjusted to 12.5 using 0.5 N NaOH before derivatizing the samples with naphthalene dicarboxaldehyde (NDA; 0.5 mM) for 30 min. Lastly, the samples were analyzed on a spectrofluorometric plate reader (λEX 472 and λEM 528 nm). The total amount of GSH in the sample was reported as nmol/mg protein by interpolating from a standard curve obtained by plotting known amounts of GSH incubated in the same experimental conditions. Protein levels were determined with the BCA reagent (Pierce, Rockford,IL) per manufacturer’s instructions.
Measurement of cadmium
Quantum dots were prepared as previously mentioned by suspension in media and sterile filtered prior to centrifugation at 50,000 × g for 1h at 4°C (Beckman Ti 70.1 rotor; Beckman Instrumentation, Fullerton, CA). Cadmium levels were detected with ICP-MS utilizing a standard protocol (EPA 6020A).
RT-PCR
The steady-state mRNA levels of genes involved in cellular stress response (MT1A, HMOX1, GCLC and GCLM), and inflammation (TNFα, CXCL8, CCL4, and IL-1β) were measured using quantitative real-time reverse transcriptase-polymerase chain reaction (qRT-PCR). Following 24 h of treatment with Qdots, cells were lysed with the addition of TRIzol reagent (Invitrogen, Carlsbad, CA). RNA was extracted and purified utilizing standard Phenol-Chloroform extraction procedures. The quality of RNA was then measured electrophoretically by examining 18s and 28s band intensities utilizing an Agilent 2100 Bioanalyzer (Agilent, Santa Clara, CA, USA). Reverse transcription (RT) of 0.1-0.2 μg total RNA was performed using oligo-dT 15 primer and Superscript®II RNaseH (Gibco, Carlsbad, CA, USA), following the manufacturer’s instructions. Quantitative RT-PCR was performed using fluorogenic 5’ nuclease assays on an ABI PRISM 7900HT System (Applied Biosystems Inc., Foster City, CA, USA).
Western blotting
After treatment for 24 h, cells were rinsed 1X with PBS (RT) and the appropriate amount of MPER following manufacturer’s instructions. One half of the mixture was frozen at -80°C in 10% SSA for GSH analysis. The remaining aliquot was centrifuged at 13,300 × g for 20 min to remove cell debris and the supernatant stored at -80 °C until analyzed. Equal amounts of soluble protein were resolved on a 4-12% gradient polyacrylamide gel (Nupage Bis/Tris) and then transferred to PVDF membranes (Millipore, Bedford MA, USA). Membranes were probed for GCLC and GCLM (Franklin, 2003), HMOX1 (R&D Systems, Minneapolis MN, USA), and β-Actin (loading control).
Cytokine Detection by Luminex Bead Array
Medium from Qdot-treated hepatocytes was collected, centrifuged at 100g and the supernatant was stored at -80 °C until being measured with the Luminex 200 system as specified by the manufacturer (Luminex, Austin, TX). These samples were subsequently tested in multiplex assays for the presence of TNFα, CXCL8, CCL4, and CXCL10 using polystyrene Antibody Bead kits (Biosource/Invitrogen) and the Luminex xMAP system.
Supplementary Material
Acknowledgments
This work was supported by NIH grants R21AT002895, R01ES016189, U19ES019495, P30ES007033 and T32ES007032. The authors would like to thank Julia Tracy, Amelie Bigorgne and Ian Nicholas Crispe for technical assistance.
Footnotes
Supporting Information Available: Photomicrographs of Dispersion of TOPO-PMAT Qdots in William’s E Media, and in Modified Eagle’s Medium with alpha modification (MEMα) supplemented with NuSerum, after 24h at 37°C. This material is available free of charge via the Internet at http://pubs.acs.org.
References
- 1.Hu X, Gao X. Silica–Polymer Dual Layer-Encapsulated Quantum Dots with Remarkable Stability. ACS Nano. 2010;4:6080–6086. doi: 10.1021/nn1017044. [DOI] [PMC free article] [PubMed] [Google Scholar]
- 2.Bagalkot V, Gao X. siRNA-Aptamer Chimeras on Nanoparticles: Preserving Targeting Functionality for Effective Gene Silencing. ACS Nano. 2011;5:8131–8139. doi: 10.1021/nn202772p. [DOI] [PMC free article] [PubMed] [Google Scholar]
- 3.SMITH A, DUAN H, MOHS A, NIE S. Bioconjugated Quantum Dots for in vivo Molecular and Cellular Imaging. Advanced Drug Delivery Reviews. 2008;60:1226–1240. doi: 10.1016/j.addr.2008.03.015. [DOI] [PMC free article] [PubMed] [Google Scholar]
- 4.Gao X, Cui Y, Levenson RM, Chung LWK, Nie S. In vivo Cancer Targeting and Imaging with Semiconductor Quantum Dots. Nat Biotechnol. 2004;22:969–976. doi: 10.1038/nbt994. [DOI] [PubMed] [Google Scholar]
- 5.Ye L, Yong K-T, Liu L, Roy I, Hu R, Zhu J, Cai H, Law W-C, Liu J, Wang K, et al. A Pilot Study in Non-Human Primates Shows No Adverse Response to Intravenous Injection of Quantum Dots. Nat Nanotechnol. 2012 doi: 10.1038/nnano.2012.74. [DOI] [PubMed] [Google Scholar]
- 6.Derfus AM, Chan WCW, Bhatia SN. Probing the Cytotoxicity of Semiconductor Quantum Dots. Nano Lett. 2004;4:11–18. doi: 10.1021/nl0347334. [DOI] [PMC free article] [PubMed] [Google Scholar]
- 7.Kirchner C, Liedl T, Kudera S, Pellegrino T, Muñoz Javier A, Gaub HE, Stölzle S, Fertig N, Parak WJ. Cytotoxicity of Colloidal CdSe and CdSe/ZnS Nanoparticles. Nano Lett. 2005;5:331–338. doi: 10.1021/nl047996m. [DOI] [PubMed] [Google Scholar]
- 8.Su Y, He Y, Lu H, Sai L, Li Q, Li W, Wang L, Shen P, Huang Q, Fan C. The Cytotoxicity of Cadmium Based, Aqueous Phase - Synthesized, Quantum Dots and Its Modulation by Surface Coating. Biomaterials. 2009;30:19–25. doi: 10.1016/j.biomaterials.2008.09.029. [DOI] [PubMed] [Google Scholar]
- 9.Su Y, Hu M, Fan C, He Y, Li Q, Li W, Wang L-H, Shen P, Huang Q. The Cytotoxicity of CdTe Quantum Dots and the Relative Contributions From Released Cadmium Ions and Nanoparticle Properties. Biomaterials. 2010;31:4829–4834. doi: 10.1016/j.biomaterials.2010.02.074. [DOI] [PubMed] [Google Scholar]
- 10.Shiohara A, Hoshino A, Hanaki K, Suzuki K, Yamamoto K. On the Cyto-Toxicity Caused by Quantum Dots. Microbiol Immunol. 2004;48:669–675. doi: 10.1111/j.1348-0421.2004.tb03478.x. [DOI] [PubMed] [Google Scholar]
- 11.Chen N, He Y, Su Y, Li X, Huang Q, Wang H, Zhang X, Tai R, Fan C. The Cytotoxicity of Cadmium-Based Quantum Dots. Biomaterials. 2012;33:1238–1244. doi: 10.1016/j.biomaterials.2011.10.070. [DOI] [PubMed] [Google Scholar]
- 12.Fischer HC, Hauck TS, Gómez-Aristizábal A, Chan WCW. Exploring Primary Liver Macrophages for Studying Quantum Dot Interactions with Biological Systems. Adv Mater. 2010;22:2520–2524. doi: 10.1002/adma.200904231. [DOI] [PubMed] [Google Scholar]
- 13.Diagaradjane P, Deorukhkar A, Gelovani JG, Maru DM, Krishnan S. Gadolinium Chloride Augments Tumor-Specific Imaging of Targeted Quantum Dots in vivo. ACS Nano. 2010;4:4131–4141. doi: 10.1021/nn901919w. [DOI] [PMC free article] [PubMed] [Google Scholar]
- 14.Hewitt NJ, Lechón MJG, Houston JB, Hallifax D, Brown HS, Maurel P, Kenna JG, Gustavsson L, Lohmann C, Skonberg C, et al. Primary Hepatocytes: Current Understanding of the Regulation of Metabolic Enzymes and Transporter Proteins, and Pharmaceutical Practice for the Use of Hepatocytes in Metabolism, Enzyme Induction, Transporter, Clearance, and Hepatotoxicity Studies. Drug Metabolism Reviews. 2007;39:159–234. doi: 10.1080/03602530601093489. [DOI] [PubMed] [Google Scholar]
- 15.Sellaro TL, Ranade A, Faulk DM, McCabe GP, Dorko K, Badylak SF, Strom SC. Maintenance of Human Hepatocyte Function in vitro by Liver-Derived Extracellular Matrix Gels. Tissue Eng Part A. 2010;16:1075–1082. doi: 10.1089/ten.tea.2008.0587. [DOI] [PMC free article] [PubMed] [Google Scholar]
- 16.Gross-Steinmeyer K, Stapleton PL, Tracy JH, Bammler TK, Lehman T, Strom SC, Eaton DL. Influence of Matrigel-Overlay on Constitutive and Inducible Expression of Nine Genes Encoding Drug-Metabolizing Enzymes in Primary Human Hepatocytes. Xenobiotica. 2005;35:419–438. doi: 10.1080/00498250500137427. [DOI] [PubMed] [Google Scholar]
- 17.Tuschl G, Hrach J, Walter Y, Hewitt PG, Mueller SO. Serum-Free Collagen Sandwich Cultures of Adult Rat Hepatocytes Maintain Liver-Like Properties Long Term: a Valuable Model for in vitro Toxicity and Drug-Drug Interaction Studies. Chemico-Biological Interactions. 2009;181:124–137. doi: 10.1016/j.cbi.2009.05.015. [DOI] [PubMed] [Google Scholar]
- 18.Tu Z, Bozorgzadeh A, Crispe IN, Orloff MS. The Activation State of Human Intrahepatic Lymphocytes. Clin Exp Immunol. 2007;149:186–193. doi: 10.1111/j.1365-2249.2007.03415.x. [DOI] [PMC free article] [PubMed] [Google Scholar]
- 19.Cho SJ, Maysinger D, Jain M, Röder B, Hackbarth S, Winnik FM. Long-Term Exposure to CdTe Quantum Dots Causes Functional Impairments in Live Cells. Langmuir. 2007;23:1974–1980. doi: 10.1021/la060093j. [DOI] [PubMed] [Google Scholar]
- 20.Eaton DL, Stacey NH, Wong KL, Klaassen CD. Dose-Response Effects of Various Metal Ions on Rat Liver Metallothionein, Glutathione, Heme Oxygenase, and Cytochrome P-450. Toxicology and Applied Pharmacology. 1980;55:393–402. doi: 10.1016/0041-008x(80)90101-5. [DOI] [PubMed] [Google Scholar]
- 21.Tchounwou PB, Ishaque AB, Schneider J. Cytotoxicity and Transcriptional Activation of Stress Genes in Human Liver Carcinoma Cells (HepG2) Exposed to Cadmium Chloride. Mol Cell Biochem. 2001;222:21–28. [PubMed] [Google Scholar]
- 22.Zimmermann HW, Seidler S, Gassler N, Nattermann J, Luedde T, Trautwein C, Tacke F. Interleukin-8 Is Activated in Patients with Chronic Liver Diseases and Associated with Hepatic Macrophage Accumulation in Human Liver Fibrosis. PLoS ONE. 2011;6:e21381. doi: 10.1371/journal.pone.0021381. [DOI] [PMC free article] [PubMed] [Google Scholar]
- 23.Dudley RE, Klaassen CD. Changes in Hepatic Glutathione Concentration Modify Cadmium-Induced Hepatotoxicity. Toxicology and Applied Pharmacology. 1984;72:530–538. doi: 10.1016/0041-008x(84)90130-3. [DOI] [PubMed] [Google Scholar]
- 24.Weldy CS, Wilkerson H-W, Larson TV, Stewart JA, Kavanagh TJ. DIESEL Particulate Exposed Macrophages Alter Endothelial Cell Expression of eNOS, iNOS, MCP1, and Glutathione Synthesis Genes. Toxicol In Vitro. 2011;25:2064–2073. doi: 10.1016/j.tiv.2011.08.008. [DOI] [PMC free article] [PubMed] [Google Scholar]
- 25.Krejsa CM, Franklin CC, White CC, Ledbetter JA, Schieven GL, Kavanagh TJ. Rapid Activation of Glutamate Cysteine Ligase Following Oxidative Stress. J Biol Chem. 2010;285:16116–16124. doi: 10.1074/jbc.M110.116210. [DOI] [PMC free article] [PubMed] [Google Scholar]
- 26.Yao P, Hao L, Nussler N, Lehmann A, Song F, Zhao J, Neuhaus P, Liu L, Nussler A. The Protective Role of HO-1 and Its Generated Products (CO, Bilirubin, and Fe) in Ethanol-Induced Human Hepatocyte Damage. Am J Physiol-Gastr L. 2009;296:G1318–23. doi: 10.1152/ajpgi.00555.2007. [DOI] [PubMed] [Google Scholar]
- 27.McConnachie LA, White CC, Botta D, Zadworny ME, Cox DP, Beyer RP, Hu X, Eaton DL, Gao X, Kavanagh TJ. Heme Oxygenase Expression as a Biomarker of Exposure to Amphiphilic Polymer-Coated CdSe/ZnS Quantum Dots. Nanotoxicology. 2012 doi: 10.3109/17435390.2011.648224. [DOI] [PMC free article] [PubMed] [Google Scholar]
- 28.Otterbein LE, Soares MP, Yamashita K, Bach FH. Heme Oxygenase-1: Unleashing the Protective Properties of Heme. Trends Immunol. 2003;24:449–455. doi: 10.1016/s1471-4906(03)00181-9. [DOI] [PubMed] [Google Scholar]
- 29.Fischer HC, Liu L, Pang KS, Chan WCW. Pharmacokinetics of Nanoscale Quantum Dots: In Vivo Distribution, Sequestration, and Clearance in the Rat. Adv Funct Mater. 2006;16:1299–1305. [Google Scholar]
- 30.Oo YH, Adams DH. The Role of Chemokines in the Recruitment of Lymphocytes to the Liver. Journal of Autoimmunity. 2010;34:45–54. doi: 10.1016/j.jaut.2009.07.011. [DOI] [PubMed] [Google Scholar]
- 31.Hintermann E, Bayer M, Pfeilschifter JM, Luster AD, Christen U. CXCL10 Promotes Liver Fibrosis by Prevention of NK Cell Mediated Hepatic Stellate Cell Inactivation. Journal of Autoimmunity. 2010;35:424–435. doi: 10.1016/j.jaut.2010.09.003. [DOI] [PMC free article] [PubMed] [Google Scholar]
- 32.Zhang T, Guo CJ, Li Y, Douglas SD, Qi XX, Song L, Ho WZ. Interleukin-1 [Beta] Induces Macrophage Inflammatory Protein-1 [Beta] Expression in Human Hepatocytes. Cellular immunology. 2003;226:45–53. doi: 10.1016/j.cellimm.2003.10.005. [DOI] [PMC free article] [PubMed] [Google Scholar]
- 33.Otterbein LE, Bach FH, Alam J, Soares M, Tao Lu H, Wysk M, Davis RJ, Flavell RA, Choi AM. Carbon Monoxide Has Anti-Inflammatory Effects Involving the Mitogen-Activated Protein Kinase Pathway. Nat Med. 2000;6:422–428. doi: 10.1038/74680. [DOI] [PubMed] [Google Scholar]
- 34.Dulak J, Łoboda A, Zagórska A, Józkowicz A. Complex Role of Heme Oxygenase-1 in Angiogenesis. Antioxid Redox Signal. 2004;6:858–866. doi: 10.1089/ars.2004.6.858. [DOI] [PubMed] [Google Scholar]
- 35.Datta D, Dormond O, Basu A, Briscoe DM, Pal S. Heme Oxygenase-1 Modulates the Expression of the Anti-Angiogenic Chemokine CXCL-10 in Renal Tubular Epithelial Cells. Am J Physiol Renal Physiol. 2007;293:F1222–30. doi: 10.1152/ajprenal.00164.2007. [DOI] [PubMed] [Google Scholar]
- 36.Kanakiriya SKR, Croatt AJ, Haggard JJ, Ingelfinger JR, Tang S-S, Alam J, Nath KA. Heme: a Novel Inducer of MCP-1 Through HO-Dependent and HO-Independent Mechanisms. Am J Physiol Renal Physiol. 2003;284:F546–54. doi: 10.1152/ajprenal.00298.2002. [DOI] [PubMed] [Google Scholar]
- 37.CALLERY MP, Mangino MJ, Flye MW. Arginine-Specific Suppression of Mixed Lymphocyte Culture Reactivity by Kupffer Cells - a Basis of Portal Venous Tolerance. Transplantation. 1991;51:1076–1080. doi: 10.1097/00007890-199105000-00028. [DOI] [PubMed] [Google Scholar]
- 38.Pellegrino T, Manna L, Kudera S, Liedl T, Koktysh D, Rogach AL, Keller S, Rädler J, Natile G, Parak WJ. Hydrophobic Nanocrystals Coated with an Amphiphilic Polymer Shell: a General Route to Water Soluble Nanocrystals. Nano Lett. 2004;4:703–707. [Google Scholar]
- 39.Page JL, Johnson MC, Olsavsky KM, Strom SC, Zarbl H, Omiecinski CJ. Gene Expression Profiling of Extracellular Matrix as an Effector of Human Hepatocyte Phenotype in Primary Cell Culture. Toxicological Sciences. 2007;97:384–397. doi: 10.1093/toxsci/kfm034. [DOI] [PMC free article] [PubMed] [Google Scholar]
- 40.Mosmann T. Rapid Colorimetric Assay for Cellular Growth and Survival: Application to Proliferation and Cytotoxicity Assays. Journal of Immunological Methods. 1983;65:55–63. doi: 10.1016/0022-1759(83)90303-4. [DOI] [PubMed] [Google Scholar]
- 41.White C. Fluorescence-Based Microtiter Plate Assay for Glutamate–Cysteine Ligase Activity. Analytical Biochemistry. 2003;318:175–180. doi: 10.1016/s0003-2697(03)00143-x. [DOI] [PubMed] [Google Scholar]
Associated Data
This section collects any data citations, data availability statements, or supplementary materials included in this article.