

Abstract
Branched-chain ketoacid dehydrogenase deficiency results in complex and volatile metabolic derangements that threaten brain development. Treatment for classical maple syrup urine disease (MSUD) should address this underlying physiology while also protecting children from nutrient deficiencies. Based on a 20-year experience managing 79 patients, we designed a study formula to (1) optimize transport of seven amino acids (Tyr, Trp, His, Met, Thr, Gln, Phe) that compete with branched-chain amino acids (BCAAs) for entry into the brain via a common transporter (LAT1), (2) compensate for episodic depletions of glutamine, glutamate, and alanine caused by reverse transamination, and (3) correct deficiencies of omega-3 essential fatty acids, zinc, and selenium widespread among MSUD patients. The formula was enriched with LAT1 amino acid substrates, glutamine, alanine, zinc, selenium, and alphalinolenic acid (18:3n – 3). Fifteen Old Order Mennonite children were started on study formula between birth and 34 months of age and seen at least monthly in the office. Amino acid levels were checked once weekly and more often during illnesses. All children grew and developed normally over a period of 14– 33 months. Energy demand, leucine tolerance, and protein accretion were tightly linked during periods of normal growth. Rapid shifts to net protein degradation occurred during illnesses. At baseline, most LAT1 substrates varied inversely with plasma leucine, and their calculated rates of brain uptake were 20–68% below normal. Treatment with study formula increased plasma concentrations of LAT1 substrates and normalized their calculated uptakes into the nervous system. Red cell membrane omega-3 polyunsaturated fatty acids and serum zinc and selenium levels increased on study formula. However, selenium and docosahexaenoic acid (22:6n – 3) levels remained below normal. During the study period, hospitalizations decreased from 0.35 to 0.14 per patient per year. There were 28 hospitalizations managed with MSUD hyperalimentation solution; 86% were precipitated by common infections, especially vomiting and gastroenteritis. The large majority of catabolic illnesses were managed successfully at home using ‘sickday’ formula and frequent amino acid monitoring. We conclude that the study formula is safe and effective for the treatment of classical MSUD. In principle, dietary enrichment protects the brain against deficiency of amino acids used for protein accretion, neurotransmitter synthesis, and methyl group transfer. Although the pathophysiology of MSUD can be addressed through rational formula design, this does not replace the need for vigilant clinical monitoring, frequent measurement of the complete amino acid profile, and ongoing dietary adjustments that match nutritional intake to the metabolic demands of growth and illness.
Keywords: Maple syrup urine disease, Branched-chain ketoacid dehydrogenase, Amino acid transport, Blood, brain barrier, Brain development, Leucine, Alpha-ketoisocaproic acid
“An amino acid accumulating in excess may occasion sequestering of certain amino acids by inhibiting the transport route of their exodus from, more than their entry into, various tissues, such as liver and muscle, at the same time that it inhibits the inward movement of certain other amino acids across the blood–brain barrier. The total effect of these two actions determines, I propose, which amino acids may be depleted in the brain in the hyperphenylalaninemia of PKU or in the leucine accumulation of maple syrup urine disease.”
– H.N. Christensen, 1987.
Introduction
Classical maple syrup urine disease (MSUD) is caused by deficiency of branched-chain ketoacid dehydrogenase (BCKDH), a mitochondrial enzyme in the degradation pathway of the branched-chain amino acids (BCAAs; leucine, isoleucine, and valine) and their ketoacid derivatives (BCKAs). Acute elevations of leucine and alpha-ketoisocaproic acid (aKIC) cause metabolic encephalopathy and life-threatening brain edema [1], whereas prolonged imbalances of circulating amino acids may have more subtle and lasting effects on brain structure and function [2–4].
Cerebral amino acid deprivation appears central to the pathophysiology of MSUD. We began to explore this idea in the 1990s, when we encountered equations that describe competitive bloodto-brain transport among10 amino acids: leucine, isoleucine, valine, phenylalanine, tyrosine, tryptophan, histidine, methionine, threonine, and glutamine [5,6]. We developed a spreadsheet to estimate blood-to-brain transport from clinical data [5] (Appendix) and found that some MSUD patients may have chronically low cerebral uptake of several amino acids (Fig. 1). Other investigators had shown that aKIC can alter tissue amino acid content by disrupting transamination fluxes [7,8]. In catabolic muscle, elevated aKIC prevents the normal flow of BCAA nitrogen into glutamine and alanine synthesis [9,10]. In nervous tissue, where cytosolic and mitochondrial transaminases normally transfer BCAA nitrogen into neurotransmitter pools [7,11], excess aKIC appears to reverse this flow and deplete tissues of glutamate, glutamine, GABA, and aspartate (Fig. 2) [1,3,7,8,12–15].]
Fig. 1.

Uptake values of 10 amino acids competing for a common transporter (LAT1) at the blood–brain barrier were calculated from plasma amino acid profiles of a Mennonite boy drinking a standard infant MSUD formula. Samples were collected during the 22 months before the trial period. Uptake values are expressed as z-scores, where z = [(patient value − control mean)/control standard deviation]. Normal values, taken from 52 control subjects, lie between +2 and −2 (gray area). Averaged over long periods, brain uptake of most LAT1 substrates is low (right panel). Uptake values for BCAAs (left panel) are highly variable, reflecting the unstable BCAA homeostasis characteristic of classical MSUD.
Fig. 2.

In brain, aKIC likely depletes glutamate through reverse transamination to leucine and alpha-ketoglutarate; this in turn affects brain content of GABA and glutamine (See Fig. 8). (A) In 1966, Prensky and Moser compared brain free amino acids from a 25 day-old infant who died in MSUD crisis (black bars) to a 4 day-old infant who did not have the disease (gray bars). They found profound depletion of glutamate, glutamine, and GABA in MSUD brain tissue (Ref. [15]). A similar phenomenon is observed in cultured astrocytes, Dbt−/− mice, and Poll-Hereford calves with MSUD (Refs. [12–14]). (B) The predominant effect of elevated aKIC in muscle may be to deplete alanine to form leucine and pyruvate. In a Mennonite child, plasma leucine (solid line) and alanine (dashed line) are reciprocally related over a 22-month period (rs = −0.86, p < 0.0001), suggesting this depletion mechanism operates in vivo (See Table 1).
Between 2003 and 2004, we recognized other nutritional deficiencies that threaten brain development [16–21]. Most metabolic formulas manufactured at that time had little or no omega-3 polyunsaturated fatty acid (PUFA), and we found that nearly all of our MSUD patients had omega-3 PUFA deficiency [1,22]. Docosahexaenoic acid (DHA; 22:6n – 3), the PUFA most important for brain function [17,19,20,23], was less than 50% of normal in patient red cell membranes [1]. In 2004, we cared for a 3 year-old MSUD patient who had intractable diarrhea and acrodermatitis due to zinc deficiency. We subsequently identified marginal zinc levels in most of our patients [16,24,25]. Like zinc, selenoproteins are enriched in the brain, where they may protect synaptic membranes, myelin, and monoamine transmitters from oxidative damage [25–31]. Consistent with other reports [27,32,33], we found blood selenium levels to be only 40% of normal in our Mennonite MSUD patients.
We hypothesized that a single dietary formulation could be designed to counter the metabolic derangements that cause brain disease while also providing a nutritional safety net against essential lipid and micronutrient deficiencies. We designed a new formula based on four concepts: (1) the composition of amino acids was crafted to optimize the pattern of circulating amino acids that supplies nervous tissue, focusing upon brain uptake of each amino acid, rather than plasma concentration; (2) conditionally essential amino acids such as glutamine and alanine were fortified to buffer against their depletion by high tissue aKIC (Table 1); (3) essential fatty acids, vitamins, minerals, and micronutrients were chosen to support normal development and correct existing deficiencies; (4) based on amino acid monitoring, the dietary prescription was repeatedly adjusted to account for dynamic changes of metabolic homeostasis characteristic of MSUD, especially the frequent catabolic episodes triggered by minor infections [2]. We evaluated the physiologic actions of this new formula over a 33-month trial in 15 Mennonite infants. Our observations provide a robust conceptual framework for the prevention of brain disease in MSUD.
Table 1.
Spearman correlations (rs) between plasma leucine and other amino acids.
| Pre-trial MSUD formula (N = 29)
|
Study formula (N = 15)
|
|||
|---|---|---|---|---|
| rs | p | rs | p | |
| Alanine | −0.86 | <0.0001 | −0.73 | <0.0001 |
| Glutamine | −0.62 | 0.0003 | −0.74 | <0.0001 |
| Threonine | −0.47 | 0.011 | −0.33 | 0.0481 |
| Tryptophan | −0.46 | 0.012 | −0.19 | 0.07 |
| Histidine | −0.44 | 0.016 | – | ns |
| Methionine | −0.4 | 0.03 | – | ns |
| Tyrosine | −0.39 | 0.035 | −0.18 | 0.02 |
ns, not significant (p ≥ 0.05).
Patients and methods
Protocol design
Between September 2005 and June 2008, we studied 15 Old Order Mennonite children with classical MSUD resulting from homozygous c.1312T>A mutations in BCKDHA. Nine children started the new MSUD formula between 1 and 34 months of age (mean age 18 ± 12 months) and six additional children were treated from birth. The average treatment period was 29 ± 7 months (range 14–33 months). The new formula, called Complex Infant (Applied Nutrition Corporation), contained 4.8 kcal/g and had a calorie breakdown of 11% protein, 42% carbohydrate, and 47% fat. It was enriched with selenium, zinc, alpha-linolenic acid (18:3n – 3), and a group of amino acids that compete with BCAA for uptake into the brain (Table 2). Formula was supplied to all participants free of charge. The Institutional Review Board of Lancaster General Hospital approved the study and all parents consented in writing to participate.
Table 2.
Comparison of study formula to human milk.
| Human milkb | Study formula | Relative intakec | |
|---|---|---|---|
| Protein (g) per 100 mLa | 10 | 17 | 1.7 |
| Amino acids (wt.% total) | |||
| Histidine | 3.0 | 4.2 | 2.4 |
| Methionine | 1.7 | 4.5 | 4.5 |
| Phenylalanine | 5.0 | 7.5 | 2.6 |
| Threonine | 5.7 | 8.0 | 2.4 |
| Tryptophan | 2.0 | 5.0 | 4.3 |
| Tyrosine | 5.4 | 7.4 | 2.3 |
| Alanine | 5.2 | 10.0 | 3.3 |
| Glutamine | 20.0 | 12.1 | 1.0 |
| Linoleic acid (wt.% total fat) | 8.9 | 15.6 | 3.0 |
| Alpha-linolenic acid (wt.% fat) | 1.2 | 9.0 | 12.8 |
| DHA (wt.% fat) | 0.3 | 0.0 | 0.0 |
| Iron (mg/100 kcal) | 0.05 | 3.2 | 109 |
| Zinc (mg/100 kcal) | 0.1 | 4.0 | 76 |
| Selenium (μg/100 kcal) | 2.2 | 6.2 | 5 |
When mixed to standard concentration of 0.67 calories/mL.
Data from R.M. Hanning et al., Am. J. Clin. Nutr. 56 (1992) 1004–1011.
Intake multiplier relative to the intake from an equal daily volume of breastmilk.
After starting study formula, each child was evaluated monthly for a minimum of 1 year. Physical growth and neurological development (Denver Developmental Screening Test II) were monitored throughout the study. We collected random plasma amino acids each month for statistical analysis and monitored amino acids at least once weekly using dried filter paper blood spots sent from home. Random sampling was done to capture the full variation of plasma amino acid values in relation to feeding; this most accurately reflects the biochemical effects of intermittent feeding over a normal 24-h day. The first nine children enrolled were taking another BCAA-free infant formula, MSUD Diet Powder (Mead Johnson Nutrition), at baseline. Laboratory studies were collected before they switched to study formula (baseline), and again 6 months and 12 months after the start of treatment. The test battery included hemoglobin, mean corpuscular volume, platelet count, absolute lymphocyte count, serum sodium, potassium, calcium, selenium, zinc, urea nitrogen, creatinine, alanine transaminase, alkaline phosphatase, total bilirubin, albumin, immunoglobulin G, and total 25-hydroxyvitamin D. Red blood cell essential polyunsaturated fatty acids (PUFAs) were obtained at baseline and after 1 year of therapy. Serum iron, vitamin B12, and red blood cell folate were collected after 1 year.
Laboratory values were analyzed using one-way analysis of variance (ANOVA). For most tests, the three comparison groups were baseline (before treatment), 6 months, and 12 months of therapy. For red blood cell membrane fatty acid values (reported in wt.%) the groups were healthy control children (N = 54), classical MSUD patients treated with MSUD Diet Powder (N = 78) and children treated with study formula (N = 15). For ANOVA p values less than 0.05, we used the Tukey post-test to detect pairwise differences among groups (Tukey p < 0.05). Associations between two variables were tested using Spearman’s test for correlation and reported as correlation coefficients (rs).
Leucine tolerance and management of metabolic intoxication
Leucine tolerance was defined as the weight-adjusted daily leucine intake associated with normal growth and steady-state leucine levels [34]. Because classical MSUD patients do not oxidize leucine [35,36], leucine tolerance reflects the sum of insensible protein loss and net protein accretion [35].
Episodic elevations of leucine were managed at home using ‘sick-day’ diet devoid of leucine and high in calories (120– 170 kcal/kg day), isoleucine, and valine (each 15–30 mg/kg day) [1,37]. To meet sick-day goals, we substituted the dietary BCAA source with study formula powder, mixed the formula to a higher density (0.8–1.0 kcal/mL), and aimed for a 5–15% higher daily volume intake. This increased formula powder intake (in g) by 40– 100% on sick-days. Supplemental carbohydrates (e.g., glucose polymers) and lipids were not used.
The most common reason for hospitalization was intractable vomiting, from either gastroenteritis or metabolic encephalopathy. Other indications included trauma, planned or non-elective surgery, or persistent metabolic intoxication despite maximal outpatient therapy. We treated hospitalized patients with parenteral nutrition, combined with enteral feeding as tolerated, to provide 150–200% of calculated energy expenditure (50% as carbohydrate and 50% as lipid), 2.5–3 g/kg day of BCAA-free amino acids, and an additional 20–120 mg/kg day each of isoleucine and valine, adjusted based on plasma monitoring [3,37]. Individual amino acids (Ajinomoto International) were mixed into intravenous solutions in a sterile pharmaceutical clean room at Lancaster General Hospital. For encephalopathic infants, continuous nasogastric feeding was an effective method of formula delivery. For older children, a dual-lumen percutaneous intravenous central catheter was placed when possible; this constrained fluid volumes entailed by high-calorie therapy.
We gave supplemental insulin (0.05–0.15 U/kg h) to all infants on hyperalimentation and actively tracked fluid and electrolytes to prevent hypo-osmolarity and control brain edema [37]. Specifically, we used a sequence of furosemide (1 mg/kg IV push), mannitol (0.5 g/kg over 30 min), and hypertonic saline (2–3 mEq/kg over 60–90 min) to manage decreasing serum osmolarity, a large fluid surfeit, brain swelling on computed tomography scan (decreased gray-white differentiation, compressed ventricles and basal cisterns), or signs of worsening brain edema (e.g., diminished level of arousal, abnormal eye movements or pupillary reflexes, incessant vomiting, decorticate or decerebrate posturing, bradycardic hypertension). Severely intoxicated children sometimes needed osmotherapy every 6–8 h for the first 24–48 h of hospitalization, particularly if they had only peripheral intravenous access and required high fluid infusion rates.
To prevent vomiting at home or in the hospital, we gave sublingual or intravenous odansetron (0.15–0.2 mg/kg dose every 8 h), respectively. Leucine was reintroduced, either enterally or parenterally, when the plasma level was less than 100 μM.
Calculation of brain amino acid uptake
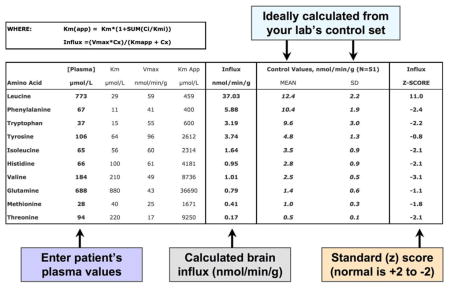
A custom Excel spreadsheet (Microsoft Corporation) was designed to estimate the transport of BCAAs and seven other amino acids from blood to brain (Appendix) [38]. Briefly, a group of neutral amino acids (glutamine, histidine, isoleucine, leucine, methionine, phenylalanine, threonine, tryptophan, tyrosine, and valine), most of which are essential, compete for entry into the brain across a common sodium-independent facilitative transporter (LAT1; SLC7A5) [5,39]. The transporter is saturated under physiological conditions, such that cerebral uptake of each amino acid is influenced by ambient concentrations of its competitors [5]. Substrate competition is expressed by an apparent Km, called Kapp (μM), calculated for each amino acid according to the equation:
Km is the classical Michaelis–Menten affinity constant for the single amino acid of interest, Ci is the plasma concentration (μM) for each of n competitors, and Ki is the classical affinity constant of that competitor (μM).
For a given plasma amino acid profile, Kapp values were determined for each LAT1 substrate using published Michaelis–Menten parameters for LAT1 [5]. The Kapp value was then used to calculate the brain influx (nanomoles per minute per gram of brain tissue) of each amino acid in the competing group, according to the equation: Influx = (Vmax)(C)/(Kapp + C), where Vmax and C are the maximal transport velocity (nmol/min g) and plasma concentration (μM), respectively, of each amino acid. Results for estimated brain influx values were compared to calculations from a control population of 52 Amish children not affected by disorders of amino acid or organic acid metabolism. For Fig. 1, brain influx values are depicted as standard scores (i.e., z-scores), where z = [(patient value − control mean)/control standard deviation].
Results
Growth, development, hospitalizations, and leucine tolerance
Complex Infant was well tolerated and there were no adverse events related to its use. All children grew and developed normally. There were 28 hospitalizations during the study; all but four were due to a common childhood infection (Table 3A). Vomiting was the most common indication for hospitalization (40%). During the study, the frequency and duration of hospitalizations decreased by 68% and 59%, respectively. Interestingly, these rates decreased for all MSUD patients under our care (Table 3B), not just trial participants. The mean hospital stay was 4 days, during which plasma leucine decreased at a rate of 644 ± 447 μmol/L day (range 240– 1752 μmol/L day), reflecting average net endogenous protein synthetic rates of 0.6 ± 0.4 g/kg day (range 0.2–1.6 g/kg day) in response to anabolic therapy.
Table 3A.
Reasons for 28 hospitalizations during the study.
| Indication for hospitalization | Number |
|---|---|
| Vomiting and viral gastroenteritis | 11 |
| Viral bronchiolitis | 3 |
| Sinusitis | 3 |
| Neonatal encephalopathy | 3 |
| Urinary tract infection | 2 |
| Cellulitis | 1 |
| Influenza | 1 |
| Viral meningitis | 1 |
| Bacterial pharyngitis | 1 |
| Esophageal candidiasis | 1 |
| Appendicitis | 1 |
Table 3B.
Hospital admissions and days (per patient per year).
| Admissions | Hospital days | |
|---|---|---|
| All MSUD patients | ||
| 2003 (N = 66) | 0.35 | 1.59 |
| 2004 (N = 68) | 0.35 | 0.93 |
| 2005 (N = 71) | 0.18 | 0.65 |
| 2006 (N = 77) | 0.12 | 0.36 |
| 2007 (N = 79) | 0.11 | 0.38 |
| Trial patients, 2005–7 (N = 15) | 0.14 | 0.48 |
Energy requirements and leucine tolerance decreased over the first 4 years of life (Fig. 3, Table 4) and were tightly correlated (rs = 0.90, p < 0.0001; Fig. 4). Total protein intake also decreased, from 2.4 ± 0.4 g/kg day in neonates to 1.5 ± 0.3 g/kg day in older children (Fig. 3). In individual children, there was a striking correlation between leucine tolerance and the calculated rate of protein accretion (Fig. 4), which was assumed to represent 12.5% of weight gain [40].
Fig. 3.

Serial leucine, energy, and protein intakes of 15 Mennonite infants with MSUD treated with study formula.
Table 4.
Mean and 25th to 75th percentile range (italicized) nutrient intakes (per kg day) according to age group.
| Nutrient intake per kg day | 0–2 months (N = 31) | 3–5 months (N = 18) | 6–8 months (N = 21) | 9–12 months (N = 18) | 13–18 months (N = 21) | 19–24 months (N = 18) | 25–36 months (N = 32) | |||||||
|---|---|---|---|---|---|---|---|---|---|---|---|---|---|---|
| Leucine (mg) | 72 | 64–84 | 58 | 47–68 | 44 | 37–51 | 35 | 30–41 | 33 | 26–39 | 27 | 22–28 | 21 | 20–25 |
| Energy (kcal) | 111 | 103–119 | 99 | 94–107 | 89 | 82–99 | 78 | 71–87 | 67 | 55–77 | 57 | 49–71 | 38 | 39–51 |
| Total protein (g) | 2.4 | 2.1–2.6 | 2.3 | 1.9–2.6 | 2.2 | 1.8–2.5 | 2.0 | 1.5–2.5 | 2.1 | 1.8–2.4 | 2 | 1.7–2.3 | 1.5 | 1.5–2.9 |
| Isoleucine supplement (mg) | 4.4 | 0–7 | 2.3 | 0–3.6 | 2.7 | 0–3.9 | 2.6 | 0–3.6 | 3.8 | 2.1–5.1 | 3.7 | 1.0–3.6 | 5.5 | 3.5–6.2 |
| Valine supplement (mg) | 11.5 | 9.8–14.8 | 11.4 | 9.0–13.0 | 11.0 | 9.5–12.1 | 8.1 | 6.3–9.4 | 7.8 | 5.4–10.0 | 6.2 | 2.3–9.3 | 5.8 | 4.9–8.7 |
| Alanine intake (mg) | 233 | 200–262 | 209 | 197–234 | 206 | 193–225 | 189 | 168–218 | 178 | 159–199 | 159 | 140–192 | 117 | 114–149 |
| Glutamine intake (mg) | 416 | 361–471 | 363 | 337–405 | 358 | 332–400 | 320 | 288–371 | 294 | 252–337 | 256 | 221–318 | 184 | 181–235 |
| Iron (mg) | 2.2 | 1.9–2.5 | 2.1 | 1.9–2.2 | 2.1 | 2.0–2.2 | 2.0 | 1.6–2.2 | 2.0 | 1.8–2.1 | 1.8 | 1.5–2.1 | 1.3 | 1.3–1.6 |
| Zinc (mg) | 4.6 | 3.7–4.9 | 4.0 | 3.7–4.0 | 4.0 | 3.7–4.3 | 3.7 | 3.1–4.3 | 3.7 | 3.4–4.0 | 3.4 | 2.9–4.0 | 2.6 | 2.6–3.1 |
| Selenium (μg) | 7.0 | 5.7–7.5 | 6.2 | 5.7–7.0 | 6.2 | 5.7–6.6 | 5.7 | 4.8–6.6 | 5.7 | 5.3–6.2 | 5.3 | 4.4–6.2 | 4.0 | 4.0–4.8 |
| Omega-3 fatty acids, as 18:3n – 3 (mg) | 378 | 307–401 | 330 | 307–378 | 330 | 307–354 | 307 | 260–354 | 307 | 283–330 | 283 | 236–330 | 212 | 212–260 |
| Leucine/energy ratio (mg/kcal) | 0.65 | 0.57–0.72 | 0.58 | 0.48–0.66 | 0.50 | 0.43–0.56 | 0.46 | 0.37–0.53 | 0.50 | 0.43–0.58 | 0.48 | 0.38–0.58 | 0.54 | 0.44–0.55 |
Fig. 4.

(A) In infants with classical MSUD, BCKDH activity is absent and urine and insensible losses of leucine are negligible. Thus, leucine tolerance naturally traces the balance between protein degradation and synthesis. (B) Protein accretion is energetically costly, illustrated by the close correlation between leucine tolerance (x-axis) and energy demand (y-axis) during the first 4 years of life (rs = 0.9, p < 0.0001).
Children were allowed to transition to table foods based on their developmental readiness and parent intent. Most children made the transition between the ages of 12 and 24 months. This was accompanied by a 30–35% decrease of weight-adjusted formula intake. The supplemental valine dose decreased over time (from 11.5 ± 5.0 to 5.8 ± 2.6 mg/kg day) while isoleucine dose remained relatively constant (from 4.4 ± 4.4 to 5.5 ± 2.4 mg/kg day) (Table 4).
Plasma amino acid homeostasis and brain uptake
Plasma amino acid concentrations and calculated rates of brain uptake are summarized in Table 5. At baseline, mean plasma BCAA levels were significantly elevated, tryptophan levels were about 50% of normal, and calculated brain uptakes of tryptophan, methionine, histidine, glutamine, phenylalanine, and threonine were reduced by 68%, 40%, 36%, 29%, 21%, and 20%, respectively. Calculated isoleucine uptake by the nervous system was higher than normal at baseline and during treatment, indicating over-supplementation (Table 5).
Table 5.
Mean (SD) plasma concentrations and calculated rates of brain uptake for LAT1 amino acid substrates.
| Amino acid | Control, N = 51 | MSUD baseline, N = 11 | Study formula, N = 36 |
|---|---|---|---|
| Plasma concentration (μM) | |||
| Leucine | 119 (38) | 282 (277)a | 152 (138)b |
| Isoleucine | 65 (25) | 334 (98)a | 245 (89)a,b |
| Valine | 207 (65) | 575 (146)a | 425 (169)a,b |
| Phenylalanine | 55 (18) | 61 (9) | 77 (26)a |
| Tryptophan | 50 (19) | 23 (8)a | 70 (30)a,b |
| Tyrosine | 63 (24) | 79 (35) | 112 (56)a,b |
| Histidine | 87 (29) | 83 (18) | 94 (22) |
| Glutamine | 527 (146) | 578 (75) | 592 (100) |
| Methionine | 31 (10) | 26 (6) | 67 (58)a,b |
| Threonine | 120 (44) | 147 (46) | 249 (87)a,b |
| Calculated brain uptake (nmol/min g) | |||
| Leucine | 12.4 (2.2) | 15.7 (11.9) | 9.7 (7.0)a |
| Isoleucine | 3.5 (0.9) | 12.1 (3.6)a | 8.9 (3.3)a,b |
| Valine | 2.5 (0.5) | 4.6 (1.3)a | 3.4 (1.4)a,b |
| Phenylalanine | 10.4 (1.9) | 8.2 (3.0)a | 9.3 (1.7)a |
| Tryptophan | 9.6 (3.0) | 3.1 (1.6)a | 8.5 (3.0)b |
| Tyrosine | 4.8 (1.3) | 4.3 (2.4) | 5.5 (2.0) |
| Histidine | 2.8 (0.9) | 1.8 (0.5)a | 1.9 (0.5)a |
| Glutamine | 1.4 (0.6) | 1.0 (0.3)a | 1.0 (0.3)a |
| Methionine | 1.0 (0.3) | 0.6 (0.2) | 1.3 (0.8)b |
| Threonine | 0.5 (0.1) | 0.4 (0.2) | 0.6 (0.2)a,b |
Different than control (Tukey p < 0.05).
Different than MSUD baseline (Tukey p < 0.05).
Treatment with study formula decreased mean plasma leucine to the normal range and also decreased its variability (Table 5). Mean concentrations of isoleucine and valine also decreased. In contrast, the concentration of each LAT1 competitor increased, and this was associated with increased uptake of tryptophan, methionine, threonine, phenylalanine, and tyrosine into the nervous system. For each LAT1 substrate, its molar ratio to [leucine + isoleucine] was negatively correlated with its calculated uptake into the brain (Fig. 5) as expected based on transport kinetics [5]. LAT1 substrates tended to rise and fall together, suggesting that intermittent postprandial elevation of amino acids was followed by their uptake and oxidation by tissues.
Fig. 5.
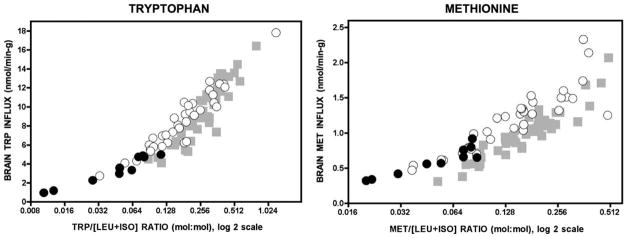
The panels depict how the concentration ratio of an LAT1 substrate (e.g., tryptophan or methionine) to the sum of leucine and isoleucine (x-axis) relates to its calculated uptake across the blood–brain barrier (y-axis). Before the formula trial, low concentration ratios were associated with low brain uptake (black circles). Treatment with study formula (white circles) reduced leucine and isoleucine levels while simultaneously increasing plasma concentrations of other LAT1 substrates (See Table 5). Incrased competitor: [leucine + isoleucine] ratios increased calculated brain uptakes to the control range (gray squares; N = 52). Note the x-axis is a log 2 scale.
Plasma leucine remained inversely related to alanine (rs = −0.73, p < 0.0001) and glutamine (rs = −0.74, p < 0.0001), but treatment with study formula weakened or abolished the reciprocal relationship of leucine to threonine, tryptophan, histidine, methionine, and tyrosine (Table 1). In two male siblings, plasma methionine levels initially increased to as high as 500 μM on study formula but normalized within 4 months. Transient hypermethioninemia was not associated with any clinically apparent adverse effects.
Long-term metabolic control varied considerably from patient to patient, primarily reflecting the frequency and severity of illness (Fig. 6). Plasma leucine rose rapidly during infection, surgery, or injury, but in most cases was successfully controlled with anabolic nutritional therapy at home.
Fig. 6.

(A) Over a 62-day NICU course, a Mennonite infant with Down syndrome suffered from duodenal atresia, large ventricular septal defect, and two episodes of sepsis. Serial monitoring shows the affect of catabolic stress on plasma leucine levels, in each case treated with parenteral nutritional therapy to restore net protein anabolism. (B) The figure depicts once weekly plasma leucine values over a 34-week period from two infants, one shown with a solid line and the other with a dashed line. Leucine levels are erratic relative to the normal homeostatic range (blue shaded area), and metabolic control varies considerably between individuals. Episodic leucine elevations (white circles) reflect transient catabolic states triggered by common infections (e.g., gastroenteritis, otitis, bronchiolitis, etc.).
Nutritional indices
With the important exceptions of selenium and DHA, indices of nutritional sufficiency were stable and normal throughout the study (Table 6). Although treatment raised selenium levels (ANOVA p = 0.0002), they remained lower than normal despite intakes of 4–9 μg/kg day (2- to 3-times recommended daily intake). Study formula increased membrane omega-3 PUFA content (Table 7) and reduced ratios of omega-6 to corresponding omega-3 PUFAs, suggesting a more physiologic balance among functional long-chain species. However, dietary enrichment with alpha-linolenic acid (18:3n –3) did not restore DHA (22:3n – 3) levels to normal; the ratio of DHA to its precursor (docosapentaenoic acid; 22:5n –3) was decreased twofold at baseline and threefold on study formula, suggesting a functional block at this final step of omega-3 PUFA synthesis.
Table 6.
Laboratory indices of nutritional sufficiency in MSUD children as mean (SD) values.
| Reference range | MSUD baseline | Study formula (N = 9)
|
|||
|---|---|---|---|---|---|
| 6 months | 12 months | ANOVA p value | |||
| Hemoglobin (g/dL) | 11–14.5 | 12.1 (1.2) | 12.6 (0.9) | 12.7 (0.5) | NS |
| Mean corpuscular volume (fL) | 74.0–96.0 | 82.8 (4.8) | 80.5 (2.9) | 82.4 (2.5) | NS |
| Platelet count (×103/μL) | 150–450 | 382.6 (98.0) | 362.8 (94.6) | 385.0 (97.6) | NS |
| Absolute lymphocyte count (cells/μL) | 1100–5900 | 5185.6 (1498.6) | 5632.2 (1436.1) | 5202.0 (845.7) | NS |
| Sodium (mEq/L) | 135–145 | 138.4 (1.7) | 137.3 (1.6) | 139.3 (3.0) | NS |
| Potassium (mEq/L) | 3.4–5.4 | 4.7 (0.4) | 4.5 (0.2) | 4.5 (0.3) | NS |
| Calcium (mg/dL) | 8.5–10.6 | 9.8 (0.3) | 9.7 (0.3) | 9.8 (0.5) | NS |
| Selenium (μg/L) | 110–160 | 56.7 (10.9) | 89.0 (22.0)a | 83.4 (11.0)a | 0.0002 |
| Zinc (μg/L) | 670–1240 | 738.6 (150.0) | 753.1 (131.9) | 812.0 (112.4) | NS |
| Urea nitrogen (mg/dL) | 4–15 | 8.8 (3.7) | 9.8 (2.9) | 9.7 (2.7) | NS |
| Creatinine (mg/dL) | 0.2–0.5 | 0.4 (0.1) | 0.3 (0.1) | 0.4 (0.1) | NS |
| Alkaline phosphatase (IU/L) | 150–380 | 199.9 (46.0) | 214.7 (45.7) | 209.0 (29.8) | NS |
| Total bilirubin (mg/dL) | 0.2–1.0 | 0.5 (0.2) | 0.5 (0.2) | 0.3 (0.1) | NS |
| Albumin (g/dL) | 3.2–4.7 | 4.5 (0.3) | 4.5 (0.2) | 4.5 (0.3) | NS |
| Immunoglobulin G (mg/dL) | 452–1207 | 573.3 (243.0) | 695.4 (240.6) | 700.5 (212.3) | NS |
| Total 25-hydroxyvitamin D (ng/mL) | 20–100 | 35.0 (11.9) | 36.8 (11.6) | 48.9 (14.9) | NS |
| Iron (μg/dL) | 20–124 | – | – | 66.5 (17.4) | na |
| Ferritin (ng/mL) | 7–140 | – | – | 44.1 (20.1) | na |
| Vitamin B12 (pg/mL) | 200–800 | – | – | 1620.4 (419.3) | na |
| Red blood cell folate (ng/mL) | 280–791 | – | – | 669.2 (51.8) | na |
Different than baseline value (Tukey post-test p < 0.01); NS, not significant (ANOVA p > 0.05); na, not applicable.
Table 7.
Red blood cell membrane fatty acids (mg%) as mean (SD) values.
| Fatty acid species | Control children, N = 54 | MSUD pre-trial formula, N = 78 | MSUD study formula, N = 15 | ANOVA p value |
|---|---|---|---|---|
| 18:2n – 6, linoleic | 9.72 (1.08) | 12.20 (1.69)a | 11.47 (0.80)a | <0.0001 |
| 20:4n – 6, arachadonic (AA) | 15.63 (1.31) | 13.73 (1.29)a | 12.26 (0.96)a,d | <0.0001 |
| 22:4n – 6, adrenic | 3.84 (0.62) | 4.38 (0.71)a | 2.50 (0.34)a,d | <0.0001 |
| 22:5n – 6, docosapentaenoic | 0.90 (0.24) | 0.79 (0.24)c | 0.38 (0.07)a,d | <0.0001 |
| 18:3n – 3, alpha-linolenic | 0.27 (0.19) | 0.20 (0.17) | 0.54 (0.06)a,d | <0.0001 |
| 20:5n – 3, eicosapentaenoic (EPA) | 0.34 (0.09) | 0.18 (0.14)a | 0.75 (0.12)a,d | <0.0001 |
| 22:5n – 3, docosapentaenoic | 1.92 (0.29) | 1.60 (0.62)b | 3.36 (0.27)a,d | <0.0001 |
| 22:6n – 3, docosahexaenoic (DHA) | 3.73 (1.14) | 1.78 (0.74)a | 2.38 (0.46)a,e | <0.0001 |
| Mean DHA/alpha-linolenic ratio | 14.0 | 8.9 | 4.4 | – |
| Mean DHA/EPA ratio | 11.0 | 9.9 | 3.2 | – |
| Total saturates | 38.47 (1.27) | 38.82 (1.64) | 39.10 (0.53) | NS |
| Total n – 6 fatty acids | 32.96 (1.68) | 35.00 (2.07)a | 29.33 (0.84)a,d | <0.0001 |
| Total n – 3 fatty acids | 6.31 (1.26) | 3.82 (1.37)a | 7.06 (0.51)d | <0.0001 |
Different than control children, Tukey p value <0.001.
Tukey p value <0.0.
Tukey p value <0.05.
Different than MSUD pre-trial, Tukey p value <0.001.
Tukey p value <0.05; NS, not significant (ANOVA p > 0.05).
Discussion
Before 1989, medical care for Mennonite children with MSUD was fragmented and expensive [41]. Nearly half of these children died of brain herniation and many who survived were permanently disabled [2]. The Clinic for Special Children, built in 1989, has since become a medical home to 79 MSUD patients [5,6,42]. Early work at the Clinic was focused on integrating metabolic management into general pediatric practice [2,43]. This led to affordable on-site amino acid testing, the development of home sick-day protocols, and on-demand MSUD parenteral solution for children who failed outpatient therapy [2,3,37,41]. These practical measures reduced suffering and saved lives [2,37,41,43].
Over a 20-year period, observing MSUD at close range, we learned how enzyme deficiency, diet, and the metabolic responses to illness interact to cause both acute and chronic brain disease [2,3,37]. These insights shaped our approach to management and drove the design of the study formula, which proved highly effective. Over a 3-year study period, we observed normal growth and development, better metabolic control (Table 5), and fewer hospitalizations (Table 3). These results reveal fascinating details about the physiology of MSUD and provide a framework for preventing its neurological consequences.
Protein turnover and nutritional physiology
In classical MSUD, changes of plasma leucine trace changes of whole body protein turnover, which can be quantified if one assumes the human body consists of 12.5% protein [40], body protein is 10% leucine (http://www.informagen.com/SA/), and free leucine (molecular weight 131 mg/mmol) is evenly distributed in total body water [44–46]. During illness, plasma leucine increases in proportion to the rate of protein catabolism [1], while its rate of decline measures the efficacy of anabolic therapy. Fig. 6A tracks plasma leucine in a 3 kg infant (total body water 2 L) as it decreases from 5000 to 50 μM over the first 8 days of therapy; this represents a net protein synthetic rate of 0.54 g/kg day.
In growing children, leucine tolerance measures insensible losses plus protein accretion, which is strongly linked to energy demand (Fig. 4). There is remarkable agreement between predicted and actual leucine tolerance (Table 4). For example, between 6 and 8 months of age (approximate weight 8 kg), the average somatic growth rate is 1.8 g/kg/day. This represents 220 mg/kg of net protein synthesis and about 22 mg/kg of leucine accretion. An additional 17–20 mg/kg day of leucine is lost through urine, stool, and sloughed skin [35]. Thus, predicted leucine tolerance (42 mg/kg day) almost perfectly matches actual tolerance (44 mg/kg day, range 37–51 mg/kg day; Table 4). Total protein turnover (combined rates of synthesis and degradation) is highest in growing infants [47], and this age group responds best to emergency anabolic therapy. In hospitalized newborns receiving combined enteral and parenteral feeding, plasma leucine could decrease by more than 1600 μmol/L day, reflecting net protein synthetic rates as high as 1.6 g/kg day.
Although leucine tolerance is a relatively stable function of growth rate (Fig. 4), it changes suddenly during catabolic illness when BCAAs released from muscle protein catabolism accumulate in tissues and plasma. Such episodes are typically managed at home with sick-day diet and sublingual odansetron unless vomiting supervenes. Following a metabolic crisis, leucine tolerance can transiently increase to more than 100 mg/kg day, which extrapolates to net protein synthesis of 1 g/kg day and a somatic growth of at least 8 g/kg day. This healing phase restores tissue protein mobilized during illness. Failure to keep pace can lead quickly to BCAA deficiencies.
Leucine, alpha-ketoisocaproic acid, and brain nutrition
With careful parent education, clinical monitoring, and aggressive treatment of common ailments, severe metabolic crises are infrequent (Table 3). Such crises, when they occur, are fully reversible, and with improved understanding of fluid and electrolyte management [1,48], lethal brain herniation has become a rare event [49]. However, unstable aKIC levels and amino acid concentration ratios are common (Figs. 6 and 8) and repeatedly threaten the brain [4]. Normally, tightly regulated amino acid oxidation rates in liver maintain relatively fixed plasma concentration ratios in the face of continually changing dietary intake, repeated cycles of feeding and fasting, and illness [34,47]. Movement of each amino acid into the brain depends on this constancy [38,50–56].
Fig. 8.
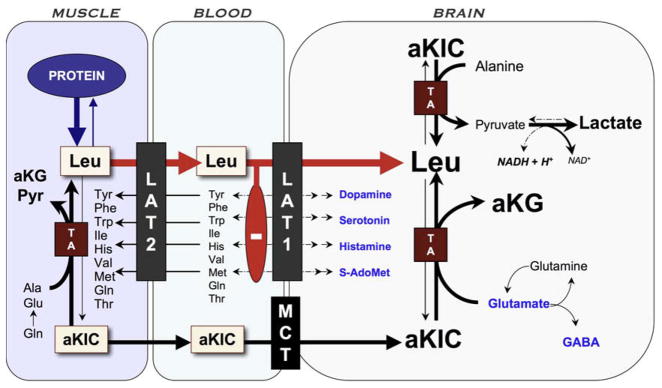
Pathophysiology of brain disease in MSUD. Episodic elevations of BCAAs occur when muscle degrades protein in response to infection or other physiologic stress and releases BCAAs and their ketoacid derivatives. High aKIC in muscle can reverse flow through cytosolic transaminases and deplete tissue of alanine and other amino acids. As leucine (Leu) exits tissue via the large amino acid transporter type 2 (LAT2), it drives import of other amino acids (heteroexchange). This process increases the relative concentration of leucine to other amino acids in plasma. At the blood–brain barrier, leucine, which has a low Km for LAT1, saturates the transporter and blocks uptake of its competitors, including precursors for neurotransmitters (dopamine, norepinephrine, serotonin, and histamine) and S-adenosylmethionine (S-AdoMet), the brain’s major methyl donor. Alpha-ketoisocaproic acid (aKIC) enters the brain via the monocarboxylate transporter (MCT) and reverses flux through cerebral transaminases (TA). This depletes brain glutamate, GABA, and glutamine while increasing production of leucine and alpha-ketoglutarate (aKG). Glutamate and GABA are the most abundant excitatory and inhibitory neurotransmitters, respectively, in the human brain. MSUD encephalopathy may also block oxidative phosphorylation through an as yet unknown mechanism; the increased NADH/NAD ratio could explain high cerebral lactate levels observed in both mice and humans during metabolic crisis.
Severe deficiency of just one LAT1 substrate relative to its competitors can have devastating consequences [57]. In 1997, we evaluated an MSUD patient from the Netherlands who presented to us at 5 months of age with stagnant brain growth, hypomyelination, desquamating skin lesions, and normocytic anemia severe enough to require transfusion. Amino acid profiles revealed chronic valine deficiency. Aggressive valine supplementation quickly restored her appetite, skin integrity, and red cell count. Her head circumference accelerated from 0.48 to 0.80 cm/week and her brain myelinated within 6 months (Fig. 7). However, cerebral catch-up growth was incomplete, and she is left with residual inattention and hyperactivity treated with stimulant medication. These problems may reflect irreversible structural defects of the brain due to 5 months of valine deprivation.
Fig. 7.

A 5 month-old infant from the Netherlands presented with growth failure, microcephaly, skin desquamation, and normocytic anemia. Plasma valine levels between 30 and 90 μM over preceding months predicted low valine uptake into the nervous system. Aggressive valine supplementation to maintain plasma levels at least twice the leucine concentration were associated with a large calculated increase of tissue valine uptake (A), skin healing, resolution of anemia, and a surge in brain growth and myelination (B).
Although this case may represent an extreme, it underscores the importance of ensuring the brain’s essential amino acid supply over long time intervals, and is a reminder that deficiencies of BCAAs are at least as dangerous as excesses [56]. Our experience reviewing cases from India, South America, the Middle East, and the United States suggests that lesser degrees of cerebral valine deficiency still may be a root cause of long-term neurological impairment in some patients, and our longitudinal data also indicate that milder, more long-standing cerebral deficiencies of other amino acids may be common among MSUD patients (Fig. 1). At least three interacting phenomena account for these observations:
BCKDH deficiency not only prevents oxidation of BCAAs but also disrupts the concentration relationships among them [34]. The regulated action of BCKDH normally maintains molar ratios of isoleucine:leucine and valine:leucine (μM:μM) at 0.5 and 2, respectively (Table 5). When enzyme activity is absent, unstable molar ratios in plasma result in highly variable cerebral uptake (Fig. 1 and Table 5) [34]. Different metabolic fates of alpha-ketoacids also affect amino acid homeostasis. A portion of excess aKIC is transaminated back to leucine [7] (Fig. 8), which amplifies tissue production of leucine relative to isoleucine and valine [58]. When the valine:leucine molar ratio is less than 2, leucine (LAT1 Km = 29 μM) outcompetes valine (Km = 210 μM) at the blood–brain barrier. Valine supplementation sufficient to keep this ratio above 2 ensures normal valine uptake by the nervous system (Tables 4 and 5). Isoleucine, with a Km for LAT1 of 56 μM, is less vulnerable to transport competition [5].
The inhibitory action of leucine on blood-to-brain transport is exacerbated by its reciprocal plasma relationship to a number of its competitors (Table 1). This led Halvor Christensen to investigate where amino acids go when they are depleted from plasma in conditions such as phenylketonuria and MSUD [59]. He showed that when leucine and phenylalanine are elevated, several amino acids move into muscle (and perhaps liver), increasing their transcellular concentration gradient [59,60]. This can be explained by heteroexchange [61] – or trans-stimulation [60] – whereby leucine export from muscle is stoichiometrically balanced by inward movement of other LAT1 substrates. At the blood–brain barrier, leucine that enters the brain may not only outcompete other substrates for saturable import, but also drive their efflux from the brain (Fig. 8) [51,59,61]. Christensen insightfully called this a disturbance of homeorhysis – the biological regulation of flow – to distinguish it from changes of concentration.
As depicted in Fig. 8, reverse transamination of aKIC depletes tissues and plasma of certain amino acids [8,12,14]. Severe deficiencies of cerebral glutamate, GABA, glutamine, and aspartate have been observed in brains of Dbt−/−MSUD mice [14], calves with naturally occurring BCKDH deficiency [13], and post-mortem brain of an infant with MSUD (Fig. 2) [15]. This phenomenon might underlie the tight inverse correlations of leucine to both alanine and glutamine that we observe in clinical practice (Table 1, Figs. 2B and 6), and render these amino acids “conditionally” essential when tissue aKIC is elevated.
There is now good evidence that these disturbances occur in vivo and do in fact alter amino acid and neurotransmitter pools in the brain [8,13–15]. But do they have functional consequences? Our data cannot answer this question directly, but there clearly are long-term neuropsychiatric effects of MSUD related to metabolic control [62]. These were revealed in a group of patients evaluated for liver transplantation between 2003 and 2008 [34]. Scores on pre-transplant screenings of intelligence, using either the Routing Test of the Stanford-Binet Intelligence Scales or the Wechsler Abbreviated Scale of Intelligence (normal scores 100 ± 15), were 89 ± 11 (range 76–103) for Mennonites (N = 6) and 81 ± 15 (range 47–103) for non-Mennonites (N = 26) under relatively good metabolic control (i.e., plasma leucine on test day 302 ± 256 μM; normal 119 ± 38 μM). Scores on the Vineland Adaptive Behavior Scale or the Adaptive Behavior Assessment System were 99 ± 17 (range 73–120) and 83 ± 21 (range 33–117) for Mennonites and non- Mennonites, respectively.
A review of mental health records from 56 patients showed that 29% between ages 6 and 12 years required psychostimulants for inattention or hyperactivity, and 37% over age 12 years had at one time received medication to treat generalized anxiety, panic, or depression [3,34]. A recent study examined the social consequences of mental illness for 22 adults with MSUD [63]. Educational and professional achievement was poor. Few held a job, lived independently, or were married. Thus, although dietary therapy can support normal intellectual development [48,58,62], at least half of prospectively managed patients live with serious mental or psychiatric disability. In our experience, these outcomes are not predicted by the number or severity of acute encephalopathic crises, but by the quality of longitudinal metabolic control [62].
Our approach to treating MSUD is based on the idea that chronic mental health problems are rooted in cerebral amino acid deprivation early in life [4,15,64–71] and ongoing disturbances of brain protein and neurotransmitter metabolism caused by unbalanced amino acid and ketoacid delivery to the nervous system (Fig. 8) [1,3,7,13– 15,34]. The amino acid component of the study formula was designed to buffer the circulating amino acid pool against these effects in the face of continually changing levels of leucine and aKIC (Figs. 2 and 5). Our data indicate that to do this successfully requires 2.3- to 4.5-times the total intake of LAT1 amino acids consumed by most breastfed infants (Table 2), and additional BCAA-free protein to counteract leucine elevations on sick-days. Simple spreadsheet calculations can estimate the overall effects this strategy has on brain nutrition (Appendix), whereas plasma concentration ratios (e.g., Trp/[Leu + Iso]) are practical shortcuts to guide clinical practice (Fig. 5).
Other nutrients, such as zinc, selenium, and DHA have less certain affects on development, but are clearly important for normal brain physiology [20,24,25]. Whatever their precise roles in the developing brain, deficiencies are not likely to be benign [17,21,26,28,31,72,73]. Our data do not reveal why selenium levels were low or what interferes with the conversion of docosapentaenoic acid to DHA. However, we provide evidence that these problems can be partially addressed through formula design (Tables 6 and 7).
Hospitalization rates, longitudinal control, and medical economics
Before 1989, all Mennonites diagnosed with MSUD were sick at the time of presentation and transitioned in regional pediatric hospitals where the average hospital stay was 12 weeks (range 9– 119 days) [53,69]. Hospitalizations typically cost $50,000 or more [2] and would cost 10- to 30-times as much in today’s tertiary U.S. medical centers (i.e., between $8000 and $20,000 per day). In the present cohort, only 3 of 28 (11%) hospitalizations were for neonatal illness. Between 1989 and present, we diagnosed 64 Mennonites newborns with MSUD. Half (N = 32) of them were targeted because of a positive family history (67%) or carrier testing (33%). These children were diagnosed between 12 and 24 h of life by on-site amino acid analysis or, more recently, cord blood mutation detection using real-time PCR. All of them transitioned safely at home.
Our ability to manage catabolic illnesses in the outpatient setting has an even larger clinical and economic impact [2,33]. In the 1980s, a patient with classical MSUD was hospitalized an average of once yearly for 7 days [53]. This same hospitalization rate, applied to the 64 Mennonites diagnosed with MSUD since 1989, would cost the Old Order Mennonite community at least 3.5 million dollars per year, more than twice the annual cost of operating the Clinic for Special Children. Between 1989 and 2003, we reduced the cost of inpatient care by 95%. During the 3-year trial period, hospitalizations decreased from 0.35 to 0.11 per patient per year, reducing community medical expenditures by an additional 50–70%.
Frequent amino acid monitoring with rapid turnaround time and access to informed general pediatric care during illnesses were the keys to keeping children out of the hospital. For infants, we measured amino acids at least once weekly, and as often as necessary to manage illnesses at home. For hospitalized patients, amino acids were typically checked twice daily and results were used to fine-tune intakes of calories, BCAA-free amino acids, isoleucine, and valine. Intensive monitoring improved metabolic control (Table 5). On study formula, plasma leucine (152 ± 138 μM) was 40% lower than baseline (282 ± 277 μM) and low compared to other published cohorts (means ranging from 177 to 422 μM) [62,74,75]. Although better control probably reflects closer surveillance, inhibition of intestinal leucine uptake by competing dietary amino acids might also play a role [71]. Whatever mechanisms account for lower longitudinal leucine values, they improve brain nutrition and appear to correlate with measures of long-term intellectual function [57].
Conclusions
This study illustrates the complexity of metabolic formula design. It is an iterative process that requires continual reappraisal in light of clinical and experimental data. Our calculations suggest that study formula could be improved by adding more histidine and glutamine (Table 5), as well as adjusting the proportional content of iron, zinc, and selenium (Table 6). The fatty acid data indicate that DHA itself, rather than just its precursors, should be part of the diet (Table 7). Based on these observations, we modified Complex Infant and will subject it to further study. In addition, there was clear evidence of isoleucine over-supplementation (Table 5 and Fig. 1) and this has changed how we approach dosing. Titrating isoleucine intake to achieve a molar ratio to leucine of about 0.5 should allow sufficient brain uptake while decreasing inhibitory pressure on the transport of other competing amino acids (Table 5 and Fig. 8).
The competitive transport concept is relevant to the pathophysiology of other inborn errors, including phenylketonuria [61,76,77], tyrosinemia, hypermethioninemia, and 5,10-methylenetetrahydrofolate reductase deficiency [38]. In all of these conditions, a pathological pattern of amino acids alters their flow into the nervous system, and brain nutrition can only be determined using the complete amino acid profile. These conditions also render children highly dependent on synthetic medical foods. Such foods must provide a broad nutritional safety net that protects against deficiency of the full complement of vitamins, minerals, and other essential nutrients (Tables 6 and 7). These ideas were built into the study formula in a way that at once improved and simplified care. However, formula design does not replace the need for frequent clinical monitoring, informed local medical care, and ongoing dietary adjustments that match nutritional intake to the metabolic demands of growth and illness (Table 8) [2,37,48].
Table 8.
MSUD treatment variables and goals.
Neonatal transition
|
Longitudinal metabolic control
|
Management of episodic catabolic illnesses
|
Acute inpatient care
|
Goals of long-term therapy
|
In newborns, PO and/or nasogastric feeding with ‘sick-day’ formula is often sufficient; TPN may not be necessary.
See Table 4.
LAT 1 substrates: Leu, Iso, Val, Tyr, Trp, Met, Phe, His, Thr, Gln (see Table 5).
Tyrosine is relatively insoluble in water; enteral supplementation may be indicated for some hospitalized patients.
Serum sodium should not decrease more than 3 mEq/L per day.
See Ref. [3] for details.
Acknowledgments
The authors acknowledge the expertise and cooperation of Lancaster General Hospital’s pediatric nurses, inpatient pharmacists, and radiology technicians, without whom we could not provide dependable local emergency care. Dr. Richard Kelley, M.D., Ph.D., had an important influence in the development of MSUD treatment protocols in the early years of the Clinic. Through advice and personal communications, Drs. Halvor Christensen, Quentin Smith, and Marc Yudkoff made important contributions to the concepts developed in the paper. Finally, the authors thank the children and their families who live with MSUD. They are partners in our work and continue to ask the important questions [78]. Members of the Old Order Mennonite and Amish communities helped fund this work through annual quilt auctions and other charitable giving.
Appendix
Footnotes
Disclosure statement
The medical food used in this study was manufactured by Applied Nutrition, Incorporated. Applied Nutrition supplied the product to families free of charge for the study period and paid for all laboratory testing used to evaluate product performance and safety. Bridget Wardley is an employee of Applied Nutrition.
References
- 1.Strauss KA, Morton DH. Branched-chain ketoacyl dehydrogenase deficiency: maple syrup disease. Curr Treat Options Neurol. 2003;5:329–341. doi: 10.1007/s11940-003-0039-3. [DOI] [PubMed] [Google Scholar]
- 2.Morton DH, Morton CS, Strauss KA, Robinson DL, Puffenberger EG, Hendrickson C, Kelley RI. Pediatric medicine and the genetic disorders of the Amish and Mennonite people of Pennsylvania. Am J Med Genet C Semin Med Genet. 2003;121:5–17. doi: 10.1002/ajmg.c.20002. [DOI] [PubMed] [Google Scholar]
- 3.Strauss KA, Puffenberger EG, Morton DH. GeneReviews. University of Washington; Seattle: 2006. Maple Syrup Urine Disease. [PubMed] [Google Scholar]
- 4.Kamei A, Takashima S, Chan F, Becker LE. Abnormal dendritic development in maple syrup urine disease. Pediatr Neurol. 1992;8:145–147. doi: 10.1016/0887-8994(92)90038-z. [DOI] [PubMed] [Google Scholar]
- 5.Smith QR, Stoll JS. Blood–brain barrier amino acid transport. In: Pardridge WM, editor. Introduction to the Blood–Brain Barrier. Cambridge University Press; Cambridge: 1998. pp. 188–197. [Google Scholar]
- 6.Smith QR, Takasato Y. Kinetics of amino acid transport at the blood–brain barrier studied using an in situ brain perfusion technique. Ann NY Acad Sci. 1986;481:186–201. doi: 10.1111/j.1749-6632.1986.tb27150.x. [DOI] [PubMed] [Google Scholar]
- 7.Yudkoff M, Daikhin Y, Nissim I, Horyn O, Luhovyy B, Lazarow A, Nissim I. Brain amino acid requirements and toxicity: the example of leucine. J Nutr. 2005;135:1531S–1538S. doi: 10.1093/jn/135.6.1531S. [DOI] [PubMed] [Google Scholar]
- 8.Yudkoff M, Daikhin Y, Grunstein L, Nissim I, Stern J, Pleasure D, Nissim I. Astrocyte leucine metabolism: significance of branched-chain amino acid transamination. J Neurochem. 1996;66:378–385. doi: 10.1046/j.1471-4159.1996.66010378.x. [DOI] [PubMed] [Google Scholar]
- 9.Hutson SM, Cree TC, Harper AE. Regulation of leucine and alpha-ketoisocaproate metabolism in skeletal muscle. J Biol Chem. 1978;253:8126–8133. [PubMed] [Google Scholar]
- 10.Holecek M. Relation between glutamine, branched-chain amino acids, and protein metabolism. Nutrition. 2002;18:130–133. doi: 10.1016/s0899-9007(01)00767-5. [DOI] [PubMed] [Google Scholar]
- 11.Hutson SM, Lieth E, LaNoue KF. Function of leucine in excitatory neurotransmitter metabolism in the central nervous system. J Nutr. 2001;131:846S–850S. doi: 10.1093/jn/131.3.846S. [DOI] [PubMed] [Google Scholar]
- 12.Yudkoff M, Daikhin Y, Nissim I, Pleasure D, Stern J, Nissim I. Inhibition of astrocyte glutamine production by alpha-ketoisocaproic acid. J Neurochem. 1994;63:1508–1515. doi: 10.1046/j.1471-4159.1994.63041508.x. [DOI] [PubMed] [Google Scholar]
- 13.Dodd PR, Williams SH, Gundlach AL, Harper PA, Healy PJ, Dennis JA, Johnston GA. Glutamate and gamma-aminobutyric acid neurotransmitter systems in the acute phase of maple syrup urine disease and citrullinemia encephalopathies in newborn calves. J Neurochem. 1992;59:582–590. doi: 10.1111/j.1471-4159.1992.tb09409.x. [DOI] [PubMed] [Google Scholar]
- 14.Zinnanti WJ, Lazovic J, Griffin K, Skvorak KJ, Paul HS, Homanics GE, Bewley MC, Cheng KC, Lanoue KF, Flanagan JM. Dual mechanism of brain injury and novel treatment strategy in maple syrup urine disease. Brain. 2009;132:903–918. doi: 10.1093/brain/awp024. [DOI] [PMC free article] [PubMed] [Google Scholar]
- 15.Prensky AL, Moser HW. Brain lipids, proteolipids, and free amino acids in maple syrup urine disease. J Neurochem. 1966;13:863–874. doi: 10.1111/j.1471-4159.1966.tb05882.x. [DOI] [PubMed] [Google Scholar]
- 16.Bryan J, Osendarp S, Hughes D, Calvaresi E, Baghurst K, van Klinken JW. Nutrients for cognitive development in school-aged children. Nutr Rev. 2004;62:295–306. doi: 10.1111/j.1753-4887.2004.tb00055.x. [DOI] [PubMed] [Google Scholar]
- 17.Ramakrishnan U, Imhoff-Kunsch B, DiGirolamo AM. Role of docosahexaenoic acid in maternal and child mental health. Am J Clin Nutr. 2009;89:958S–962S. doi: 10.3945/ajcn.2008.26692F. [DOI] [PMC free article] [PubMed] [Google Scholar]
- 18.Richardson AJ, Montgomery P. The Oxford-Durham study: a randomized, controlled trial of dietary supplementation with fatty acids in children with developmental coordination disorder. Pediatrics. 2005;115:1360–1366. doi: 10.1542/peds.2004-2164. [DOI] [PubMed] [Google Scholar]
- 19.Young GS, Maharaj NJ, Conquer JA. Blood phospholipid fatty acid analysis of adults with and without attention deficit/hyperactivity disorder. Lipids. 2004;39:117–123. doi: 10.1007/s11745-004-1209-3. [DOI] [PubMed] [Google Scholar]
- 20.Singh M. Essential fatty acids, DHA and human brain Indian. J Pediatr. 2005;72:239–242. [PubMed] [Google Scholar]
- 21.Sinn N. Nutritional and dietary influences on attention deficit hyperactivity disorder. Nutr Rev. 2008;66:558–568. doi: 10.1111/j.1753-4887.2008.00107.x. [DOI] [PubMed] [Google Scholar]
- 22.Moser AB, Jones DS, Raymond GV, Moser HW. Plasma and red blood cell fatty acids in peroxisomal disorders. Neurochem Res. 1999;24:187–197. doi: 10.1023/a:1022549618333. [DOI] [PubMed] [Google Scholar]
- 23.Ross BM, Seguin J, Sieswerda LE. Omega-3 fatty acids as treatments for mental illness: which disorder and which fatty acid? Lipids Health Dis. 2007;6 :21. doi: 10.1186/1476-511X-6-21. [DOI] [PMC free article] [PubMed] [Google Scholar]
- 24.Bitanihirwe BK, Cunningham MG. Zinc: the brain’s dark horse. Synapse. 2009;63:1029–1049. doi: 10.1002/syn.20683. [DOI] [PubMed] [Google Scholar]
- 25.Georgieff MK. Nutrition and the developing brain: nutrient priorities and measurement. Am J Clin Nutr. 2007;85:614S–620S. doi: 10.1093/ajcn/85.2.614S. [DOI] [PubMed] [Google Scholar]
- 26.Chen J, Berry MJ. Selenium and selenoproteins in the brain and brain diseases. J Neurochem. 2003;86:1–12. doi: 10.1046/j.1471-4159.2003.01854.x. [DOI] [PubMed] [Google Scholar]
- 27.Gassio R, Artuch R, Vilaseca MA, Fuste E, Colome R, Campistol J. Cognitive functions and the antioxidant system in phenylketonuric patients. Neuropsychology. 2008;22:426–431. doi: 10.1037/0894-4105.22.4.426. [DOI] [PubMed] [Google Scholar]
- 28.Castano A, Ayala A, Rodriguez-Gomez JA, de la Cruz CP, Revilla E, Cano J, Machado A. Increase in dopamine turnover and tyrosine hydroxylase enzyme in hippocampus of rats fed on low selenium diet. J Neurosci Res. 1995;42:684–691. doi: 10.1002/jnr.490420511. [DOI] [PubMed] [Google Scholar]
- 29.Castano A, Ayala A, Rodriguez-Gomez JA, Herrera AJ, Cano J, Machado A. Low selenium diet increases the dopamine turnover in prefrontal cortex of the rat. Neurochem Int. 1997;30:549–555. doi: 10.1016/s0197-0186(96)00123-4. [DOI] [PubMed] [Google Scholar]
- 30.Beard J. Nutrient status and central nervous system function. In: Ziegler EE, Filer LJ, editors. Present Knowledge in Nutrition. ILSI Press; Washington, DC: 1996. pp. 612–622. [Google Scholar]
- 31.Schweizer U, Brauer AU, Kohrle J, Nitsch R, Savaskan NE. Selenium and brain function: a poorly recognized liaison. Brain Res Brain Res Rev. 2004;45:164–178. doi: 10.1016/j.brainresrev.2004.03.004. [DOI] [PubMed] [Google Scholar]
- 32.Darling G, Mathias P, O’Regan M, Naughten E. Serum selenium levels in individuals on PKU diets. J Inherit Metab Dis. 1992;15:769–773. doi: 10.1007/BF01800019. [DOI] [PubMed] [Google Scholar]
- 33.Lombeck I, Kasperek K, Bachmann D, Feinendegen LE, Bremer HJ. Selenium requirements in patients with inborn errors of amino acid metabolism and selenium deficiency. Eur J Pediatr. 1980;134:65–68. doi: 10.1007/BF00442405. [DOI] [PubMed] [Google Scholar]
- 34.Strauss KA, Mazariegos GV, Sindhi R, Squires R, Finegold DN, Vockley G, Robinson DL, Hendrickson C, Virji M, Cropcho L, Puffenberger EG, McGhee W, Seward LM, Morton DH. Elective liver transplantation for the treatment of classical maple syrup urine disease. Am J Transplant. 2006;6:557–564. doi: 10.1111/j.1600-6143.2005.01209.x. [DOI] [PubMed] [Google Scholar]
- 35.Schadewaldt P, Wendel U. Metabolism of branched-chain amino acids in maple syrup urine disease. Eur J Pediatr. 1997;156(Suppl 1):S62–S66. doi: 10.1007/pl00014274. [DOI] [PubMed] [Google Scholar]
- 36.Schadewaldt P, Hammen HW, Ott AC, Wendel U. Renal clearance of branched-chain L-amino and 2-oxo acids in maple syrup urine disease. J Inherit Metab Dis. 1999;22:706–722. doi: 10.1023/a:1005540016376. [DOI] [PubMed] [Google Scholar]
- 37.Morton DH, Strauss KA, Robinson DL, Puffenberger EG, Kelley RI. Diagnosis and treatment of maple syrup disease: a study of 36 patients. Pediatrics. 2002;109:999–1008. doi: 10.1542/peds.109.6.999. [DOI] [PubMed] [Google Scholar]
- 38.Strauss KA, Morton DH, Puffenberger EG, Hendrickson C, Robinson DL, Wagner C, Stabler SP, Allen RH, Chwatko G, Jakubowski H, Niculescu MD, Mudd SH. Prevention of brain disease from severe 5,10-methylenetetrahydrofolate reductase deficiency. Mol Genet Metab. 2007;91:165–175. doi: 10.1016/j.ymgme.2007.02.012. [DOI] [PubMed] [Google Scholar]
- 39.Killian DM, Chikhale PJ. Predominant functional activity of the large, neutral amino acid transporter (LAT1) isoform at the cerebrovasculature. Neurosci Lett. 2001;306:1–4. doi: 10.1016/s0304-3940(01)01810-9. [DOI] [PubMed] [Google Scholar]
- 40.Garrow JS, Fletcher K, Halliday D. Body composition in severe infantile malnutrition. J Clin Invest. 1965;44:417–425. doi: 10.1172/JCI105155. [DOI] [PMC free article] [PubMed] [Google Scholar]
- 41.Morton DH. Through my window – remarks at the 125th year celebration of Children’s Hospital of Boston. Pediatrics. 1994;94:785–791. [PubMed] [Google Scholar]
- 42.Kuhne A, Kaiser R, Schirmer M, Heider U, Muhlke S, Niere W, Overbeck T, Hohloch K, Trumper L, Sezer O, Brockmoller J. Genetic polymorphisms in the amino acid transporters LAT1 and LAT2 in relation to the pharmacokinetics and side effects of melphalan. Pharmacogenet Genomics. 2007;17:505–517. doi: 10.1097/FPC.0b013e3280ea77cd. [DOI] [PubMed] [Google Scholar]
- 43.Strauss KA, Puffenberger EG. Genetics, medicine, and the plain people. Annu Rev Genomics Hum Genet. 2009;10:513–536. doi: 10.1146/annurev-genom-082908-150040. [DOI] [PubMed] [Google Scholar]
- 44.Wagenmakers AJ. Tracers to investigate protein and amino acid metabolism in human subjects. Proc Nutr Soc. 1999;58:987–1000. doi: 10.1017/s0029665199001305. [DOI] [PubMed] [Google Scholar]
- 45.Vinnars E, Bergstom J, Furst P. Influence of the postoperative state on the intracellular free amino acids in human muscle tissue. Ann Surg. 1975;182:665–671. doi: 10.1097/00000658-197512000-00001. [DOI] [PMC free article] [PubMed] [Google Scholar]
- 46.Flynn MA, Hanna FM, Lutz RN. Estimation of body water compartments of preschool children. I. Normal children. Am J Clin Nutr. 1967;20:1125–1128. doi: 10.1093/ajcn/20.10.1125. [DOI] [PubMed] [Google Scholar]
- 47.Young VR. McCollum award lecture. Kinetics of human amino acid metabolism: nutritional implications and some lessons. Am J Clin Nutr. 1987;46:709–725. doi: 10.1093/ajcn/46.5.709. [DOI] [PubMed] [Google Scholar]
- 48.Strauss KA, Puffenberger EG, Morton DH. Maple Syrup Urine Disease. University of Washington; Seattle: 2006. [PubMed] [Google Scholar]
- 49.Riviello JJ, Jr, Rezvani I, DiGeorge AM, Foley CM. Cerebral edema causing death in children with maple syrup urine disease. J Pediatr. 1991;119:42–45. doi: 10.1016/s0022-3476(05)81036-4. [DOI] [PubMed] [Google Scholar]
- 50.Fernstrom JD. Can nutrient supplements modify brain function? Am J Clin Nutr. 2000;71:1669S–1675S. doi: 10.1093/ajcn/71.6.1669S. [DOI] [PubMed] [Google Scholar]
- 51.Gardiner RM. Transport of amino acids across the blood–brain barrier: implications for treatment of maternal phenylketonuria. J Inherit Metab Dis. 1990;13:627–633. doi: 10.1007/BF01799517. [DOI] [PubMed] [Google Scholar]
- 52.Huether G, Kaus R, Neuhoff V. Amino acid depletion in the blood and brain tissue of hyperphenylalaninemic rats is abolished by the administration of additional lysine: a contribution to the understanding of the metabolic defects in phenylketonuria. Biochem Med. 1985;33:334–341. doi: 10.1016/0006-2944(85)90008-0. [DOI] [PubMed] [Google Scholar]
- 53.Hutchison SN, Zarghami NS, Cusick PK, Longenecker JB, Haskell BE. The effect of valine deficiency on neutral amino acid patterns in plasma and brain of the rat. J Nutr. 1983;113:2164–2170. doi: 10.1093/jn/113.11.2164. [DOI] [PubMed] [Google Scholar]
- 54.Roach MK, Corbin J, Pennington W. Effect of undernutrition on amino acid compartimentation in the developing rat brain. J Neurochem. 1974;22:521–528. doi: 10.1111/j.1471-4159.1974.tb06888.x. [DOI] [PubMed] [Google Scholar]
- 55.Fernstrom JD. Branched-chain amino acids and brain function. J Nutr. 2005;135:1539S–1546S. doi: 10.1093/jn/135.6.1539S. [DOI] [PubMed] [Google Scholar]
- 56.Joshi MA, Jeoung NH, Obayashi M, Hattab EM, Brocken EG, Liechty EA, Kubek MJ, Vattem KM, Wek RC, Harris RA. Impaired growth and neurological abnormalities in branched-chain alpha-keto acid dehydrogenase kinase-deficient mice. Biochem J. 2006;400:153–162. doi: 10.1042/BJ20060869. [DOI] [PMC free article] [PubMed] [Google Scholar]
- 57.Hutson SM. The case for regulating indispensable amino acid metabolism: the branched-chain alpha-keto acid dehydrogenase kinase-knockout mouse. Biochem J. 2006;400:e1–e3. doi: 10.1042/BJ20061506. [DOI] [PMC free article] [PubMed] [Google Scholar]
- 58.Clow CL, Reade TM, Scriver CR. Outcome of early and long-term management of classical maple syrup urine disease. Pediatrics. 1981;68:856–862. [PubMed] [Google Scholar]
- 59.Christensen HN, Handlogten ME. Interaction between parallel transport systems examined with tryptophan and related amino acids. J Neural Transm Suppl. 1979:1–13. doi: 10.1007/978-3-7091-2243-3_1. [DOI] [PubMed] [Google Scholar]
- 60.Christensen HN. Hypothesis: where the depleted plasma amino acids go in phenylketonuria, and why. Perspect Biol Med. 1987;30:186–196. doi: 10.1353/pbm.1987.0034. [DOI] [PubMed] [Google Scholar]
- 61.Zielke HR, Zielke CL, Baab PJ, Collins RM. Large neutral amino acids auto exchange when infused by microdialysis into the rat brain: implication for maple syrup urine disease and phenylketonuria. Neurochem Int. 2002;40:347–354. doi: 10.1016/s0197-0186(01)00077-8. [DOI] [PubMed] [Google Scholar]
- 62.Hoffmann B, Helbling C, Schadewaldt P, Wendel U. Impact of longitudinal plasma leucine levels on the intellectual outcome in patients with classic MSUD. Pediatr Res. 2006;59:17–20. doi: 10.1203/01.pdr.0000190571.60385.34. [DOI] [PubMed] [Google Scholar]
- 63.Simon E, Schwarz M, Wendel U. Social outcome in adults with maple syrup urine disease (MSUD) J Inherit Metab Dis. 2007;30:264. doi: 10.1007/s10545-007-0475-4. [DOI] [PubMed] [Google Scholar]
- 64.Del Angel-Meza AR, Ramirez-Cortes L, Olvera-Cortes E, Perez-Vega MI, Gonzalez-Burgos I. A tryptophan-deficient corn-based diet induces plastic responses in cerebellar cortex cells of rat offspring. Int J Dev Neurosci. 2001;19:447–453. doi: 10.1016/s0736-5748(01)00004-1. [DOI] [PubMed] [Google Scholar]
- 65.Benitez-Bribiesca L, De la Rosa-Alvarez I, Mansilla-Olivares A. Dendritic spine pathology in infants with severe protein-calorie malnutrition. Pediatrics. 1999;104:e21. doi: 10.1542/peds.104.2.e21. [DOI] [PubMed] [Google Scholar]
- 66.Andrade JP, Castanheira-Vale AJ, Paz-Dias PG, Madeira MD, Paula-Barbosa MM. The dendritic trees of neurons from the hippocampal formation of protein-deprived adult rats. A quantitative Golgi study. Exp Brain Res. 1996;109:419–433. doi: 10.1007/BF00229626. [DOI] [PubMed] [Google Scholar]
- 67.Cordero ME, D’Acuna E, Benveniste S, Prado R, Nunez JA, Colombo M. Dendritic development in neocortex of infants with early postnatal life undernutrition. Pediatr Neurol. 1993;9:457–464. doi: 10.1016/0887-8994(93)90025-8. [DOI] [PubMed] [Google Scholar]
- 68.Udani PM. Protein energy malnutrition (PEM), brain and various facets of child development Indian. J Pediatr. 1992;59:165–186. doi: 10.1007/BF02759978. [DOI] [PubMed] [Google Scholar]
- 69.Diaz-Cintra S, Cintra L, Kemper T, Resnick O, Morgane PJ. The effects of protein deprivation on the nucleus raphe dorsalis: a morphometric Golgi study in rats of three age groups. Brain Res. 1981;221:243–255. doi: 10.1016/0006-8993(81)90775-7. [DOI] [PubMed] [Google Scholar]
- 70.Resnick O, Miller M, Forbes W, Hall R, Kemper T, Bronzino J, Morgane PJ. Developmental protein malnutrition: influences on the central nervous system of the rat. Neurosci Biobehav Rev. 1979;3:233–246. doi: 10.1016/0149-7634(79)90011-3. [DOI] [PubMed] [Google Scholar]
- 71.West CD, Kemper TL. The effect of a low protein diet on the anatomical development of the rat brain. Brain Res. 1976;107:221–237. doi: 10.1016/0006-8993(76)90223-7. [DOI] [PubMed] [Google Scholar]
- 72.Moskovitz J. Prolonged selenium-deficient diet in MsrA knockout mice causes enhanced oxidative modification to proteins and affects the levels of antioxidant enzymes in a tissue-specific manner. Free Radic Res. 2007;41:162–171. doi: 10.1080/10715760600978823. [DOI] [PubMed] [Google Scholar]
- 73.Castano A, Cano J, Machado A. Low selenium diet affects monoamine turnover differentially in substantia nigra and striatum. J Neurochem. 1993;61:1302–1307. doi: 10.1111/j.1471-4159.1993.tb13622.x. [DOI] [PubMed] [Google Scholar]
- 74.Couce Pico ML, Castineiras Ramos DE, Boveda Fontan MD, Iglesias Rodriguez AJ, Cocho de Juan JA, Fraga Bermudez JM. Advances in the diagnosis and treatment of maple syrup urine disease: experience in Galicia (Spain) An Pediatr (Barc) 2007;67:337–343. doi: 10.1016/s1695-4033(07)70651-3. [DOI] [PubMed] [Google Scholar]
- 75.Simon E, Wendel U, Schadewaldt P. Maple syrup urine disease-treatment and outcome in patients of Turkish descent in Germany Turk. J Pediatr. 2005;47:8–13. [PubMed] [Google Scholar]
- 76.Matalon R, Surendran S, Matalon KM, Tyring S, Quast M, Jinga W, Ezell E, Szucs S. Future role of large neutral amino acids in transport of phenylalanine into the brain. Pediatrics. 2003;112:1570–1574. [PubMed] [Google Scholar]
- 77.Pietz J, Kreis R, Rupp A, Mayatepek E, Rating D, Boesch C, Bremer HJ. Large neutral amino acids block phenylalanine transport into brain tissue in patients with phenylketonuria. J Clin Invest. 1999;103:1169–1178. doi: 10.1172/JCI5017. [DOI] [PMC free article] [PubMed] [Google Scholar]
- 78.What is Wrong with Our Baby? Grace Press Inc; Ephrata, PA: 1995. [Google Scholar]