Abstract
Pancreatic cancer patients frequently show hyperglycemia, but it is uncertain whether hyperglycemia stimulates pancreatic cancer cells. We have investigated whether excess glucose induces hypoxia-inducible factor-1α (HIF-1α) and stimulates glucose metabolism and cell migration in pancreatic cancer cells. We studied wild-type (wt) MiaPaCa2 pancreatic cancer cells and a MiaPaCa2 subline (namely si-MiaPaCa2) that had HIF-1α-specific small interfering RNA. Wt-MiaPaCa2 cells are known to be HIF-1α-positive in hypoxia and HIF-1α-negative in normoxia, whereas si-MiaPaCa2 cells are devoid of HIF-1α in both normoxia and hypoxia. We incubated these cells with different amounts of glucose and determined HIF-1α mRNA and protein by real-time polymerase chain reaction and western blotting. We determined glucose consumption, lactate production and intracellular hexokinase-II and ATP to assess glucose metabolisms and determined pyruvate dehydrogenase kinase-1, reactive oxygen species and fumarate to assess mitochondrial activities. Further, we studied cell migration using a Boyden chamber. Excess glucose (16.7−22.2mM) increased HIF-1α in hypoxic wt-MiaPaCa2 cells. HIF-1α expression increased ATP contents and inhibited mitochondrial activities. Extracellular glucose and hypoxia stimulated glucose metabolisms independent of HIF-1α. Excess glucose stimulated the migration of wt- and si-MiaPaCa2 cells in both normoxia and hypoxia. Thus, glucose stimulated cell migration independent of HIF-1α. Nevertheless, hypoxic wt-MiaPaCa2 cells showed greater migrating ability than their si-MiaPaCa2 counterparts. We conclude that (1) excess glucose increases HIF-1α and ATP in hypoxic wt-MiaPaCa2 cells, (2) extracellular glucose and hypoxia regulate glucose metabolisms independent of HIF-1α and (3) glucose stimulates cell migration by mechanisms that are both dependent on HIF-1α and independent of it.
Keywords: pancreatic cancer, hypoxia-inducible factor-1, glucose, glycolysis, cell migration, hexokinase-II, reactive oxygen species
Introduction
Hypoxia-inducible factor-1 (HIF-1) is a heterodimeric (α/β) transcription factor.1 In normoxia, HIF-1α is hydroxylated at two prolyl residues and degraded in proteosomes.2 Thus, mammalian cells normally contain HIF-1β but not HIF-1α. When cells are subjected to hypoxia, HIF-1α is saved and forms HIF-1 together with HIF-1β. HIF-1 upregulates its target genes whose products include glucose transporters, glycolytic enzymes (e.g., hexokinase),3 and the enzymes that inhibit oxidative phosphorylation (OXPHOS) in the mitochondria (e.g., pyruvate dehydrogenase kinase-1, PDK-1).4,5 Thus, when normal cells are subjected to hypoxia, they switch their primary pathway of energy production from OXPHOS to glycolysis. In addition, the OXPHOS-to-glycolysis switch is also seen in cancer cells. The phenomenon in cancer cells was first described by Otto Warburg and is known as the Warburg effect.6 Mechanisms underlying the Warburg effect are unclear and may involve cancer-induced HIF-1α.7
Intra-tumoral hypoxia is common in malignant tumors.8 When cancer cells are exposed to hypoxia, HIF-1α stability is increased, so that HIF-1α is accumulated and HIF-1 target genes are upregulated.9 Two intracellular signaling cascades regulate HIF-1α expression, one involving phosphatidylinositol 3-kinase (PI-3K) and the other involving mitogen-activated protein kinase.10 In cancer cells, these cascades may be deregulated so that HIF-1α production is increased. When HIF-1α-production rate surpasses HIF-1α-degradation rate, HIF-1α is accumulated.10
Reactive oxygen species (ROS) are primarily produced in the mitochondria during OXPHOS and are also produced in the cytosol.11 Normal amounts of ROS are a physiological regulator, but excessive ROS subject cells to stresses. Cancer cells usually require increased amounts of ROS for their biology.12 However, the amounts of ROS may be regulated by cancer-induced HIF-1α.5
Increased extracellular glucose in diabetes regulates HIF-1α expression in benign cells.13,14 Pancreatic cancer is frequently associated with diabetes,15 so hyperglycemia in pancreatic cancer patients may stimulate HIF-1α in pancreatic cancer cells. We undertook the present study to test this hypothesis, primarily using wild-type (wt) MiaPaCa2 pancreatic cancer cells and a MiaPaCa2 subline (namely si-MiaPaCa2) that had HIF-1α-specific small interfering RNA. Wt-MiaPaCa2 cells are known to be HIF-1α-positive in hypoxia and HIF-1α-negative in normoxia. As a result of RNA interference (RNAi), HIF-1α protein is not detectable by western blotting in si-MiaPaCa2 cells even after the cells are incubated in hypoxic conditions.16
Results
HIF-1α expression in studied cells
HIF-1α is a master regulator of cancer-cell aggressiveness. We hypothesized that hyperglycemia in pancreatic cancer patients may stimulate HIF-1α in pancreatic cancer cells and increase cancer-cell aggressiveness. To test this hypothesis, we determined the effect of excess glucose on HIF-1α expression in pancreatic cancer cells in vitro. Excess glucose increased HIF-1α mRNA in both normoxic and hypoxic wt-MiaPaCa2 cells (Fig. 1A). In normoxia, HIF-1α mRNA contents in si-MiaPaCa2 cells with 5.6mM glucose equaled to ~40% of control value seen in wt-MiaPaCa2 cells (Fig. 1B). Increased extracellular glucose did not increase HIF-1α mRNA in si-MiaPaCa2 cells (Fig. 1B). In hypoxic wt-MiaPaCa2 cells, HIF-1α protein was expressed in the presence of 5.6mM glucose. The HIF-1α protein expression appeared to be increased when extracellular glucose was increased to a range of hyperglycemia (Fig. 2A). We digitalized HIF-1α expression from 12 western blotting assays and compared the results, using data from hypoxic wt-MiaPaCa2 cells with 5.6 mM glucose as a baseline (100%). HIF-1α protein was increased insignificantly (120% ± 11%, p > 0.05) when hypoxic wt-MiaPaCa2 cells were incubated with 11.1 mM glucose. However, HIF-1α protein was increased significantly when extracellular glucose concentration was increased to 16.7mM (202% ± 27%, p < 0.01) and 22.2mM (210% ± 34%, p < 0.01). The levels of HIF-1α expression induced by 16.7mM and 22.2 mM glucose were also higher than those seen in hypoxic wt-MiaPaCa2 cells with 11.1mM glucose (p < 0.01). In normoxia, HIF-1α protein was not detectable in wt-MiaPaCa2 (Fig. 2A) and si-MiaPaCa2 cells (data not shown). HIF-1α remained undetectable after si-MiaPaCa2 cells were incubated in hypoxia for six hours (Fig. 2A).
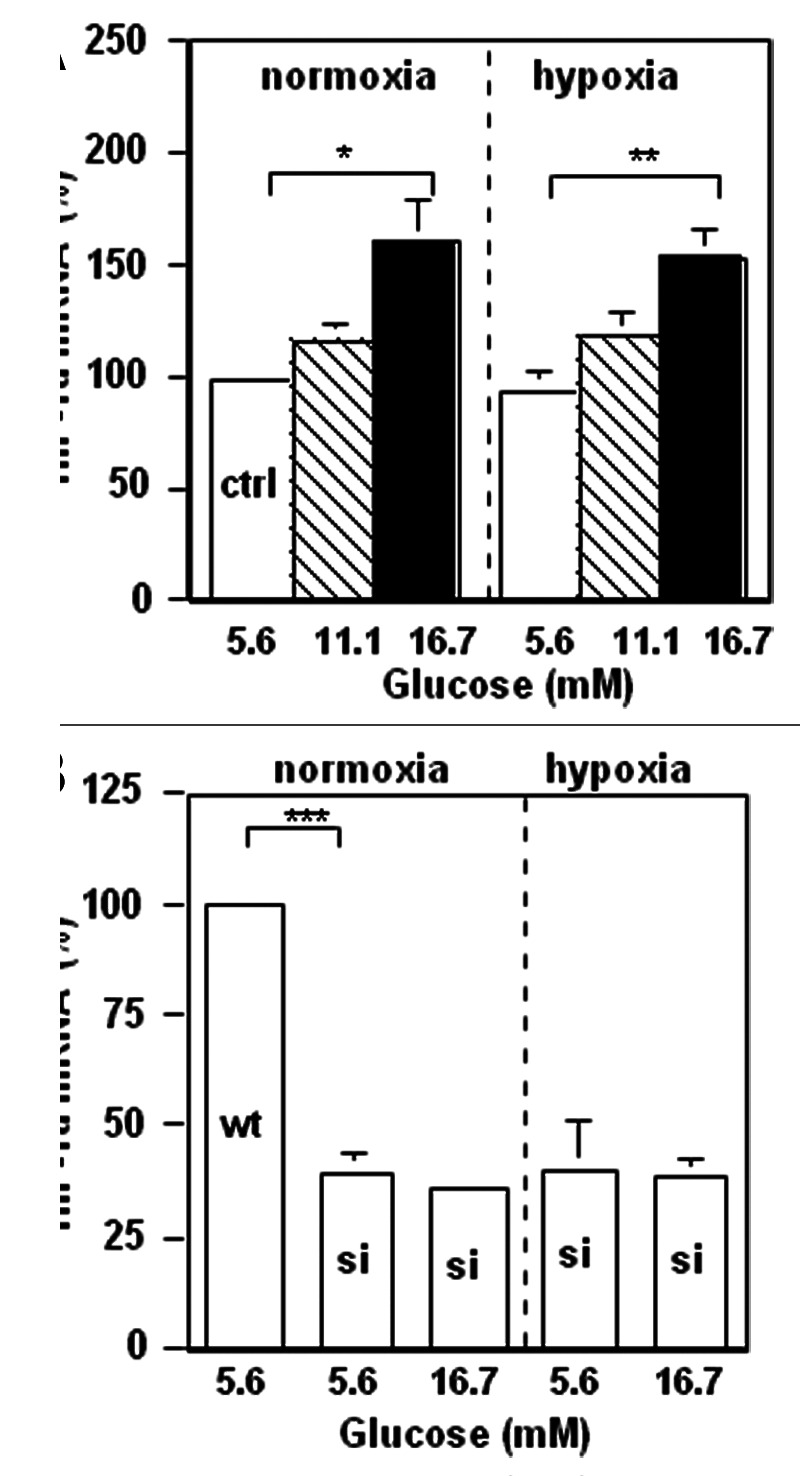
Figure 1. Wt-MiaPaCa2 (A) and si-MiaPaCa2 (B) pancreatic cancer cells were incubated with different amounts of glucose in normoxia or hypoxia for four hours. HIF-1α mRNA contents were determined by real-time polymerase chain reaction. n = 9. *p < 0.05, **p < 0.01 and ***p < 0.001.
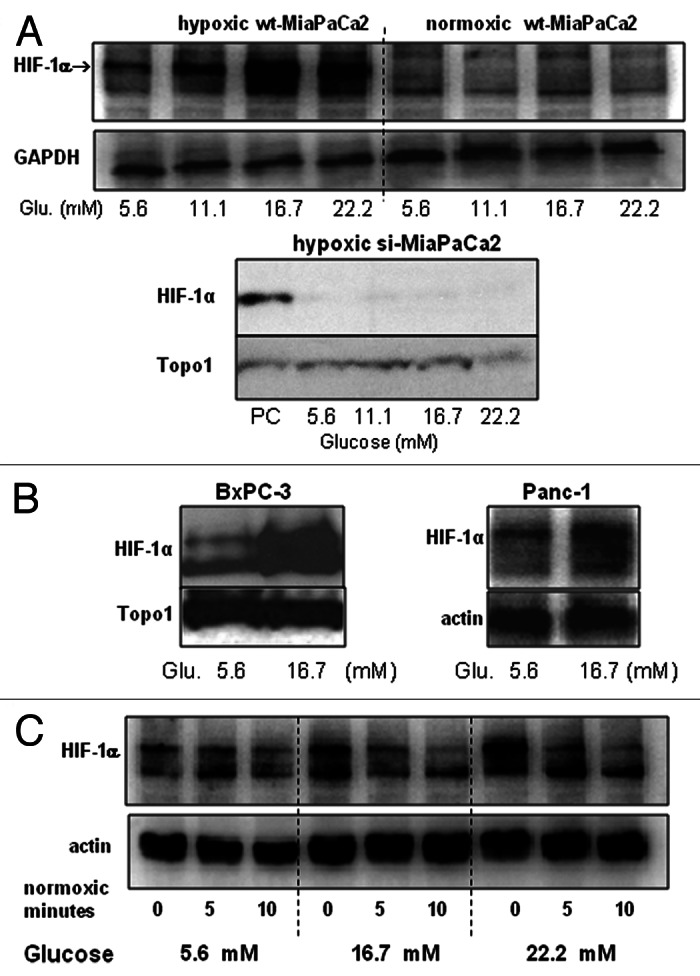
Figure 2.(A and B) Wt-MiaPaCa2 (A), si-MiaPaCa2 (A), BxPC-3 (B) and Panc-1 (B) pancreatic cancer cells were incubated with different amounts of glucose in hypoxia or normoxia for six hours. HIF-1α was determined by western blotting, using GAPDH, Topo1 and β-actin as loading controls. When necessary, hypoxic wt-MiaPaCa2 cells were used as a positive control (PC). (C) Wt-MiaPaCa2 cells were incubated in hypoxia for 6 h, using media with 5.6-, 16.7- and 22.2 mM glucose. Then, the cells were incubated in normoxia for 0-, 5- or 10 min using the same media. Afterwards, HIF-1α was determined by western blotting.
To investigate whether extracellular glucose increased HIF-1α expression in other pancreatic cancer cells, we determined HIF-1α protein in BxPc-3 and Panc-1 cells after they were cultured in hypoxia for six hours. Excess glucose (16.7mM) stimulated HIF-1α in both cell lines (Fig. 2B). To investigate whether excess glucose inhibited HIF-1α degradation, we incubated wt-MiaPaCa2 cells in hypoxia for six hours using culture media with 5.6-, 16.7- and 22.2 mM glucose. Then, the cells were incubated in normoxia for 0-, 5- or 10 min using the same media. Back in normoxia, wt-MiaPaCa2 cells with the different amounts of glucose showed similar rates of HIF-1α degradation (Fig. 2C). Thus, extracellular glucose did not regulate HIF-1α degradation in normoxic wt-MiaPaCa2 cells.
PI-3K and Akt regulate growth factor-induced HIF-1α expression.10 Whether they also regulated glucose-induced HIF-1α expression was unclear. We performed a set of experiments to address this question (Fig. 3). First of all, we studied PI-3K, HIF-1α and hexokinase-II (HK-II) expression in wt-MiaPaCa2 cells after 3- or 6-h hypoxic incubation, using normoxic wt-MiaPaCa2 cells as controls. Hypoxia induced HIF-1α expression in a time-dependent manner in association with an increase in PI-3K and HK-II expression (Fig. 3A). When hypoxic wt-MiaPaCa2 cells were incubated with LY294002, the PI-3K inhibitor attenuated glucose-induced HIF-1α expression (Fig. 3B). Further, extracellular glucose stimulated PI-3K expression in hypoxic wt-MiaPaCa2 cells (Fig. 3C). We digitalized PI-3K-expression data from eight experiments, using data from cells with 5.6mM glucose as controls. PI-3K expression in hypoxic wt-MiaPaCa2 cells with 16.7 mM and 22.2 mM glucose equaled to 151% ± 7% (p < 0.001) and 163% ± 9% (p < 0.001) of the control value. Akt is downstream of PI-3K in the intracellular signaling for HIF-1α expression. In the present experiments, we found that increased glucose augmented phospho-Akt (p-Akt) in both hypoxia and normoxia (Fig. 3D).
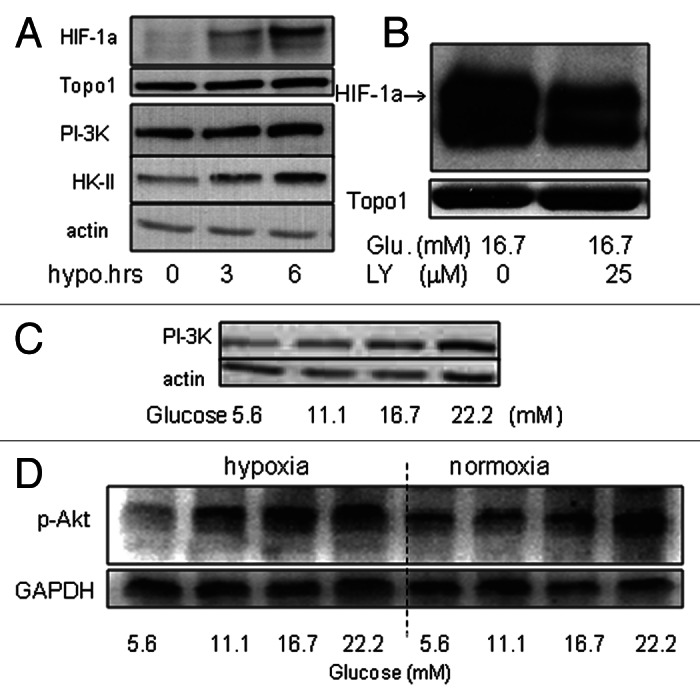
Figure 3.(A) HIF-1α, PI-3K and HK-II were determined by western blotting in wt-MiaPaCa2 cells after 0−6h hypoxic incubation. Topo1 and β-actin were used as loading controls. (B) Wt-MiaPaCa2 cells were incubated in hypoxia for six hours, using culture media that contained 16.7mM glucose in the absence or presence of LY294002 (LY, 25 μM). HIF-1α was determined by western blotting. (C) Wt-MiaPaCa2 cells underwent 6 h hypoxic incubation with different amounts of glucose. The p85 subunit of PI-3K was determined by western blotting. (D) Wt-MiaPaCa2 cells were incubated with different amounts of glucose in hypoxia or normoxia. Phospho-Akt was determined by western blotting, using GAPDH as a loading control.
Glucose metabolisms and ATP contents in different MiaPaCa2 cells
We exposed wt- and si-MiaPaCa2 cells to different amounts of glucose in hypoxia or normoxia and examined their glucose metabolisms and ATP contents. When data from the different cells were compared with each other, we were able to see whether hypoxia, glucose and HIF-1α cooperated with each other to regulate glucose metabolisms and energy homeostasis.
Hexokinase (e.g., HK-II) phosphorylates glucose to produce glucose-6-phosphate. This product subsequently goes through glycolysis, OXPHOS or pentose phosphate pathways.17,18 Intermediate metabolites from these pathways may also serve as substrates in anabolic metabolisms.19,20 Thus, hexokinase is involved in almost all glucose metabolisms. In the present study, increased extracellular glucose stimulated HK-II expression in all three cell types examined, namely normoxic wt-MiaPaCa2 (HIF-1α-negative), hypoxic wt-MiaPaCa2 (HIF-1α-positive) and hypoxic si-MiaPaCa2 (devoid of HIF-1α as a result of RNAi) (Fig. 4). These suggest that glucose induced HK-II expression independent of hypoxia and HIF-1α. In hypoxia, extracellular glucose induced greater HK-II expression in wt-MiaPaCa2 cells than in si-MiaPaCa2 cells (Fig. 4). So, glucose also induced HK-II expression by a mechanism that was dependent on HIF-1α.

Figure 4. Wt-MiaPaCa2 (wt) and si-MiaPaCa2 (si) cells were incubated with different amounts of glucose for six hours in normoxia or hypoxia. HK-II was determined by western blotting, using β-actin as a loading control.
To assess glucose consumption and glycolysis, we incubated wt- and si-MiaPaCa2 cells in normoxia and hypoxia separately. Krebs-Henseleit (KH) buffers with different amounts of glucose were used as culturing media. After incubation, we determined glucose and lactate in removed media. First of all, we found that data from normoxic wt- and si-MiaPaCa2 cells were essentially identical to each other, which was consistent with the finding that both wt- and si-MiaPaCa2 cells were devoid of HIF-1α protein in normoxia. Thus, data from normoxic wt- and si-MiaPaCa2 cells were shown in the same groups in Figure 5 (the left panels). In normoxia, MiaPaCa2 cells with 16.7 mM glucose had greater glucose consumption than those with 2.8–11.1 mM glucose (Fig. 5A). Similarly, hypoxic wt- and si-MiaPaCa2 cells with 16.7 mM glucose had greater glucose consumption than those with 2.8 mM glucose (Fig. 5a). When glucose consumption was compared in different MiaPaCa2 cells that were treated with the same glucose concentrations, no significant differences were found (Fig. 5A). These results suggest that extracellular glucose increased glucose consumption independent of hypoxia and HIF-1α.
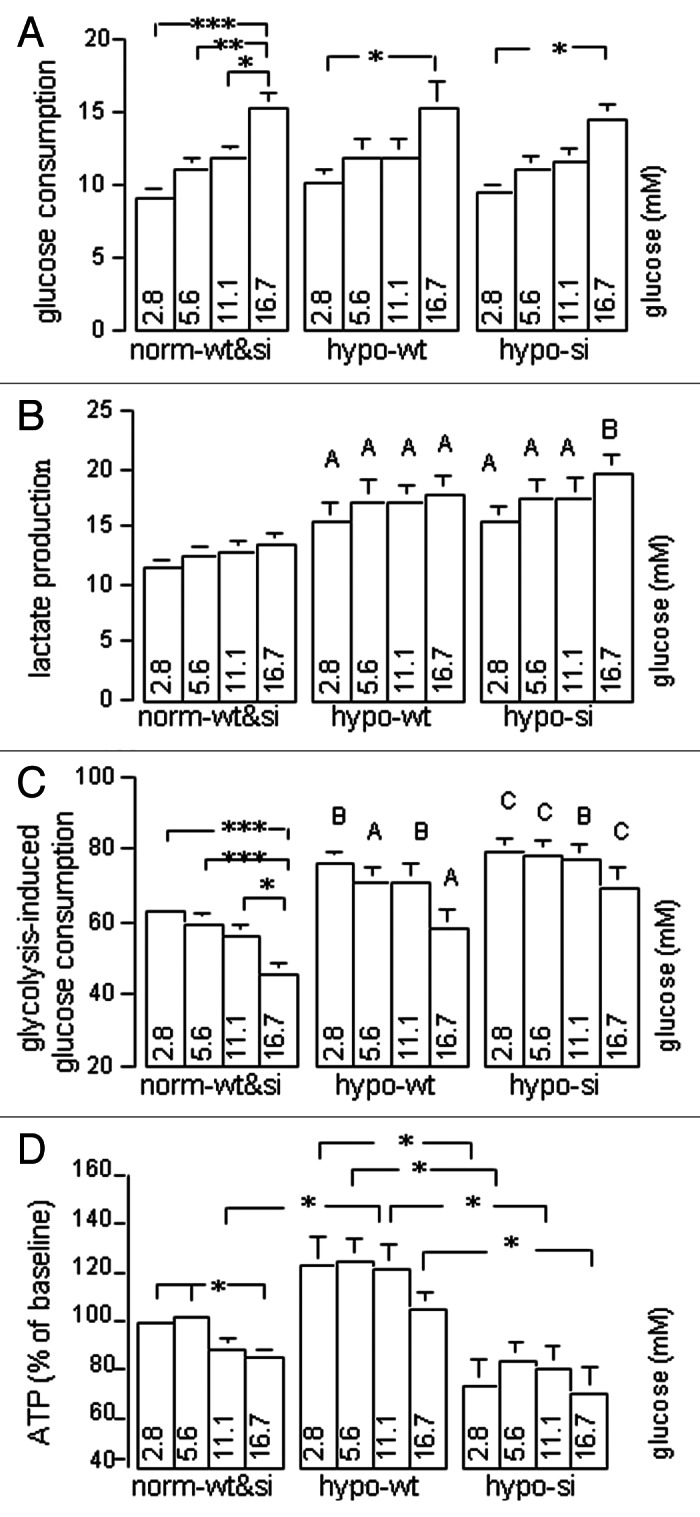
Figure 5. Normoxic wt- and si-MiaPaCa2 cells (norm-wt&si), hypoxic wt-MiaPaCa2 cells (hypo-wt) and hypoxic si-MiaPaCa2 cells (hypo-si) were incubated for six hours in KH buffers with different amounts of glucose. Glucose and lactate were determined in removed buffers. (A) Glucose consumption (nmol/μg of protein) denotes the differences between glucose concentrations in fresh buffers and those in used buffers. (B) Lactate production (nmol/μg of protein) denotes lactate concentrations in used buffers. (C) Glycolysis-induced glucose consumption was calculated using the formula: lactate production ÷ glucose consumption ÷ 2 × 100. (D) Intracellular ATP was determined, using data from normoxic cells with 2.8 mM glucose as a baseline (100%). Data in panels A−C are derived from ≥ 13 experiments and those in panel D from 9 experiments. *p < 0.05, **p < 0.01 and ***p < 0.001. Capital letters in panels B and C indicate significant differences between the values of indicated hypoxic cells and those of the normoxic cells that were treated with the same glucose concentrations; A (p < 0.05), B (p < 0.01) and C (p < 0.001).
Lactate accumulation in culture media was an index of glycolysis levels in studied cells. When this parameter was examined, tendencies were seen for increased extracellular glucose to stimulate glycolysis (Fig. 5B). However, the tendencies were not significant statistically. When lactate accumulation was compared in different types of MiaPaCa2 cells, hypoxic wt-MiaPaCa2 and si-MiaPaCa2 cells showed greater values than normoxic cells (Fig. 5B). Of note, the hypoxia-induced glycolysis was seen in both wt- and si-MiaPaCa2 cells in all glucose concentrations. Thus, the hypoxia-induced glycolysis was independent of both extracellular glucose and intracellular HIF-1α.
Glycolysis-induced glucose consumption was another index of glycolysis that showed the levels of glycolysis relative to other glucose metabolisms (i.e., relative levels of glycolysis). In normoxic cells with 2.8−5.6 mM glucose, ~60% of glucose consumption was attributed to glycolysis. When extracellular glucose was increased to 16.7mM, relative levels of glycolysis were decreased significantly in normoxic MiaPaCa2 cells (Fig. 5C). In contrast, relative levels of glycolysis were not decreased significantly when hypoxic wt- and si-MiaPaCa2 cells were challenged with excess glucose (Fig. 5c). When relative levels of glycolysis were compared in different MiaPaCa2 cells that were incubated with the same glucose concentrations, hypoxic wt- and si-MiaPaCa2 cells showed higher glycolysis levels than normoxic cells (Fig. 5c, p < 0.05−p < 0.01).
Excess glucose decreased ATP in normoxic MiaPaCa2 cells (Fig. 5d). When ATP contents were compared in different MiaPaCa2 cells that were treated with the same glucose concentrations, hypoxic wt-MiaPaCa2 cells (HIF-1α-positive) had more ATP than the other MiaPaCa2 cells that were devoid of HIF-1α (Fig. 5d).
Taken together, when MiaPaCa2 cells were challenged with excess glucose in normoxia, glucose may stimulate energy-consuming metabolisms (e.g., anabolic metabolisms) more than energy-producing metabolisms, so the cells showed both increased glucose consumption and decreased ATP contents. On the other hand, when MiaPaCa2 cells were challenged with excess glucose in hypoxia, increased glucose consumption was mainly attributed to an increase in glycolysis. Thus, normoxic and hypoxic MiaPaCa2 cells had similar glucose consumption and, at the same time, also had different levels of glycolysis.
PDK-1, ROS and fumarate in different MiaPaCa2 cells
PDK-1, whose expression is regulated by HIF-1α,4,5 inhibits mitochondrial activities. Wt-MiaPaCa2 cells had more PDK-1 in hypoxia than in normoxia (Fig. 6A). We digitalized PDK-1 data in hypoxic wt-MiaPaCa2 cells, using data from cells with 2.8mM glucose as a baseline (100%). Wt-MiaPaCa2 cells with 16.7 mM glucose had more PDK-1 (114.2% ± 3.5%, n = 8, p < 0.01) than those with 2.8 mM and 5.6 mM glucose. When ROS were quantified in wt-MiaPaCa2 cells, increased extracellular glucose decreased ROS in both normoxia and hypoxia (Fig. 6B). Hypoxic wt-MiaPaCa2 cells with 5.6 mM glucose had more ROS than their normoxic counterparts, whereas hypoxic wt-MiaPaCa2 cells with 16.7 mM glucose had less ROS than their normoxic counterparts (Fig. 6B). Thus, excess glucose decreased ROS to greater extents in hypoxia, than it did in normoxia.
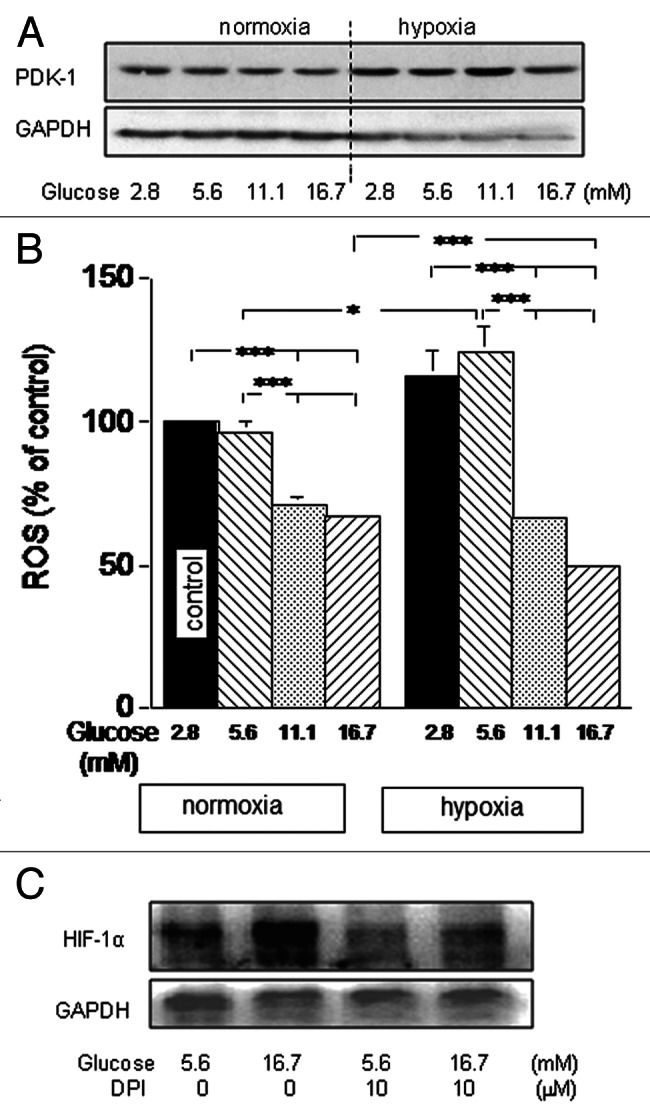
Figure 6. Wt-MiaPaCa2 cells were incubated with different amounts of glucose in normoxia or hypoxia for six hours. (A) PDK-1 was determined by western blotting, using GAPDH as a loading control. (B) ROS were determined by flow cytometry. n = 9. * p < 0.05 and *** p < 0.001. (C) Hypoxic wt-MiaPaCa2 cells were incubated in the absence or presence of diphenyleneiodonium (DPI, 10 μM). HIF-1α was determined by western blotting.
Excess glucose increased HIF-1α and decreased ROS in the same wt-MiaPaCa2 cells. The results appear to be in contrast to a previous finding that suggests that ROS support HIF-1α expression.21 Although excess glucose decreased ROS in MiaPaCa2 cells, the remaining ROS may be sufficient to support HIF-1α expression. If so, HIF-1α expression may be attenuated when hypoxic wt-MiaPaCa2 cells were incubated with an ROS inhibitor. To test this, we incubated hypoxic wt-MiaPaCa2 cells in the absence or presence of diphenyleneiodonium (DPI). Indeed, the ROS inhibitor attenuated HIF-1α expression (Fig. 6C).
Fumarate is an intermediate metabolite in the citric acid cycle. It frequently increases in cancer cells and contributes to cancer-induced HIF-1α.22 HIF-1α induces PDK-1 expression and inhibits the first part of the citric acid cycle.4,5 We hypothesized that HIF-1α also inhibits mitochondrial metabolisms that are distal to fumarate and thus increases fumarate. In that case, HIF-1α and fumarate may form a feed-forward cycle to support cancer cells. To test this possibility, we determined fumarate in the present study. As a result, hypoxic si-MiaPaCa2 cells had less fumarate than normoxic wt-MiaPaCa2 cells (Table 1). This suggests that hypoxia inhibited pyruvate influx into the mitochondria and thus decreased mitochondrial metabolites. In contrast, wt-MiaPaCa2 cells had similar fumarate contents in hypoxia and normoxia (Table 1). So, hypoxia no longer decreased fumarate when HIF-1α was expressed. This result is in keeping with our hypothesis that HIF-1α increases fumarate. When excess glucose (16.7 mM) increased HIF-1α in hypoxic wt-MiaPaCa2 cells, fumarate was not increased further (Table 1). It suggests that basal HIF-1α expression already increased fumarate to such an extent that increased HIF-1α cannot augment the metabolite further.
Table 1. Fumarate in different MiaPaCa2 cells.
| Cell types | Fumarate (nmol/million cells) | |
|---|---|---|
| |
5.6 mM glucose (n) |
16.7 mM glucose (n) |
| normoxic wt-MiaPaCa2 |
29.0 ± 2.5 (16)* |
30.9 ± 2.5 (16)* |
| hypoxic si-MiaPaCa2 |
18.9 ± 2.3 (10) |
20.2 ± 3.3 (10) |
| hypoxic wt-MiaPaCa2 | 31.6 ± 2.3 (11)* | 32.8 ± 2.9 (11)* |
p < 0.05 between indicated cells and hypoxic si-MiaPaCa2 cells with the same glucose concentrations.
Cell motility
To assess cell migration, we incubated wt- and si-MiaPaCa2 cells in normoxic or hypoxic conditions for 16 h, using a Boyden chamber that contained a porous membrane. Cells that went through the membrane were counted in a light microscope. Increased extracellular glucose stimulated cell migration in both normoxia and hypoxia. In normoxia, glucose-induced stimulation was similar between wt- and si-MiaPaCa2 cells (Fig. 7A). In hypoxia, more wt-MiaPaCa2 cells went through the membrane than their si-MiaPaCa2 counterparts (Fig. 7B).
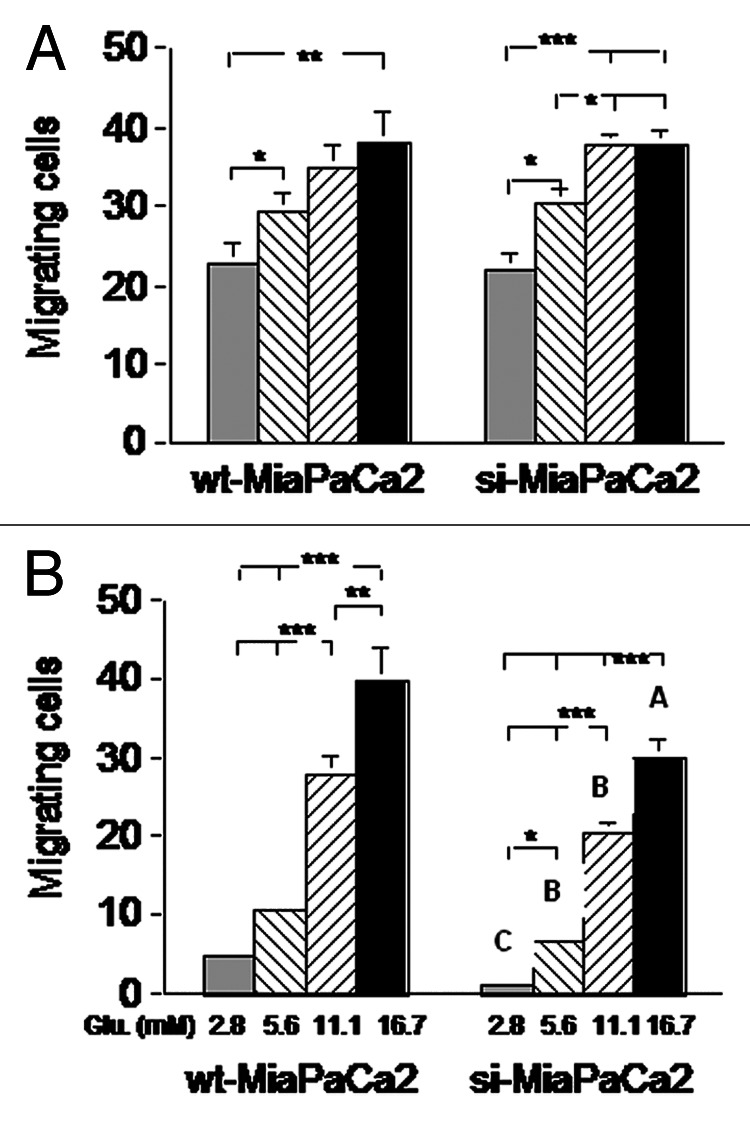
Figure 7. Wt- and si-MiaPaCa2 cells were placed in a Boyden chamber (with a porous membrane) and incubated in normoxia (A) or hypoxia (B) for 16 h. Cells found on the opposite side of the membrane were counted. Each experimental condition was tested in ≥ 25 wells at different time points. *p < 0.05, **p < 0.01 and ***p < 0.001. Capital letters in panel B indicate significant differences between indicated si-MiaPaCa2 cells and their wt-MiaPaCa2 counterparts; A (p < 0.05), B (p < 0.01) and C (p < 0.001).
Discussion
In the present study, normoxic wt-MiaPaCa2 cells did not contain HIF-1α protein even when their HIF-1α mRNA contents were increased by extracellular glucose. This suggests that HIF-1α-production rates were still slower than HIF-1α-degradation rate in the normoxic cells. At protein level, HIF-1α was expressed by wt-MiaPaCa2 cells in hypoxia but not normoxia, which is consistent with the knowledge that hypoxia inhibits HIF-1α degradation. Importantly, increased extracellular glucose stimulated HIF-1α protein expression in hypoxic wt-MiaPaCa2 cells. Because excess glucose also increased HIF-1α mRNA in the same cells, glucose-induced HIF-1α expression may involve an increase in HIF-1α production. In keeping with this notion, excess glucose also increased PI-3K and p-Akt in wt-MiaPaCa2 cells.
In a previous study, Kwon and Lee incubated MiaPaCa2 cells in hypoxia (0.1−1% O2) for eight hours using media containing 0−25mM glucose.23 When extracellular glucose was increased in a range of hypoglycemia, HIF-1α expression was stimulated markedly.23 However, HIF-1α was not increased further when extracellular glucose was increased to hyperglycemic levels.23 It is unclear why hyperglycemic levels of glucose stimulated HIF-1α expression in the present study but not the previous one. Hypoxic incubations used in these studies differed in length (6 h vs. 8 h) and in oxygen concentrations (1% vs. 0.1−1%), and these differences might diversify HIF-1α expression. In addition, glucose concentrations in pre-incubating media may influence subsequent HIF-1α expression. In the present study, the pre-incubating medium had 5.6 mM glucose. However, the corresponding information for the previous study was unknown.
Hypoxic conditions increased glycolysis in MiaPaCa2 cells independent of extracellular glucose. The result suggests that when MiaPaCa2 cells were in hypoxia, intracellular glucose was mainly used for glycolysis. Because hypoxia-induced glycolysis was seen in both wt- and si-MiaPaCa2 cells, this effect was also independent of HIF-1α. Other intracellular regulators of glucose metabolisms, such as Akt and c-Myc, may regulate the hypoxia-induced glycolysis.24
Hypoxic wt-MiaPaCa2 cells had more ATP than the MiaPaCa2 cells that were devoid of HIF-1α protein. This suggests that HIF-1α expression improved energy homeostasis in MiaPaCa2 cells. It is unclear why HIF-1α increased ATP without increasing glucose consumption and glycolysis. However, the present results are comparable to a previous study.25 In that study, wild-type HEPA-1 hepatoma cells and c4 HEPA-1 cells deficient in HIF-1 were grown as tumor grafts in nude mice. Although lactate contents were similar in wild-type tumors and c4 tumors, the former tumors (HIF-1-positive) had more ATP than the latter.25 The authors showed evidence suggesting that the effect of HIF-1 on ATP may result from an increase in glycine formation.25
In the present study, glucose-induced HIF-1α stimulated both PDK-1 expression and ROS reduction in MiaPaCa2 cells. These suggest that HIF-1α inhibited mitochondrial activities. In addition, the finding that hypoxic wt-MiaPaCa2 cells had more fumarate than si-MiaPaCa2 cells is another piece of evidence that suggests that HIF-1α targeted mitochondrial activities in MiaPaCa2 cells.
Increased extracellular glucose stimulated the migration of wt- and si-MiaPaCa2 cells in both normoxia and hypoxia. This being the case, glucose-induced cell migration was independent of HIF-1α. In hypoxia, however, wt-MiaPaCa2 cells showed greater migrating ability than si-MiaPaCa2 cells. Thus, glucose also stimulated cell migration by a mechanism that was dependent on HIF-1α. Given that HIF-1α increased ATP in hypoxic wt-MiaPaCa2 cells, the improvement in energy homeostasis may be responsible for increased migration seen in the HIF-1α-positive MiaPaCa2 cells.
Pancreatic cancer is frequently associated with diabetes.15 Mechanisms underlying the cancer-associated diabetes are unclear. As a possible mechanism, unrestrained glycolysis in pancreatic cancer cells may increase energy output in the tumor carrier, disrupt whole-body nutrient homeostasis and induce diabetes.16 The present results suggest that hyperglycemia in pancreatic cancer may in return increase HIF-1α expression and cell aggressiveness in pancreatic cancer cells. Thus, energy homeostasis in pancreatic cancer cells may interplay with nutrient homeostasis in the tumor carrier.16
In summary, we have demonstrated that excess glucose stimulates HIF-1α expression, increases ATP contents and stimulates migration in MiaPaCa2 pancreatic cancer cells. In addition, extracellular glucose and hypoxia may regulate glucose metabolisms and cell migration independent of HIF-1α. More studies are required to clarify the effects of glucose and hypoxia on pancreatic cancer cells.
Materials and Methods
Cell incubation
Wt-MiaPaCa2, BxPC-3 and Panc-1 cells were bought from the European Collection of Cell Cultures. Si-MiaPaCa2 cells were prepared as described elsewhere.16 All cells were cultured at 37°C in 95% air and 5% CO2 (normoxia), using serum-containing (10%) Dulbecco’s modified Eagle media (DMEM) with 5.6 mM glucose (Invitrogen, #12320). When cells were 80% confluent, experimental incubation was set up, using DMEM (Invitrogen, #11966, originally glucose-free) or KH buffers supplemented with known amounts of glucose. Cells were incubated in normoxia or hypoxia (1% O2, 5% CO2 and 94% N2).16 In hypoxic incubation, O2 and CO2 concentrations were determined using a gas meter (Dansensor).
Real-time polymerase chain reaction (PCR) and western blotting
Wt- and si-MiaPaCa2 cells were prepared in 6-well plates. After four-hour experimental incubation, HIF-1α mRNA was determined in a TagMan duplex real-time PCR, using 18S rRNA as an internal control.16 When HIF-1α protein was determined, pancreatic cancer cells were prepared in Petri dishes. During experimental incubation, cells were cultured in hypoxia or normoxia for six hours, using DMEM with different amounts of glucose. In some experiments, culturing media also contained LY294002 (Calbiochem) or DPI (Sigma). Whole-cell proteins were prepared, using RIPA cell lysis buffer (Amresco). In some experiments, nuclear and cytosolic proteins were extracted separately.16 HIF-1α was determined either in nuclear protein using a monoclonal antiserum (BD Biosciences, #610958) or in whole-cell protein using a polyclonal antiserum (Novus, #100–449). HK-II, PI-3K, p-Akt and PDK-1 were determined in whole-cell or cytosolic proteins, using antisera from Santa Cruz Biotechnology (#6521), Upstate (#06–195), Cell Signaling (#9271) and Assay Design (#Kap-PK112). GAPDH, Topo-1 and β-actin were determined as loading controls. Secondary antisera were produced by Amersham (NA931 and NA934) and Chemicom (AP106P). Each target protein was assayed for 3–12 times. Results were documented in an image analysis system (ChemiDoc XRS, Bio-Rad) and digitalized using the software of ImageJ.
Glucose consumption, glycolysis and ATP contents in different MiaPaCa2 cells
Cells were incubated for six hours in KH buffers with different amounts of glucose. Cellular protein contents were determined using a BCA assay kit. Glucose and lactate were determined in removed buffers, using a biochemical analyzer (YSI model 2700). Measured glucose concentrations were checked against original glucose concentrations, and the differences denoted glucose consumption by cells. Fresh KH buffers had no lactate, so lactate contents in used buffers indicated lactate-production rates in cells (hence glycolysis levels in the cells). Original data of glucose consumption and lactate production were normalized with cellular protein contents (nmol/μg). Should glucose consumption be totally induced by glycolysis, the molar ratio of lactate production to glucose consumption would be 2. We used the following formula to calculate the percentage of glucose consumption that was induced by glycolysis: lactate production (nmol) ÷ glucose consumption (nmol) ÷ 2 × 100. Intracellular ATP was determined using a kit (#K554) from BioVision.
ROS and fumarate in different MiaPaCa2 cells
Wt-MiaPaCa2 cells were prepared in 6-well plates for an ROS assay. During experimental incubation, cells were incubated in DMEM with different amounts of glucose. The incubation was conducted in either normoxia or hypoxia for six hours. In the last 30 min, a fluorescent probe namely CM-H2DCFDA (Molecular Probes) was added at a final concentration of 5 µM. Fluorescence was measured in a flow cytometer, using the wavelengths of 480 nm and 525 nm for excitation and emission. In a fumarate assay, wt- and si-MiaPaCa2 cells were incubated with 5.6 mM or 16.7mM glucose in normoxia or hypoxia for six hours. Intracellular fumarate was determined using a fumarate kit (BioVision, #K633).
Migrating abilities in different MiaPaCa2 cells
A porous membrane (pore diameter = 12 µm, Poretics) was coated with fibronectin on both sides and put between the upper and lower compartments of a 48-well Boyden chamber (Neuro Probe). Wt- and si-MiaPaCa2 cells were suspended in DMEM and placed in upper wells (5 × 10⁴/ well). Media in lower wells contained insulin-like growth factor-I (50ng/ml). The chamber was incubated in normoxia or hypoxia for 16 h. Cells found on the opposite side of the membrane were counted in a microscope.
Statistics
Data are means ± SEM. When three or more groups were involved, results were analyzed using analysis of variance and the Bonferroni posttest. When fewer groups were involved, the student’s t-test was used. p < 0.05 was considered significant.
Glossary
Abbreviations:
- DPI
diphenyleneiodonium
- GAPDH
glyceraldehyde 3-phosphate dehydrogenase
- HIF
hypoxia-inducible factor
- HK
hexokinase
- OXPHOS
oxidative phosphorylation
- PCR
polymerase chain reaction
- PDK-1
pyruvate dehydrogenase kinase-1
- PI-3K
phosphatidylinositol 3-kinase
- ROS
reactive oxygen species
Disclosure of Potential Conflicts of Interest
No potential conflicts of interest were disclosed.
Footnotes
Previously published online: www.landesbioscience.com/journals/cbt/article/23786
References
- 1.Semenza GL, Wang GL. A nuclear factor induced by hypoxia via de novo protein synthesis binds to the human erythropoietin gene enhancer at a site required for transcriptional activation. Mol Cell Biol. 1992;12:5447–54. doi: 10.1128/mcb.12.12.5447. [DOI] [PMC free article] [PubMed] [Google Scholar]
- 2.Salceda S, Caro J. Hypoxia-inducible factor 1alpha (HIF-1alpha) protein is rapidly degraded by the ubiquitin-proteasome system under normoxic conditions. Its stabilization by hypoxia depends on redox-induced changes. J Biol Chem. 1997;272:22642–7. doi: 10.1074/jbc.272.36.22642. [DOI] [PubMed] [Google Scholar]
- 3.Natsuizaka M, Ozasa M, Darmanin S, Miyamoto M, Kondo S, Kamada S, et al. Synergistic up-regulation of Hexokinase-2, glucose transporters and angiogenic factors in pancreatic cancer cells by glucose deprivation and hypoxia. Exp Cell Res. 2007;313:3337–48. doi: 10.1016/j.yexcr.2007.06.013. [DOI] [PubMed] [Google Scholar]
- 4.Papandreou I, Cairns RA, Fontana L, Lim AL, Denko NC. HIF-1 mediates adaptation to hypoxia by actively downregulating mitochondrial oxygen consumption. Cell Metab. 2006;3:187–97. doi: 10.1016/j.cmet.2006.01.012. [DOI] [PubMed] [Google Scholar]
- 5.Kirito K, Hu Y, Komatsu N. HIF-1 prevents the overproduction of mitochondrial ROS after cytokine stimulation through induction of PDK-1. Cell Cycle. 2009;8:2844–9. doi: 10.4161/cc.8.17.9544. [DOI] [PubMed] [Google Scholar]
- 6.Warburg O. On the origin of cancer cells. Science. 1956;123:309–14. doi: 10.1126/science.123.3191.309. [DOI] [PubMed] [Google Scholar]
- 7.Zhong H, De Marzo AM, Laughner E, Lim M, Hilton DA, Zagzag D, et al. Overexpression of hypoxia-inducible factor 1alpha in common human cancers and their metastases. Cancer Res. 1999;59:5830–5. [PubMed] [Google Scholar]
- 8.Koong AC, Mehta VK, Le QT, Fisher GA, Terris DJ, Brown JM, et al. Pancreatic tumors show high levels of hypoxia. Int J Radiat Oncol Biol Phys. 2000;48:919–22. doi: 10.1016/S0360-3016(00)00803-8. [DOI] [PubMed] [Google Scholar]
- 9.Maxwell PH, Dachs GU, Gleadle JM, Nicholls LG, Harris AL, Stratford IJ, et al. Hypoxia-inducible factor-1 modulates gene expression in solid tumors and influences both angiogenesis and tumor growth. Proc Natl Acad Sci U S A. 1997;94:8104–9. doi: 10.1073/pnas.94.15.8104. [DOI] [PMC free article] [PubMed] [Google Scholar]
- 10.Fukuda R, Hirota K, Fan F, Jung YD, Ellis LM, Semenza GL. Insulin-like growth factor 1 induces hypoxia-inducible factor 1-mediated vascular endothelial growth factor expression, which is dependent on MAP kinase and phosphatidylinositol 3-kinase signaling in colon cancer cells. J Biol Chem. 2002;277:38205–11. doi: 10.1074/jbc.M203781200. [DOI] [PubMed] [Google Scholar]
- 11.Vaquero EC, Edderkaoui M, Pandol SJ, Gukovsky I, Gukovskaya AS. Reactive oxygen species produced by NAD(P)H oxidase inhibit apoptosis in pancreatic cancer cells. J Biol Chem. 2004;279:34643–54. doi: 10.1074/jbc.M400078200. [DOI] [PubMed] [Google Scholar]
- 12.Karihtala P, Soini Y. Reactive oxygen species and antioxidant mechanisms in human tissues and their relation to malignancies. APMIS. 2007;115:81–103. doi: 10.1111/j.1600-0463.2007.apm_514.x. [DOI] [PubMed] [Google Scholar]
- 13.Catrina SB, Okamoto K, Pereira T, Brismar K, Poellinger L. Hyperglycemia regulates hypoxia-inducible factor-1α protein stability and function. Diabetes. 2004;53:3226–32. doi: 10.2337/diabetes.53.12.3226. [DOI] [PubMed] [Google Scholar]
- 14.Guo S, Bragina O, Xu Y, Cao Z, Chen H, Zhou B, et al. Glucose up-regulates HIF-1 alpha expression in primary cortical neurons in response to hypoxia through maintaining cellular redox status. J Neurochem. 2008;105:1849–60. doi: 10.1111/j.1471-4159.2008.05287.x. [DOI] [PubMed] [Google Scholar]
- 15.Permert J, Ihse I, Jorfeldt L, von Schenck H, Arnqvist HJ, Larsson J. Pancreatic cancer is associated with impaired glucose metabolism. Eur J Surg. 1993;159:101–7. [PubMed] [Google Scholar]
- 16.Wang F, Li SS, Segersvärd R, Strömmer L, Sundqvist KG, Holgersson J, et al. Hypoxia inducible factor-1 mediates effects of insulin on pancreatic cancer cells and disturbs host energy homeostasis. Am J Pathol. 2007;170:469–77. doi: 10.2353/ajpath.2007.060489. [DOI] [PMC free article] [PubMed] [Google Scholar]
- 17.Osada-Oka M, Hashiba Y, Akiba S, Imaoka S, Sato T. Glucose is necessary for stabilization of hypoxia-inducible factor-1alpha under hypoxia: contribution of the pentose phosphate pathway to this stabilization. FEBS Lett. 2010;584:3073–9. doi: 10.1016/j.febslet.2010.05.046. [DOI] [PubMed] [Google Scholar]
- 18.Pereira da Silva AP, El-Bacha T, Kyaw N, dos Santos RS, da-Silva WS, Almeida FC, et al. Inhibition of energy-producing pathways of HepG2 cells by 3-bromopyruvate. Biochem J. 2009;417:717–26. doi: 10.1042/BJ20080805. [DOI] [PubMed] [Google Scholar]
- 19.Moon JS, Jin WJ, Kwak JH, Kim HJ, Yun MJ, Kim JW, et al. Androgen stimulates glycolysis for de novo lipid synthesis by increasing the activities of hexokinase 2 and 6-phosphofructo-2-kinase/fructose-2,6-bisphosphatase 2 in prostate cancer cells. Biochem J. 2011;433:225–33. doi: 10.1042/BJ20101104. [DOI] [PubMed] [Google Scholar]
- 20.Iqbal MA, Bamezai RN. Resveratrol inhibits cancer cell metabolism by down regulating pyruvate kinase M2 via inhibition of mammalian target of rapamycin. PLoS One. 2012;7:e36764. doi: 10.1371/journal.pone.0036764. [DOI] [PMC free article] [PubMed] [Google Scholar]
- 21.Jung SN, Yang WK, Kim J, Kim HS, Kim EJ, Yun H, et al. Reactive oxygen species stabilize hypoxia-inducible factor-1 alpha protein and stimulate transcriptional activity via AMP-activated protein kinase in DU145 human prostate cancer cells. Carcinogenesis. 2008;29:713–21. doi: 10.1093/carcin/bgn032. [DOI] [PubMed] [Google Scholar]
- 22.Koivunen P, Hirsilä M, Remes AM, Hassinen IE, Kivirikko KI, Myllyharju J. Inhibition of hypoxia-inducible factor (HIF) hydroxylases by citric acid cycle intermediates: possible links between cell metabolism and stabilization of HIF. J Biol Chem. 2007;282:4524–32. doi: 10.1074/jbc.M610415200. [DOI] [PubMed] [Google Scholar]
- 23.Kwon SJ, Lee YJ. Effect of low glutamine/glucose on hypoxia-induced elevation of hypoxia-inducible factor-1alpha in human pancreatic cancer MiaPaCa-2 and human prostatic cancer DU-145 cells. Clin Cancer Res. 2005;11:4694–700. doi: 10.1158/1078-0432.CCR-04-2530. [DOI] [PubMed] [Google Scholar]
- 24.Fan Y, Dickman KG, Zong WX. Akt and c-Myc differentially activate cellular metabolic programs and prime cells to bioenergetic inhibition. J Biol Chem. 2010;285:7324–33. doi: 10.1074/jbc.M109.035584. [DOI] [PMC free article] [PubMed] [Google Scholar]
- 25.Griffiths JR, McSheehy PM, Robinson SP, Troy H, Chung YL, Leek RD, et al. Metabolic changes detected by in vivo magnetic resonance studies of HEPA-1 wild-type tumors and tumors deficient in hypoxia-inducible factor-1beta (HIF-1beta): evidence of an anabolic role for the HIF-1 pathway. Cancer Res. 2002;62:688–95. [PubMed] [Google Scholar]


