Abstract
Immune and inflammatory death ligands expressed within neoplastic tissue could potentially target apoptosis to transformed cells. To develop approaches that accentuate the anti-cancer potential of the inflammatory response, the Chembridge DIVERSetTM library was screened for compounds that accentuated apoptosis in a strictly TNF-dependent manner. We identified a number of novel compounds with this activity, the most active of these, AK3 and AK10, sensitized colon cancer cells to TNF at 0.5 μM and 2 μM, respectively, without inducing apoptosis on their own. The activity of these compounds was structure-dependent and general, as they accentuated cell death by TNF or Fas ligation in multiple colon cancer cell lines. Both AK3 and AK10 arrested cells in mitosis, with live cell imaging indicating that mitotically arrested cells were the source of apoptotic bodies. AK3 accentuated caspase-8 and caspase-9 activation with little effect on NFκB target gene activation. Enhanced caspase activation corresponded to an increased expression of TNFR1 on the cell surface. To determine the general interplay between mitotic arrest and TNF sensitivity, Aurora kinase (MLN8054 and MLN8237) and PLK1 (BI2536) inhibitors were tested for their ability to sensitize cells to TNF. PLK1 inhibition was particularly effective and influenced TNFR1 surface presentation and caspase cleavage like AK3, even though it arrested mitosis at an earlier stage. We propose that AK3 and AK10 represent a new class of mitotic inhibitor and that selected mitotic inhibitors may be useful for treating colon cancers or earlier lesions that have a high level of inflammatory cell infiltrate.
Keywords: colon cancer, apoptosis, TNF, TNFR1, mitosis, caspases, Fas, small molecules, PLK1
Introduction
Inflammation can play a central role in cancer promotion in many tissues, one of the best documented being the colon. Extensive ulcerative colitis (UC) has been associated with a significant increase in colon cancer development, and managing inflammation with 5-ASA decreases this risk.1,2 Inflammation may also contribute to the development of sporadic colon cancer; nonsteroidal anti-inflammatory drugs (NSAIDs) such as aspirin and ibuprofen can decrease cancer risk in the population at large by close to 50%.3-5 The interaction between inflammatory signaling and cancer may continue through late stages of the disease, as most cancers maintain elevated levels of TNF, IL6 and other inflammatory mediators.6-10 The role of inflammation in colon cancer development is multifaceted and includes the increased generation of DNA-reactive molecules, enhanced angiogenesis and activation of the anti-apoptotic transcription factor NFκB.7,8,11-14
Although inflammation is associated with cancer development, immune and inflammatory cells produce a range of molecules with potent death-inducing capabilities that have the potential to limit lesion growth. Evidence suggests that early tissue lesions are kept at bay by the immune response.15,16 Cancers are in fact found to be “immune-edited,” consistent with the active elimination of immunogenic cells from the developing lesion.17,18 In this regard, the adaptive immune response is likely to be anti-tumorigenic. The contribution of innate immunity to cancer development is less clear. Generalized inflammation has been implicated in cancer promotion.19 However, the influence of innate immune cells on cancer development may be stage-specific. In the case of advanced colon cancer, macrophage density at the tumor margin is strongly associated with a better patient outcome, which may result from their ability to generate apoptosis-inducing factors.20
The death-inducing capabilities of immune cells serves as the basis for cancer therapies utilizing vaccines or immune stimulants. For example, the inclusion of Aldesleukin and granulocyte-macrophage colony-stimulating factor (GM-CSF) with traditional chemotherapeutic agents has been shown to improve the outcome of colon cancer patients.21,22 Evidence suggests that immune stimulants activate both the innate and adaptive arms of the immune response to induce lesion regression.23-25 The anticancer activities of the immune response can be counteracted by a range of phenotypic changes in cancer cells. The cell killing actions of the adaptive immune response can be mitigated by the decreased expression of MHC molecules on cancer cells.26-28 A more general resistance to immune cell killing may also be achieved by the increased expression of anti-apoptotic proteins, such as survivin and other IAPs, by cancer cells.29,30 To obtain insight into cellular pathways that are associated with an increased resistance to immune cells, we screened a compound library for agents that sensitize colon cancer cells to TNFinduced apoptosis, without affecting cell viability on their own. The majority of compounds obtained through this screen worked through a mitotic arrest mechanism. We propose that agents that target mitosis may be well-suited for enhancing the anti-cancer actions of the immune and inflammatory response. We also discuss the possibility that the mitotic proteins that are frequently upregulated in colon cancers serve (in part) to ensure that cancer cells proceed efficiently through mitosis so that they evade elimination by apoptotic ligands.
Results
Compound screen for the induction of TNF sensitivity
Four hundred compounds from the ChemBridge DIVERSetTM library were assessed for their ability to increase the sensitivity of the HT29 colon cancer cell line to TNF-induced apoptosis (Fig. 1A). For this screen, duplicate 96 well plates were generated and treated in parallel with 40–50 μM of compound with one of the plates containing 50 ng/ml TNF. After 18 h, the plates were visually inspected for cell death and cellular extracts were prepared for an enzymatic caspase-3 assay (using the DEVD-AMC fluorogenic substrate). From this initial screen, six compounds were selected for further analysis, based on the level of caspase activation in the presence of TNF. These compounds were re-tested on HT29 cells, with active caspase-3 staining employed as a test of apoptosis. Quantification of this staining showed that the six compounds identified in the primary screen increased active capsase-3 in HT29 cells in a strictly TNF-dependent manner. The structures of these compounds are shown in Figure S1.
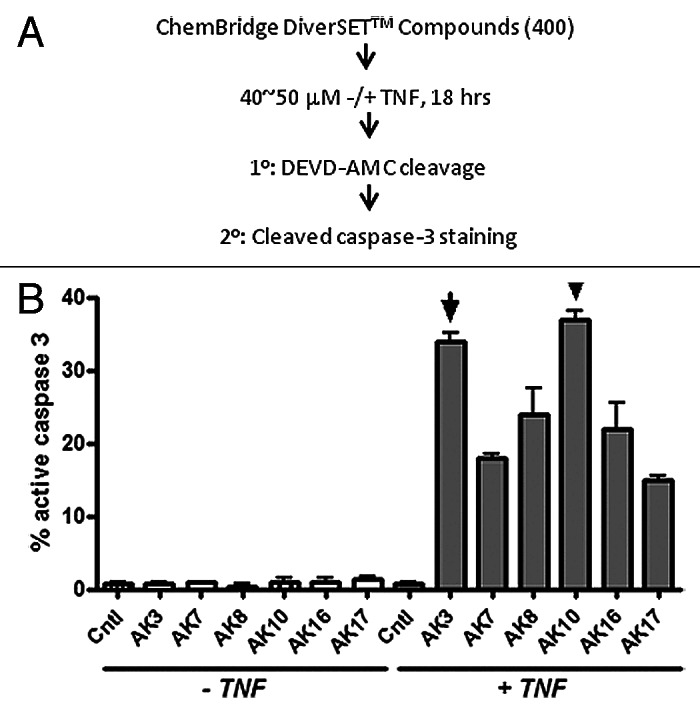
Figure 1. Identification of compounds that induce caspase-3 activation in TNFdependent manner. (A) Schematic of the strategy employed for screening compounds from ChemBridge DIVERSetTM library. HT29 colon cancer cells were treated with the test compounds for 18 h in the presence or absence of TNF (50 ng/ml). Cell lysates were prepared and tested for caspase-3 activity using the DEVD-AMC fluorogenic substrate. (B) The compound screen identified six compounds that induced caspase-3 activation only in the presence of TNF using a DEVDase assay. As a secondary screen compounds were tested by immunostaining cells using an antibody specific for cleaved/active caspase-3. Images were captured and the fraction of cells staining positively for caspase-3 was quantified. AK3 and AK10, two of the most active compounds, were selected for further investigation.
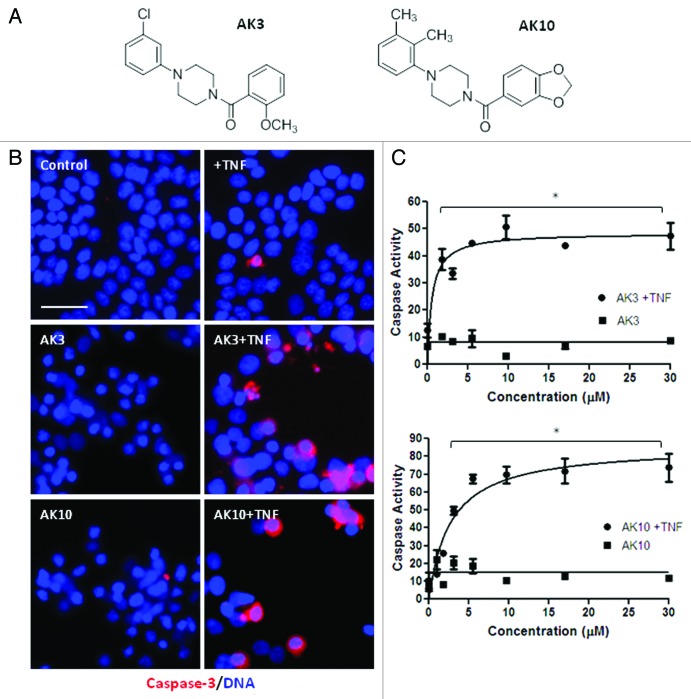
Two of the most active compounds from the screen, AK3 and AK10, were taken for further analysis. Figure 2A shows their chemical structure; both have a central piperazine group with a phenyl and a benzoyl group attached to the two piperizane nitrogens. HT29 cells treated with TNF in combination with AK3 or AK10 showed an increase in the proportion of cells expressing active caspase-3, with positively staining cells frequently showing an apoptotic morphology (Fig. 2B). A titration of the compounds for activation of caspase-3 (DEVDase) in the presence and absence of TNF is shown in Figure 2C. Neither AK3 nor AK10 significantly induced caspase-3 activity on their own, but did so when TNF was present. The level of agent required to stimulate apoptosis when TNF was present was in the low micromolar range for both AK3 and AK10, with an LD50 of 0.5 μM for AK3 and 2 μM for AK10.
Figure 2.(A) Similar chemical structure of AK3 and AK10. AK3 and AK10 both have a core piperazine group substituted with phenyl and benzoyl groups at the two piperazine nitrogens. (B) Increased caspase-3 and apoptosis in the combination treatment of AK3 or AK10 with TNF. HT29 cells were treated with AK3 or AK10 in the presence or absence of TNF. Cells were fixed, permeabilized and stained for active caspase-3. Higher proportion of cells stained for active caspase-3 in the combination treatment compared with control or AK3/AK10 treated cells. Positively staining cells displayed an apoptotic morphology. Bar, 100 μm. (C) Representative dose-response curves of caspase-3 activity with increasing concentrations of AK3 or AK10, in the presence or absence of TNF. Significant caspase activation was observed only in the combination treatment. The asterisks indicated points where the combination treatment was significantly higher than compound or TNF treatment alone (ANOVA, Tukey’s post-hoc test, p < 0.01). LD50s of AK3 and AK10 in the presence of TNF were determined to be 0.5 μM and 2.0 μM, respectively.
Since both AK3 and AK10 compounds have a similar chemical structure, we generated a number of related compounds to determine whether their TNFsensitizing activity was dependent on their structure or whether it was a property inherent to the central piperazine group. The compounds synthesized are shown in Figure S2A. Application of these compounds to HT29 cells in the presence or absence of TNF showed that AK24 had a significantly higher TNFsensitizing activity than the other derivatives (Fig. 2B). AK24 was, however, significantly less potent than AK3, as shown in Figure S2C. These structure-activity studies indicate that the activity of the piperazine-based compounds AK3 and AK10 result from specific structural elements that most likely function by binding to specific target molecules in the cell.
Generality of AK3 and AK10 activity
To determine the generality of apoptotic sensitization by AK3 and AK10, these compounds were tested on the HCT116 colon cancer cell line (Fig. 3A). HCT116 cells are more sensitive to TNFinduced apoptosis than HT29 cells (which possibly results from their wild-type p53 status). However, AK3 was capable of further enhancing TNFinduced caspase activation in these cells, whereas AK10 was not. AK3 and AK10 were also tested on a mouse colon cancer cell line, AJ02-NM0 cells (a p53-normal cell line derived from an AOM-induced colon tumor).31 TNFinduced caspase-3 activation was stimulated in these cells by both AK3 and AK10, with AK3 being more potent (Fig. 3B). Finally, we determined whether AK3 and AK10 could stimulate caspase-3 activity induced by the Fas pathway. As shown in Figure 3C, both AK3 and AK10 stimulated Fas-induced caspase activation, without significantly inducing caspase activity on their own. From these data, we conclude that both AK3 and AK10 are broadly active on different cell lines and with different death ligands, with AK3 being more general in its activity.
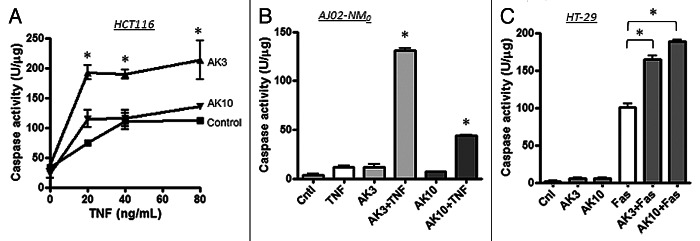
Figure 3. Effect of AK3 and AK10 on other colon cancer cell lines and on Fas-mediated cell death. (A) TNF was titrated on to HCT116 cells in the presence or absence of 20 μM AK3 or AK10. Although these cells are more inherently sensitive to TNF, AK3 significantly increased caspase activity as measured by DEVD-AMC cleavage (ANOVA, Tukey’s post hoc, *p < 0.01). AK10 did not significantly increase caspase activation in this cell line. (B) The mouse colon cancer cell line AJ02-NM0 was treated with AK3 or AK10 in the presence or absence of murine TNF and analyzed for caspase activity. Both AK3 and AK10 increased caspase activity in the presence of TNF, but not in its absence (*p < 0.001). AK3 was significantly more effective than AK10 (ANOVA, *p < 0.001). (C) AK3 and AK10 accentuated caspase activation by Fas ligation. HT29 cells were treated with AK3 or AK10 alone or in combination with an anti-Fas antibody (10 μg/ml) and analyzed for caspase activation. Although HT29 cells are sensitive to Fas ligation, both AK3 and AK10 significantly enhanced caspase activation (ANOVA, *p < 0.001).
Mitotic arrest and TNF sensitivity
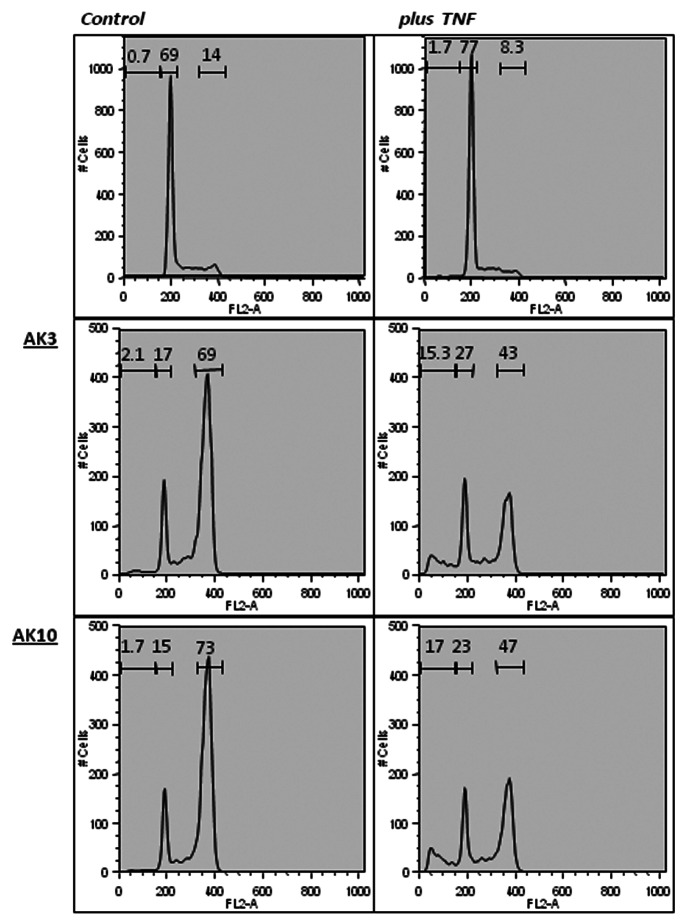
A flow cytometeric analysis of propidium iodide (PI)-stained cells was performed to assess the impact of AK3 and AK10 on the generation of sub-diploid cells. Co-treatment of HT29 cells with either compound in combination with TNF increased the sub-diploid population approximately 10-fold (Fig. 4, right column). Treatment with AK3 or AK10 alone increased the fraction of cells in G2/M phase to approximately 70% (Fig. 4). Interestingly, TNF caused a drop in the G2/M population that corresponded with the increased appearance of sub-diploid cells, suggesting that the G2/M cells were the cells targeted for apoptosis.
Figure 4. AK3 and AK10 induce a G2/M arrest on their own and sub-diploid cell fragments in the presence of TNF. HT29 cells treated with AK3 or AK10 in the presence or absence of TNF were analyzed for DNA content by propidium iodide staining. Flow cytometric analysis of AK3 and AK10 treated cells showed a shift from G1 to G2/M. In the presence of TNF alone, little change in the flow cytometer pattern is observed. Combining TNF with AK3 and AK10 showed a decrease in the G2/M peak and the appearance of a sub-diploid population.
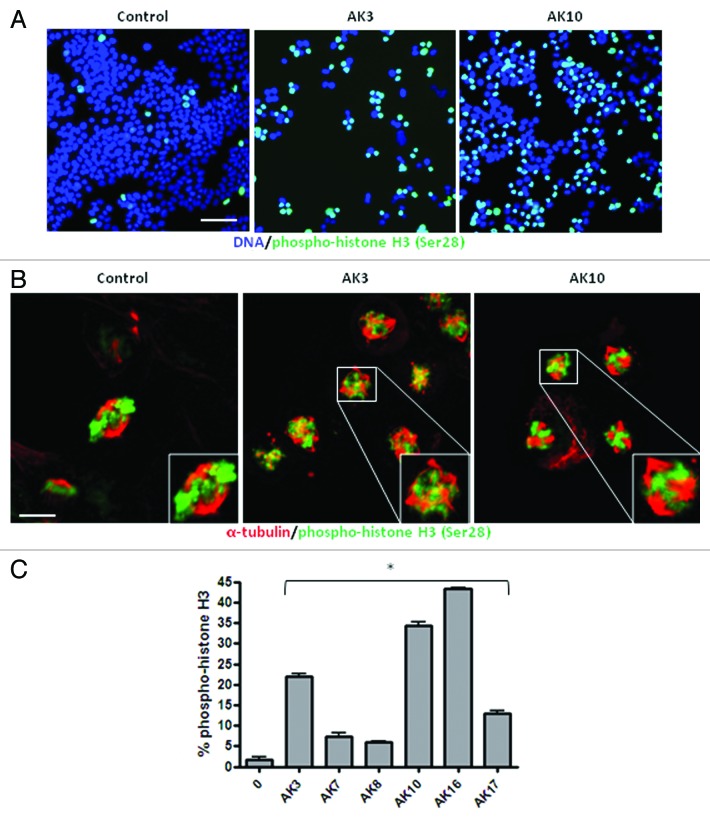
To determine if AK3 and AK10 induced a G2 or M phase arrest, immunofluorescent staining for the mitosis marker phospho-histone H3 Ser28 was performed.32,33 As shown in Figure 5A, both compounds induced a high level of phospho-histone H3 staining, consistent with a mitotic arrest (Fig. 5A). Confocal analysis of the arrested cells showed similar mitotic structures induced by the compounds: in both cases, chromatin was condensed, but there was no congression of the chromosomes on the metaphase plate (Fig. 5B). In addition, there were indications of mitotic spindle assembly, with apparent multiple microtubule organizing centers (Fig. 5B). Other compounds identified in the screen likewise generated a mitotic arrest, as determined by enhanced histone H3 phosphorylation (Fig. 5C). The induction of a mitotic arrest therefore appears to be a common mechanism for TNF sensitization.
Figure 5. AK3 and AK10 induce prophase arrest with the appearance of multiple microtubule organizing centers (MTOCs). (A) HT29 cells treated with AK3 or AK10 were fixed and stained for phospho-histone H3 Serine 28, a marker for chromatin condensation during mitosis. Cells were stained and examined at a 20X magnification by epi-fluorescence. Bar, 100 μm. (B) AK3 and AK10 arrest cells in prophase with multiple MTOCs. AK3 or AK10 treated cells were dual stained for phospho-histone H3 (green) and β-tubulin (red) to visualize spindle assembly in arrested cells. Confocal imagining shows prophase arrested cells with spindles arising from multiple poles. Bar, 10 µm. Insets show magnified views of the mitotic cells. (C) Many compounds identified in the screen induce mitotic arrest. HT29 cells were treated with the indicated compounds at 25 μM and stained for phospho-histone H3. Images were captured and histone H3 phosphorylation was quantified for percent staining by ratio imaging with DAPI. Three microscopic fields were evaluated and an ANOVA was used to determine the significance of the differences (p < 0.01).
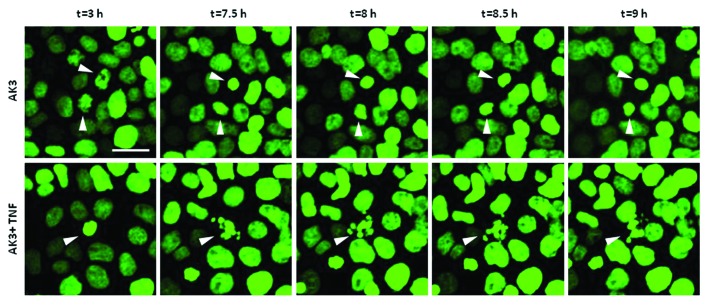
The flow cytometer data suggested that the sub-diploid cells in the co-treated cultures were derived from the arrested M phase population. To address this issue further, time-lapse imaging was performed on HT29 cells expressing a histone H2B-GFP fusion protein. As shown in Figure 6, cells treated with AK3 arrested in mitosis as indicated by the condensation of histone H2B-GFP fluorescence. Moreover, cells displaying condensed chromatin ultimately underwent apoptosis when TNF was present, further supporting the sensitivity of mitotically arrested cells.
Figure 6. Mitotically arrested cells undergo apoptosis. Time lapse imaging of histone H2B-GFP expressed in HT29 cells. Cells were treated with either AK3 (top) or AK3 plus TNF (bottom). Representative images show chromatin condensation in the cells treated with AK3 alone, whereas addition of TNF in combination with AK3 increased apoptosis of the mitotic cells. Bar, 25 μm. Arrows point to the cells undergoing mitosis (top panel and bottom panel, t = 3h) and/or apoptosis (bottom panel).
Effect of AK3 on TNF signaling
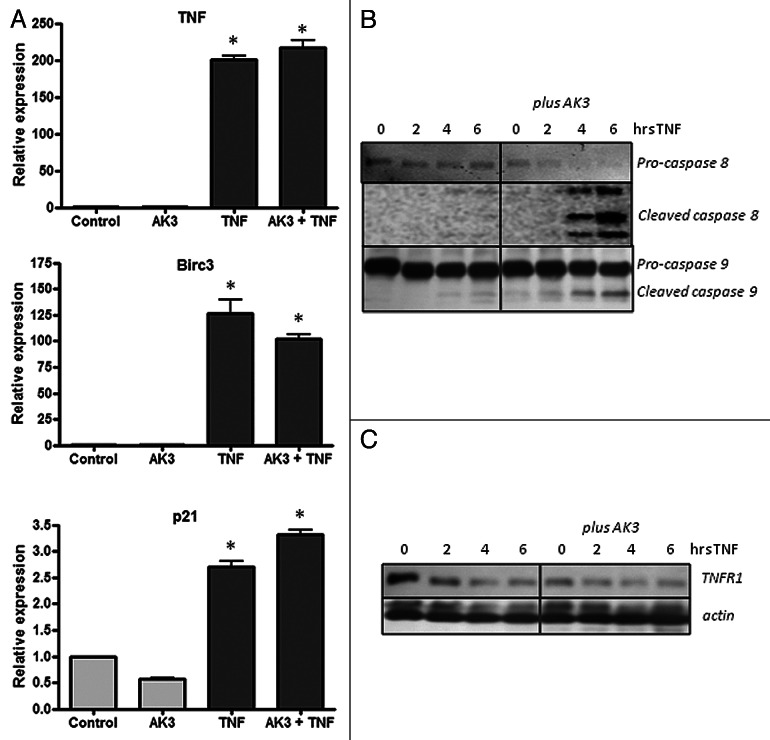
Increased sensitivity to TNF-induced apoptosis could arise from an increased signaling through the proximal initiator caspase-8, through the suppression of the anti-apoptotic NFκB signaling pathways or through a combination of these effects.34-36 To assess the potential contribution of these pathways to sensitization, we determined the effect of AK3 on TNF-induced gene activation and caspase-8 and -9 cleavage. As shown in Figure 7A, gene activation by TNF was largely unaffected by AK3, whereas the activation of the initiator caspases 8 and 9 was increased (Fig. 7B). Cleavage of pro-caspase-8 showed the largest fold change; its cleavage was undetectable in cells treated with TNF or AK3 alone, but nearly complete when cells were treated with TNF and AK3 for 6 h.
Figure 7. Effect of AK3 on gene activation and initiator caspase cleavage by TNF. (A) HT29 cells were treated with AK3, TNF or AK3 plus TNF for 4 h. RNA was isolated, reverse transcribed and quantified for expression of TNF, BIRC3 and p21 by real-time PCR. TNF activated the expression of the three genes tested relative to control cells (ANOVA, p < 0.001), and there was no significant effect of AK3 on this activation. (B) AK3 enhances the TNF induced cleavage of caspase-8 and caspase-9. Cells were treated with TNF for 0, 2, 4 and 6 h in the presence of absence of AK3 and lysates were analyzed by immunoblotting with antibodies against full length and cleaved caspases-8 and 9. (C) Protein samples were analyzed for TNFR1 by immunoblotting. β-Actin was used as the loading control.
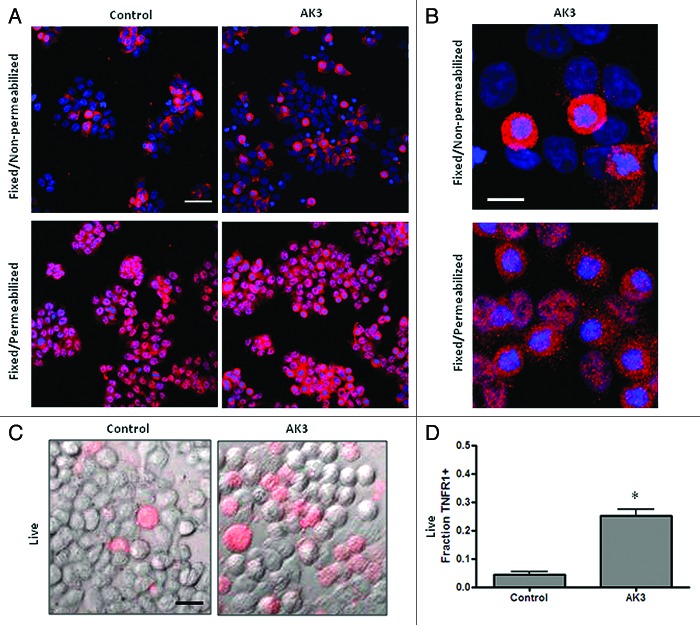
A western blot analysis was performed to determine if AK3 altered the expression of the TNF receptor responsible for caspase-8 activation, TNFR1.37,38 Increased caspase-8 cleavage was not associated with an increased expression of total cellular TNFR1 as determined by western blot analysis (Fig. 7C). In fact, a slight decrease in expression was observed in cells following treatment with AK3 or TNF. To determine whether TNFR1 cellular localization was altered by AK3, cells were examined by immunofluorescent staining. For this experiment, cells were either paraformaldehyde fixed and stained directly for TNFR1 or fixed and permeabilized with Triton X-100 prior to immunostaining. This analysis showed that while permeabilized cells stained uniformly for TNFR1 expression, non-permeabilized cells showed more variable expression (Fig. 8A). We ascribe these changes in staining to changes in the cellular localization of TNFR1, with the staining of non-permeabilized showing receptors expressed at or close to the cell surface. A higher magnification view showed that cells in mitosis frequently displayed more intense staining than interphase cells under non-permeabilized staining conditions (Fig. 8B). To determine the relative level of TNFR1 strictly on the cell surface, cells were transferred to ice and stained directly, without fixation or permeabilization (Fig. 8C). This live cell staining protocol showed a higher level of TNFR1 staining on AK3-treated cells, with the number of cells staining for TNFR1 increased by approximately 5-fold (Fig. 8D). The increased level of cell surface expression of TNFR1 may contribute to the observed increase in TNFinduced caspase-8 activation.
Figure 8. Mitotic cells have a higher surface expression of TNFR1. (A) HT29 cells were treated with AK3 and then fixed with PFA. Fixed cells were either stained directly with a TNFR1 antibody or were stained following permeabilization with Triton X-100. All cells show TNFR1 expression following permeabilization but staining is more variable in the absence of Triton X-100 permeabilization. Bar, 100 μm. (B) Higher magnification of AK3 treated cells stained for TNFR1, with or without permeabilization (as indicated). Mitotic cells with round morphology and condensed chromatin frequently show elevated TNFR1 expression. Bar, 10 μm. (C) Live cells stained for surface expression of TNFR1. HT29 cells were transferred to ice and stained directly for TNFR1 expression. Bar, 25 μm. (D) Quantification of the live cells expressing TNFR1 on the surface. Images were captured and quantified for the number of cells staining with the TNFR1 antibody. Significantly more cells stained for surface expression of TNFR1 after AK3 treatment (p < 0.01; Student’s t test).
Mitosis targeting and TNF sensitivity
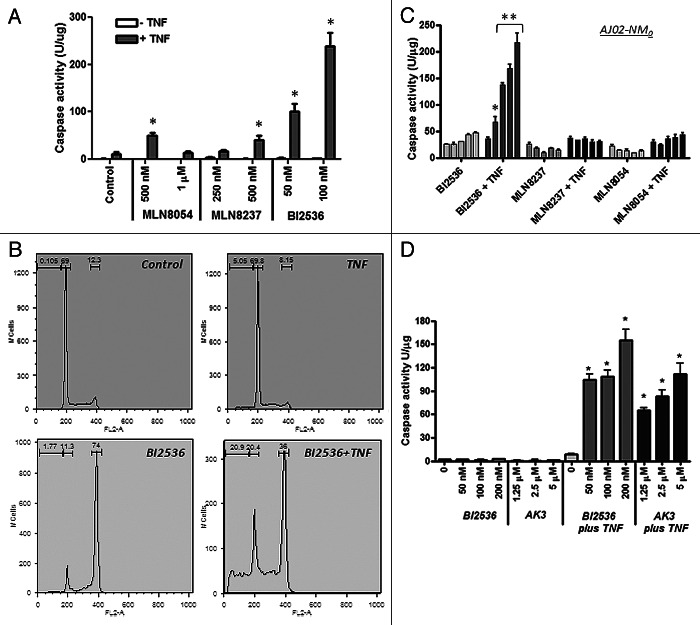
A number of pharmacological agents have been developed that can arrest cells in mitosis. We tested a number of these agents for their ability to enhance TNFinduced caspase activation and apoptosis. As shown in Figure 9A, two Aurora A kinase inhibitors (MLN8054 and MLN8237) and a PLK1 inhibitor (BI2536) were all able to stimulate caspase activation by TNF.39-43 Of these three agents, BI2536 was the most potent for facilitating caspase activation, even though they all induced mitotic arrest in approximately 70% of the cells. Cell cycle analysis of HT29 cells treated with BI2536 in the presence or absence of TNF showed that the BI2536 induced a G2/M arrest in approximately 70% of the cells and that inclusion of TNF with BI2536 increased the sub-diploid population while decreasing the fraction of cells in G2/M arrest (Fig. 9B). This result is consistent with apoptosis in the G2/M phase cells being the primary source of the sub-diploid cells. The AJ02-NM0 mouse colon cancer cell line was likewise sensitized to TNF by BI2536, but less so by the two Aurora kinase inhibitors (Fig. 9C). Figure 9D shows that BI2536 and AK3 induce a comparable level of TNFinduced caspase activity in HT29 cells, making them roughly equivalent in effectiveness. These data indicate that mitotic arrest can sensitize cells to TNF, but the degree of sensitization can vary depending on the mechanism of arrest.
Figure 9. Effect of kinase inhibitors on the TNF sensitivity of colon cancer cells. (A) TNFinduced caspase activation in the presence of MLN8054, MLN8237 (Aurora A kinase inhibitors) and BI2536 (Plk1 inhibitor). HT29 cells were treated with the indicated concentrations of the inhibitors in the presence or absence of TNF and tested for caspase-3 activity using the DEVD-AMC substrate. BI2536 induced a significantly higher level of caspase activation than the Aurora kinase inhibitors (ANOVA, p < 0.01). (B) Cell cycle analysis of HT29 cells treated with BI2536 in the presence or absence of TNF. BI2536 at 100 nM induces a G2/M arrest and, in combination with TNF, causes the appearance of sub-diploid cells. (C) BI2536 enhances TNF-induced apoptosis in the mouse AJ02-NM0 colon cancer cell line more potently than MLN8054 or MLN8237. AJ02-NM0 cells were treated with the inhibitors in the presence or absence of murine TNF and tested for caspase activation using the DEVD-AMC substrate. Inhibitors were used at 0, 125, 250, 500 and 1000 nM (from left to right). BI2536 was a significantly more potent sensitizing agent than the Aurora kinase inhibitors at all concentrations tested (ANOVA; *p < 0.05, ** p < 0.01). (D) AK3 and BI2536 induce comparable levels of caspase activation in HT29 cells in the presence of TNF. Cells were treated with the indicated agents and tested for caspase activation using the DEVD-AMC substrate. AK3 and BI2536 in combination with TNF induced significantly higher caspase activity than either individual treatment (ANOVA; *p < 0.01).
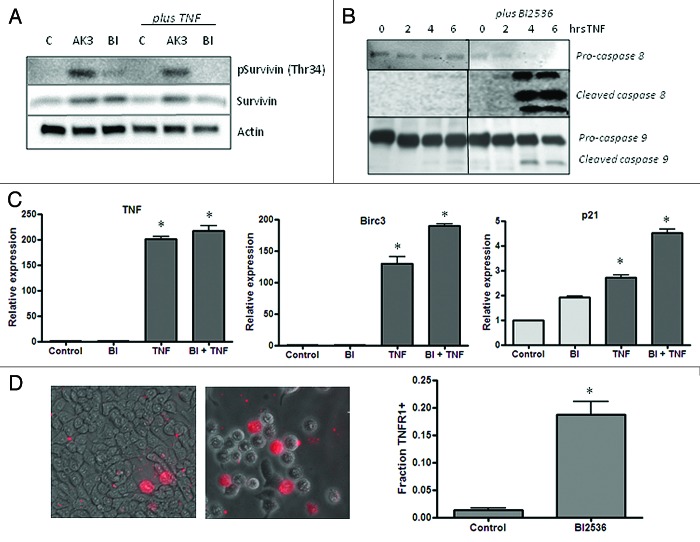
A critical signaling event that occurs during mitosis linked apoptosis is the phosphorylation of the kinetochore-associated passenger protein survivin by Cdk1-Cyclin B.44 Survivin phosphorylation at Thr34 promotes mitotic progression and suppresses apoptosis.44,45 As shown in Figure 10A, AK3 treatment increased survivin phosphorylation, indicating that the cells can proceed past Cdk1 activation in mitosis. Interestingly, cells treated with AK3 and TNF undergo apoptosis even in the face of increased survivin phosphorylation. Figure 10A shows that cells treated with BI2536 have a relatively low level of survivin phosphorylation, which is consistent with its activity as a Plk1 inhibitor, which is upstream of Cdk1-Cyclin B. This analysis is consistent with BI2536 and AK3 arresting mitosis through distinct mechanisms, even though they can both increase sensitivity to TNF. Like AK3, BI2536 enhances caspase-8 and caspase-9 cleavage (Fig. 10B) without reducing the activation of TNF target genes (Fig. 10C). Also like AK3, BI2536 increases the number of cells that express high levels of TNFR1 on their surface, suggesting a possible mechanism of action for cell sensitization with BI2536 (Fig. 10D).
Figure 10.(A) Influence of AK3 and BI2536 on mitosis-dependent survivin phosphorylation. HT29 cells were treated with AK3 or BI2536 in the presence or absence of TNF as indicated. Lysates were analyzed by immunoblotting with antibodies against total survivin and survivin phosphorylated at Thr34. Actin was run as a loading control. (B) Effect of BI2536 on initiator caspase cleavage. HT29 cells were treated with TNF for the indicated times in the presence or absence of BI2536. Cell lysates were prepared and analyzed caspase-8 and caspase-9 cleavage. (C) Effect of BI2536 on gene activation by TNF. HT29 cells were treated with the TNF in the presence or absence of BI2536 as indicated. RNA was extracted at four hours and quantified for expression of TNF, BIRC3 and p21 mRNA by reverse transcription/real time PCR assay using actin as an internal control. The expression levels shown are relative to the untreated control cells. TNF activated the expression of the three genes tested relative to control cells (ANOVA, p < 0.001), but there was no significant effect of BI2536 on this activation. (D) Quantification of the live cells expressing TNFR1 on the surface. Images were captured and quantified for the number of cells staining with the TNFR1 antibody. Significantly more cells stained for surface expression of TNFR1 after BI2536 treatment (p < 0.01; Student’s t test).
Discussion
Colon cancers arise in an inflammatory microenvironment and continue to accommodate elevated levels of infiltrating immune cells as they progress. Although the suppression of inflammation over the long-term is a sensible approach to colon cancer prevention, a complementary approach would be to take advantage of the pro-apoptotic signals associated with an inflammatory response to target transformed cells for apoptosis. A number of natural and pharmacological agents, including NSAIDs, appear to have this ability and have been reported to increase cancer cell sensitivity to TNF, TRAIL or Fas ligand, although it is not clear how this activity functions in cancer prevention.46-50 We and others have reported that HDAC inhibition is particularly effective at increasing colon cancer cell sensitivity to TNF, Fas and TRAIL.47,51 This sensitizing activity may account for the reported ability of SAHA/Vorinostat to selectively enhance apoptosis in AOM-induced colon tumors and suppress their formation and growth.47,52-54 It is not clear, however, whether HDAC inhibitors are ideal for this purpose since they also cause changes in histone acetylation and gene expression systemically.
To better understand the mechanisms by which cancer cells can be sensitized to the inflammatory milieu of a lesion, we screened for compounds that increase TNFinduced apoptosis of colon cancer cells. Of the four hundred compounds screened, two of the agents identified AK3 and AK10, had good potency and were structurally related. Interestingly, these and a number of other compounds identified in the apoptosis screen also induced mitotic arrest, with evidence pointing to a higher apoptotic rate of mitotically arrested cells. A number of pharmacological agents that target mitosis were also found to increase cancer cell sensitivity to TNF, but with varying efficacy. For instance, a Plk1 inhibitor (BI2536) was found to function better than two Aurora kinase A inhibitors (MLN8054 and MLN8237) at sensitizing cancer cells to TNFinduced apoptosis, even though they all enforced comparable degrees of mitotic arrest. Compounds identified in the library screen likewise showed variations in their ability to induce mitotic arrest and sensitize cells to TNF. For example, AK16 was the most potent mitotic arrest agent but not the best sensitizing agent. The reason for this variation in efficiency is not clear. Nonetheless, our data suggest that selected mitotic inhibitors may effectively target neoplastic lesions because of their elevated rate of cell division, their loss of mitotic checkpoints and because they sensitize cancer cells to their inflammatory micro-environment. Whether this approach would be feasible on its own for clearing lesions from the colonic mucosa will require further study.
Mobilization of the immune response, whether through vaccination, immune stimulatory treatments or inflammatory agents, has long been envisioned as an ideal approach to selectively target cancer cells. Tumor cells have been documented to present epitopes that can be recognized as foreign by the immune response and that well-considered stimulants can direct immune cells to neoplastic lesions. Immune stimulants ideally increase the activity of cytotoxic T cells (CTLs), which function through either Fas ligation or release of perforin/granzyme. The Fas system becomes particularly important for targeting cancer cells with weak TCR-epitope complexes.17,18 Since tumors are immune-edited for strongly immunogenic epitopes, enhancing Fas-inducing cell death may be particularly beneficial.55 We found that both AK3 and AK10 can enhance cell death mediated by Fas ligation, suggesting that these or similarly acting agents might increase the effectiveness of CTLs. The induction of a strong Th1 response by immune stimulants also increases the local concentration of a number of characteristic cytokines, including TNF. AK3, AK10 and similarly acting agents might, therefore, facilitate the TNF-induced cell killing to eliminate cells in the lesion that escape direct CTL detection.
In addition to identifying potential drug targets, compound screens can also generate molecular probes useful for identifying and studying critical pathways in cancer progression. In this regard, the results of our compound screen indicate that mitotic regulators may play an important role in helping cancer cells resist death ligands within the inflammatory milieu of a neoplastic lesion. Colon cancer cells have long been noted for altered expression of proteins involved in mitosis. These proteins include components of the centromeres as well as kinases and ubiquitin ligases that regulate mitotic progression.56,57 Proteins in this latter group include Cyclin B, Aurora kinases A and B and CHFR.58-62 CHFR, which regulates entry of cells into prophase is frequently silenced by promoter methylation in colon cancer cells.62 The altered expression of mitotic proteins in colon cancer cells likely contributes to their chromosomal instability. However, these changes are also observed in colon cancer cells with a mutator phenotype that are chromosomally stable. For example, CHFR silencing is frequently associated with MLH1 silencing and a mutator phenotype.63 We propose that the altered expression of mitotic regulators may function in part to facilitate the survival of cells within an inflamed tissue environment. This alteration may occur early in cancer development―it has been reported that Aurora kinase A and Bub1B are overexpressed in preneoplastic mucosa of ulcerative colitis patients.64 Aberrant expression of proteins that promote mitosis may help ensure that cells do not arrest at prophase/prometaphase for a prolonged period of time when they may be more sensitive to ligand-induced apoptosis.
The mechanism linking death ligand sensitization and mitosis is not well understood. We found that mitotic arrest by AK3 showed enhanced cleavage of the initiator caspases 8 and 9. The enhancement of caspase-8 cleavage was, however, more dramatic; little cleavage, if any, was observed when cells were treated singly with TNF or AK3, whereas the combination treatment lead to a near complete cleavage. Since TNFR1 is responsible for directing casapse-8 activation, its expression and cellular localization was analyzed. Although AK3 did not increase the overall expression of TNFR1, it did increase its appearance on the cell surface. These results suggest that AK3 works in part by increasing the level of TNFR1 on the cell surface, which would increase its ability to interact with TNF and form a death inducing complex (either on the cell surface or following endosome incorporation). Arresting cells in mitosis with BI2536, likewise, increased the expression of TNFR1 on the cell surface. It is somewhat counterintuitive that the increased surface expression of TNFR1 would induce caspase-8 cleavage, but not the activation of TNF/NFκB target genes. Although there are a number of explanations for this observation, perhaps the most likely is that TNF also activates the expression of the NFκB inhibitory proteins IκB-α and p105, which establishes a negative feedback loop for TNFinduced gene activation.65 In contrast, caspase-8 activation is characterized by positive feedback loops,66 such that repeated binding and stimulation of the receptor may lead to persistently increasing levels of caspase cleavage and death signaling.
Cell surface expression of TNFR1 on cancer cells was found to be highly variable, even under normal growth conditions. The reason for this high level of variability is not known, but presumably involves alterations in receptor trafficking through different membrane compartments. Relative to interphase cells, mitotic cells displayed elevated levels of TNFR1 surface expression, such that the overall frequency of surface expression was increased by AK3. We hypothesize that cells undergoing mitotic stress due to chromosome or spindle abnormalities display more TNFR1 on their surface to facilitate their elimination from the tissue. This may be an important checkpoint during cancer development. However, unlike other checkpoint pathways, such as those involving increased expression of p16INK4A or p14ARF, this pathway requires that presence of an extracellular death ligand.67 The role of TNFR1 is colon cancer development is consistent with the finding that TNFR1 null mice are more sensitive to tumor formation than wild type animals (in the AOM/DSS model).68 Although the apoptosis rate in normal tissue is not changed in TNFR1 null animals, TNFR1 may reduce cancer risk by inducing apoptosis of rare, genetically damaged cells. The extent to which TNFR1 signaling eliminates damaged and mitotically arrested cells from the tissue remains to be determined. An interesting parallel, however, appears to exist in Drosophila where TNF and TNF receptor homologs Eiger and Wegen, respectively, serve to remove damaged cells from developing epithelial tissues.69
The two most active compounds identified in our screen contain a piperazine core substituted at the nitrogens with a benzoyl group and a phenyl ring. The activity of this structure depends on the specific substituents present on the benzoyl and the phenyl rings, and it is possible that further elaboration of these domains could lead to higher potency compounds. The general structure of AK3 and AK10 does not appear to resemble any present mitotic inhibitor, suggesting that they are a new type of mitotic arresting agent. Although these compounds arrest mitosis at some point after survivin phosphorylation (at the Cdk1-cyclin B target site), the precise nature of this inhibition is not yet known. In vitro tubulin polymerization assays indicate that they do not directly target tubulin (data not shown). Whether these agents or their targets might be useful for the development of new pharmacological agents is not clear. However, understanding their mechanism of action may provide new insight into colon cancer etiology and suggest novel approaches to colon cancer treatment and prevention.
Materials and Methods
Cell culture
The HT29 and HCT 116 colon cancer cell line were obtained from the American Type Culture Collection. These cell lines were cultured in McCoy’s 5A medium with 10% fetal bovine serum, non-essential amino acids and antibiotic/antimycotic (Life Technologies). The AJ02-NM0 cell line was isolated from an AOM-induced tumor from the A/J mouse strain and were cultured in RPMI 1640 with Glutamax (Invitrogen) supplemented with 5% (v/v) fetal bovine serum (Lonza), 5% (v/v) heat-inactivated horse serum, 1% (v/v) insulin-transferrin-selenium (Gibco), 100 mM non-essential amino acids (Invitrogen) and antibiotic–antimycotic (Invitrogen).70 The compounds tested were obtained from the ChemBridge DIVERSetTM library. BI2536, MLN8054 and MLN8237 were obtained from Selleck Chemicals. Drug treatments were performed approximately 24 h after passage for 18 h, unless otherwise indicated. TNF was obtained from Pierce Protein Research Productsand the activating Fas antibody (clone CH11) was purchased from Millipore.
Caspase-3 activity
Caspase activity was determined as previously described.47 Briefly, cells were scraped off into a new tube, centrifuged at full speed in a microcentrifuge at 10,000 × g for 5 min and washed once with PBS. Pelleted cells were lysed by two rounds of freeze-thaw in lysis buffer containing 10 mM TRIS-HCl (pH 7.5), 0.1 M NaCl, 1 mM EDTA and 0.01% Triton X-100 and centrifuged at 10,000 × g for 5 min. The assays were performed on 96 well plates by mixing 50 ml of cell lysis supernatant with 50 ml of 2 × reaction mix (10 mM PIPES (pH 7.4), 2 mM EDTA, 0.1% CHAPS, 10 mM DTT) containing 200 nM of the fluorogenic substrate Acetyl-Asp-Glu-Val-Asp-7-Amino-4-methylcoumarin (DEVD-AMC; Enzo Life Sciences). The fluorescence was quantified using a microplate reader (excitation/emission 360/460 nm) at the start of the reaction and after 30 min. Protein concentrations were determined using CBQCA Protein Quantification Kit (Life Technologies). Caspase activity was determined by dividing the change in fluorescence after 1 h by the total protein content of the reaction mixture.
Immunoflurorescence microscopy
Treated cells cultured on coverslips were fixed with 4% paraformaldehyde or methanol and then permeabilized with 0.5% Triton X-100 in PBS. Cells were blocked in 5% serum (in PBS) and then incubated for 1 h at room temperature on the shaker with the primary antibody (in 5% serum) against cleaved caspase-3 (#9961, Cell Signaling Technology), phospho-histone H3 Ser 28 (sc-12927, Santa Cruz Biotechnology) or β-tubulin (E7 monoclonal antibody, Developmental Studies Hybridoma Bank). TNFR1 antibody (H-5, Santa Cruz Biotechnology) incubation was performed overnight at 4°C. Appropriate secondary antibodies (Jackson ImmunoResearch) were used for 45 min incubation. Nuclei were visualized using DAPI (5 mg/ml in H2O) (D1306, Life Technologies). Coverslips were mounted on slides using ProLong® Gold AntiFade Reagent (Life Technologies). Images were acquired using Nikon A1R Confocal Microscope (v. 2.11) and NIS-Elements Advanced Research Software (version 3.2). Quantification of immunostaining was performed using ImageJ image analysis software (http://rsb.info.nih.gov/ij/) as previously described.71 Following background subtraction, both DAPI and immunofluorescent images were converted to binary using the convert to mask function. To remove any false positive signal, a binary image of the colocalized points was generated using the colocalization plugin of Bourdoncle (http://rsbweb.nih.gov/ij/plugins/colocalization.html). The integrated densities of the total area of the colocalized binary image and the corresponding DAPI image were then measured to generate staining index.
Time lapse imaging
HT29 cells stably expressing histone H2B-GFP were used for live cell imaging. Images were taken with Nikon A1R Confocal Microscope every 16 min as Z-stacks of 30 images, each 1 μm apart. Images were restacked using Fiji/ImageJ (National Institute of Health).
Flow cytometry
HT29 and HCT116 cells were analyzed for DNA content by ethanol fixation and staining with propidium iodide as previously described.72 Floating and adherent cells were combined and analyzed by flow cytometry. Adherent cells were harvested using a trypsin-EDTA solution, centrifuged together with the floating cells at 100 × g for 5 min and resuspended in 1 ml of cold saline GM. Cells were then fixed by adding 3 ml of cold 100% ethanol while gently vortexing and stored at -20°C for at least 2 h. Cells were then pelleted and washed once with PBS containing 5 mM EDTA. Pelleted cells were stained with 30 μg/ml propidium iodide (Sigma-Aldrich) and 0.3 mg/ml RNase A in 1 ml PBS solution for 1 h in the dark at RT. The stained cells were filtered prior to analysis on FACSCalibur flow cytometer (BD Biosciences) using Cell Quest software (BD Biosciences). The data were analyzed using FlowJo (TreeStar Inc.).
Western blot
RIPA buffer was employed for protein extraction and 30 μg of protein was denatured under reducing conditions.49,73 Proteins were separated on 4–20% gradient gels (Bio-Rad) and transferred to nitrocellulose by voltage gradient transfer. The resulting blots were blocked with 5% (w/v) non-fat dry milk in PBS + 0.1% (v/v) Tween-20. Specific proteins were detected with appropriate antibodies using enhanced chemiluminescence detection (Santa Cruz Biotechnology) as recommended by the manufacturer. Immunoblotting antibodies were survivin (71G4B7, Cell Signaling Technology), phospho-survivin (Thr34) (D2E11, Cell Signaling Technology), cleaved caspase-8 (18C8, Cell Signaling), caspase-9 (human specific, Cell Signaling), pro-caspase-8 (8CASP03, Santa Cruz Biotechnology), TNFR1 (H-5, Santa Cruz Biotechnology) and β-actin antibody (I-19, Santa Cruz Biotechnology).
RNA quantification
Total RNA extraction was performed using Trizol reagent (Life Technologies) following the manufacture’s instruction. RNA was quantified by reverse transcription and quantitative PCR analysis using Taqman reagents (Life Technologies), as previously described.73
Compound synthesis
Starting from commercially available tert-Butyl piperazine-1-carboxylate, a Buchwald coupling (palladium cross coupling reaction between an amine and an aryl halide) was performed to append the dimethylbenzene ring to the free amine. Deprotection of the carbamate was achieved using 20% HCl in methanol. Subsequent amidation using triethylamine and various acyl chlorides yielded the final compounds that were tested after purification by column chromatography and structure validation using proton and carbon NMR.
Statistics
A Student’s t-test was used for comparing two treatment groups. An analysis of variance test (ANOVA) when comparing more than two groups. A Tukey’s post-hoc test was employed to determine the significance of differences between multiple groups, with p < 0.05 considered significant.
Supplementary Material
Acknowledgments
This work was supported by NIH grant R21CA125592 to C.G. We also thank Carol Norris at the University of Connecticut Flow Cytometry and Confocal Microscopy Facility for her help in confocal imaging and flow cytometry.
Glossary
Abbreviations:
- ulcerative colitis
UC
- nonsteroidal anti-inflammatory drugs
NSAIDs
- tumor necrosis factor
TNF
- TNF receptor 1
TNFR1
- green fluorescent protein
GFP
- histone deacetylase
HDAC
- polo like kinase 1
PLK1
- granulocyte-macrophage colony-stimulating factor
GM-CSF
- Acetyl-Asp-Glu-Val-Asp-7-Amino-4-methylcoumarin
DEVD-AMC
- propidium iodide
PI
- T cell receptor
TCR
- cytotoxic T cell
CTL
- major histocompatibility complex
MHC
- 5-aminosalicylic acid
5-ASA
- checkpoint with forkhead and ring finger domains
CHFR
- azoxymethane
AOM
- dextran sulfate sodium
DSS
- IAP
inhibitor of apoptosis
Disclosure of Potential Conflicts of Interest
The authors declare no conflict of interest.
Footnotes
Previously published online: www.landesbioscience.com/journals/cbt/article/23787
References
- 1.Ikeda I, Tomimoto A, Wada K, Fujisawa T, Fujita K, Yonemitsu K, et al. 5-aminosalicylic acid given in the remission stage of colitis suppresses colitis-associated cancer in a mouse colitis model. Clin Cancer Res. 2007;13:6527–31. doi: 10.1158/1078-0432.CCR-07-1208. [DOI] [PubMed] [Google Scholar]
- 2.Lukas M. Inflammatory bowel disease as a risk factor for colorectal cancer. Dig Dis. 2010;28:619–24. doi: 10.1159/000320276. [DOI] [PubMed] [Google Scholar]
- 3.Din FV, Theodoratou E, Farrington SM, Tenesa A, Barnetson RA, Cetnarskyj R, et al. Effect of aspirin and NSAIDs on risk and survival from colorectal cancer. Gut. 2010;59:1670–9. doi: 10.1136/gut.2009.203000. [DOI] [PubMed] [Google Scholar]
- 4.Allison M, Garland C, Chlebowski R, Criqui M, Langer R, Wu L, et al. Women’s Health Initiative Investigators The association between aspirin use and the incidence of colorectal cancer in women. Am J Epidemiol. 2006;164:567–75. doi: 10.1093/aje/kwj250. [DOI] [PubMed] [Google Scholar]
- 5.Arber N, DuBois RN. Nonsteroidal anti-inflammatory drugs and prevention of colorectal cancer. Curr Gastroenterol Rep. 1999;1:441–8. doi: 10.1007/s11894-999-0027-1. [DOI] [PubMed] [Google Scholar]
- 6.Klampfer L. Cytokines, inflammation and colon cancer. Curr Cancer Drug Targets. 2011;11:451–64. doi: 10.2174/156800911795538066. [DOI] [PMC free article] [PubMed] [Google Scholar]
- 7.Terzic J, Grivennikov S, Karin E,Karin M. Inflammation and colon cancer. Gastroenterology 2010: 138:2101-2114 e2105. [DOI] [PubMed]
- 8.Luo JL, Maeda S, Hsu LC, Yagita H, Karin M. Inhibition of NF-kappaB in cancer cells converts inflammation- induced tumor growth mediated by TNFalpha to TRAIL-mediated tumor regression. Cancer Cell. 2004;6:297–305. doi: 10.1016/j.ccr.2004.08.012. [DOI] [PubMed] [Google Scholar]
- 9.Cammarota R, Bertolini V, Pennesi G, Bucci EO, Gottardi O, Garlanda C, et al. The tumor microenvironment of colorectal cancer: stromal TLR-4 expression as a potential prognostic marker. J Transl Med. 2010;8:112. doi: 10.1186/1479-5876-8-112. [DOI] [PMC free article] [PubMed] [Google Scholar]
- 10.Numata A, Minagawa T, Asano M, Nakane A, Katoh H, Tanabe T. Functional evaluation of tumor-infiltrating mononuclear cells. Detection of endogenous interferon-gamma and tumor necrosis factor-alpha in human colorectal adenocarcinomas. Cancer. 1991;68:1937–43. doi: 10.1002/1097-0142(19911101)68:9<1937::AID-CNCR2820680916>3.0.CO;2-D. [DOI] [PubMed] [Google Scholar]
- 11.Tudek B, Speina E. Oxidatively damaged DNA and its repair in colon carcinogenesis. Mutat Res. 2012;736:82–92. doi: 10.1016/j.mrfmmm.2012.04.003. [DOI] [PubMed] [Google Scholar]
- 12.Kawanishi S, Hiraku Y, Pinlaor S, Ma N. Oxidative and nitrative DNA damage in animals and patients with inflammatory diseases in relation to inflammation-related carcinogenesis. Biol Chem. 2006;387:365–72. doi: 10.1515/BC.2006.049. [DOI] [PubMed] [Google Scholar]
- 13.Dalgleish AG, O’Byrne K. Inflammation and cancer: the role of the immune response and angiogenesis. Cancer Treat Res. 2006;130:1–38. doi: 10.1007/0-387-26283-0_1. [DOI] [PubMed] [Google Scholar]
- 14.Nakanishi M, Rosenberg DW. Multifaceted roles of PGE(2) in inflammation and cancer. Semin Immunopathol. 2012 doi: 10.1007/s00281-012-0342-8. [DOI] [PMC free article] [PubMed] [Google Scholar]
- 15.Suzuki H, Graziano DF, McKolanis J, Finn OJ. T cell-dependent antibody responses against aberrantly expressed cyclin B1 protein in patients with cancer and premalignant disease. Clin Cancer Res. 2005;11:1521–6. doi: 10.1158/1078-0432.CCR-04-0538. [DOI] [PubMed] [Google Scholar]
- 16.Silk AW, Schoen RE, Potter DM, Finn OJ. Humoral immune response to abnormal MUC1 in subjects with colorectal adenoma and cancer. Mol Immunol. 2009;47:52–6. doi: 10.1016/j.molimm.2008.12.025. [DOI] [PMC free article] [PubMed] [Google Scholar]
- 17.Dunn GP, Old LJ, Schreiber RD. The three Es of cancer immunoediting. Annu Rev Immunol. 2004;22:329–60. doi: 10.1146/annurev.immunol.22.012703.104803. [DOI] [PubMed] [Google Scholar]
- 18.Dunn GP, Bruce AT, Ikeda H, Old LJ, Schreiber RD. Cancer immunoediting: from immunosurveillance to tumor escape. Nat Immunol. 2002;3:991–8. doi: 10.1038/ni1102-991. [DOI] [PubMed] [Google Scholar]
- 19.de Visser KE, Eichten A, Coussens LM. Paradoxical roles of the immune system during cancer development. Nat Rev Cancer. 2006;6:24–37. doi: 10.1038/nrc1782. [DOI] [PubMed] [Google Scholar]
- 20.Funada Y, Noguchi T, Kikuchi R, Takeno S, Uchida Y, Gabbert HE. Prognostic significance of CD8+ T cell and macrophage peritumoral infiltration in colorectal cancer. Oncol Rep. 2003;10:309–13. [PubMed] [Google Scholar]
- 21.Correale P, Tagliaferri P, Fioravanti A, Del Vecchio MT, Remondo C, Montagnani F, et al. Immunity feedback and clinical outcome in colon cancer patients undergoing chemoimmunotherapy with gemcitabine + FOLFOX followed by subcutaneous granulocyte macrophage colony-stimulating factor and aldesleukin (GOLFIG-1 Trial) Clin Cancer Res. 2008;14:4192–9. doi: 10.1158/1078-0432.CCR-07-5278. [DOI] [PubMed] [Google Scholar]
- 22.Correale P, Cusi MG, Tsang KY, Del Vecchio MT, Marsili S, Placa ML, et al. Chemo-immunotherapy of metastatic colorectal carcinoma with gemcitabine plus FOLFOX 4 followed by subcutaneous granulocyte macrophage colony-stimulating factor and interleukin-2 induces strong immunologic and antitumor activity in metastatic colon cancer patients. J Clin Oncol. 2005;23:8950–8. doi: 10.1200/JCO.2005.12.147. [DOI] [PubMed] [Google Scholar]
- 23.Berraondo P, Umansky V, Melero I. Changing the tumor microenvironment: new strategies for immunotherapy. Cancer Res. 2012;72:5159–64. doi: 10.1158/0008-5472.CAN-12-1952. [DOI] [PubMed] [Google Scholar]
- 24.Medina-Echeverz J, Fioravanti J, Zabala M, Ardaiz N, Prieto J, Berraondo P. Successful colon cancer eradication after chemoimmunotherapy is associated with profound phenotypic change of intratumoral myeloid cells. J Immunol. 2011;186:807–15. doi: 10.4049/jimmunol.1001483. [DOI] [PubMed] [Google Scholar]
- 25.Medina-Echeverz J, Berraondo P. Colon cancer eradication after chemoimmunotherapy is associated with intratumoral emergence of proinflammatory myeloid cells. Oncoimmunology. 2012;1:118–20. doi: 10.4161/onci.1.1.18049. [DOI] [PMC free article] [PubMed] [Google Scholar]
- 26.Warabi M, Kitagawa M, Hirokawa K. Loss of MHC class II expression is associated with a decrease of tumor-infiltrating T cells and an increase of metastatic potential of colorectal cancer: immunohistological and histopathological analyses as compared with normal colonic mucosa and adenomas. Pathol Res Pract. 2000;196:807–15. doi: 10.1016/S0344-0338(00)80080-1. [DOI] [PubMed] [Google Scholar]
- 27.Goepel JR, Rees RC, Rogers K, Stoddard CJ, Thomas WE, Shepherd L. Loss of monomorphic and polymorphic HLA antigens in metastatic breast and colon carcinoma. Br J Cancer. 1991;64:880–3. doi: 10.1038/bjc.1991.418. [DOI] [PMC free article] [PubMed] [Google Scholar]
- 28.Garrido F, Ruiz-Cabello F. MHC expression on human tumors--its relevance for local tumor growth and metastasis. Semin Cancer Biol. 1991;2:3–10. [PubMed] [Google Scholar]
- 29.Altieri DC. Survivin and IAP proteins in cell-death mechanisms. Biochem J. 2010;430:199–205. doi: 10.1042/BJ20100814. [DOI] [PMC free article] [PubMed] [Google Scholar]
- 30.Salz W, Eisenberg D, Plescia J, Garlick DS, Weiss RM, Wu XR, et al. A survivin gene signature predicts aggressive tumor behavior. Cancer Res. 2005;65:3531–4. doi: 10.1158/0008-5472.CAN-04-4284. [DOI] [PubMed] [Google Scholar]
- 31.Belinsky GS, Claffey KP, Nambiar PR, Guda K, Rosenberg DW. Vascular endothelial growth factor and enhanced angiogenesis do not promote metastatic conversion of a newly established azoxymethane-induced colon cancer cell line. Mol Carcinog. 2005;43:65–74. doi: 10.1002/mc.20079. [DOI] [PubMed] [Google Scholar]
- 32.Pérez-Cadahía B, Drobic B, Davie JR. H3 phosphorylation: dual role in mitosis and interphase. Biochem Cell Biol. 2009;87:695–709. doi: 10.1139/O09-053. [DOI] [PubMed] [Google Scholar]
- 33.Goto H, Yasui Y, Nigg EA, Inagaki M. Aurora-B phosphorylates Histone H3 at serine28 with regard to the mitotic chromosome condensation. Genes Cells. 2002;7:11–7. doi: 10.1046/j.1356-9597.2001.00498.x. [DOI] [PubMed] [Google Scholar]
- 34.Van Antwerp DJ, Martin SJ, Kafri T, Green DR, Verma IM. Suppression of TNF-alpha-induced apoptosis by NF-kappaB. Science. 1996;274:787–9. doi: 10.1126/science.274.5288.787. [DOI] [PubMed] [Google Scholar]
- 35.Wang CY, Mayo MW, Baldwin AS., Jr. TNF- and cancer therapy-induced apoptosis: potentiation by inhibition of NF-kappaB. Science. 1996;274:784–7. doi: 10.1126/science.274.5288.784. [DOI] [PubMed] [Google Scholar]
- 36.Beg AA, Sha WC, Bronson RT, Ghosh S, Baltimore D. Embryonic lethality and liver degeneration in mice lacking the RelA component of NF-kappa B. Nature. 1995;376:167–70. doi: 10.1038/376167a0. [DOI] [PubMed] [Google Scholar]
- 37.Bertin J, Armstrong RC, Ottilie S, Martin DA, Wang Y, Banks S, et al. Death effector domain-containing herpesvirus and poxvirus proteins inhibit both Fas- and TNFR1-induced apoptosis. Proc Natl Acad Sci U S A. 1997;94:1172–6. doi: 10.1073/pnas.94.4.1172. [DOI] [PMC free article] [PubMed] [Google Scholar]
- 38.Muzio M, Salvesen GS, Dixit VM. FLICE induced apoptosis in a cell-free system. Cleavage of caspase zymogens. J Biol Chem. 1997;272:2952–6. doi: 10.1074/jbc.272.5.2952. [DOI] [PubMed] [Google Scholar]
- 39.Manfredi MG, Ecsedy JA, Meetze KA, Balani SK, Burenkova O, Chen W, et al. Antitumor activity of MLN8054, an orally active small-molecule inhibitor of Aurora A kinase. Proc Natl Acad Sci U S A. 2007;104:4106–11. doi: 10.1073/pnas.0608798104. [DOI] [PMC free article] [PubMed] [Google Scholar]
- 40.Görgün G, Calabrese E, Hideshima T, Ecsedy J, Perrone G, Mani M, et al. A novel Aurora-A kinase inhibitor MLN8237 induces cytotoxicity and cell-cycle arrest in multiple myeloma. Blood. 2010;115:5202–13. doi: 10.1182/blood-2009-12-259523. [DOI] [PMC free article] [PubMed] [Google Scholar]
- 41.Tomita M, Mori N. Aurora A selective inhibitor MLN8237 suppresses the growth and survival of HTLV-1-infected T-cells in vitro. Cancer Sci. 2010;101:1204–11. doi: 10.1111/j.1349-7006.2010.01499.x. [DOI] [PMC free article] [PubMed] [Google Scholar]
- 42.Lénárt P, Petronczki M, Steegmaier M, Di Fiore B, Lipp JJ, Hoffmann M, et al. The small-molecule inhibitor BI 2536 reveals novel insights into mitotic roles of polo-like kinase 1. Curr Biol. 2007;17:304–15. doi: 10.1016/j.cub.2006.12.046. [DOI] [PubMed] [Google Scholar]
- 43.Steegmaier M, Hoffmann M, Baum A, Lénárt P, Petronczki M, Krssák M, et al. BI 2536, a potent and selective inhibitor of polo-like kinase 1, inhibits tumor growth in vivo. Curr Biol. 2007;17:316–22. doi: 10.1016/j.cub.2006.12.037. [DOI] [PubMed] [Google Scholar]
- 44.O’Connor DS, Grossman D, Plescia J, Li F, Zhang H, Villa A, et al. Regulation of apoptosis at cell division by p34cdc2 phosphorylation of survivin. Proc Natl Acad Sci U S A. 2000;97:13103–7. doi: 10.1073/pnas.240390697. [DOI] [PMC free article] [PubMed] [Google Scholar]
- 45.Barrett RM, Osborne TP, Wheatley SP. Phosphorylation of survivin at threonine 34 inhibits its mitotic function and enhances its cytoprotective activity. Cell Cycle. 2009;8:278–83. doi: 10.4161/cc.8.2.7587. [DOI] [PubMed] [Google Scholar]
- 46.Chan TA, Morin PJ, Vogelstein B, Kinzler KW. Mechanisms underlying nonsteroidal antiinflammatory drug-mediated apoptosis. Proc Natl Acad Sci U S A. 1998;95:681–6. doi: 10.1073/pnas.95.2.681. [DOI] [PMC free article] [PubMed] [Google Scholar]
- 47.Kuratnik A, Senapati VE, Verma R, Mellone BG, Vella AT, Giardina C. Acute sensitization of colon cancer cells to inflammatory cytokines by prophase arrest. Biochem Pharmacol. 2012;83:1217–28. doi: 10.1016/j.bcp.2012.01.024. [DOI] [PMC free article] [PubMed] [Google Scholar]
- 48.Yin L, Laevsky G, Giardina C. Butyrate suppression of colonocyte NF-kappa B activation and cellular proteasome activity. J Biol Chem. 2001;276:44641–6. doi: 10.1074/jbc.M105170200. [DOI] [PubMed] [Google Scholar]
- 49.Inan MS, Rasoulpour RJ, Yin L, Hubbard AK, Rosenberg DW, Giardina C. The luminal short-chain fatty acid butyrate modulates NF-kappaB activity in a human colonic epithelial cell line. Gastroenterology. 2000;118:724–34. doi: 10.1016/S0016-5085(00)70142-9. [DOI] [PubMed] [Google Scholar]
- 50.Giardina C, Boulares H, Inan MS. NSAIDs and butyrate sensitize a human colorectal cancer cell line to TNF-alpha and Fas ligation: the role of reactive oxygen species. Biochim Biophys Acta. 1999;1448:425–38. doi: 10.1016/S0167-4889(98)00156-6. [DOI] [PubMed] [Google Scholar]
- 51.Kaler P, Sasazuki T, Shirasawa S, Augenlicht L, Klampfer L. HDAC2 deficiency sensitizes colon cancer cells to TNFalpha-induced apoptosis through inhibition of NF-kappaB activity. Exp Cell Res. 2008;314:1507–18. doi: 10.1016/j.yexcr.2008.01.010. [DOI] [PubMed] [Google Scholar]
- 52.Glauben R, Siegmund B. Inhibition of histone deacetylases in inflammatory bowel diseases. Mol Med. 2011;17:426–33. doi: 10.2119/molmed.2011.00069. [DOI] [PMC free article] [PubMed] [Google Scholar]
- 53.Glauben R, Sonnenberg E, Zeitz M, Siegmund B. HDAC inhibitors in models of inflammation-related tumorigenesis. Cancer Lett. 2009;280:154–9. doi: 10.1016/j.canlet.2008.11.019. [DOI] [PubMed] [Google Scholar]
- 54.Glauben R, Batra A, Stroh T, Erben U, Fedke I, Lehr HA, et al. Histone deacetylases: novel targets for prevention of colitis-associated cancer in mice. Gut. 2008;57:613–22. doi: 10.1136/gut.2007.134650. [DOI] [PubMed] [Google Scholar]
- 55.Shanker A, Brooks AD, Jacobsen KM, Wine JW, Wiltrout RH, Yagita H, et al. Antigen presented by tumors in vivo determines the nature of CD8+ T-cell cytotoxicity. Cancer Res. 2009;69:6615–23. doi: 10.1158/0008-5472.CAN-09-0685. [DOI] [PMC free article] [PubMed] [Google Scholar]
- 56.Tomonaga T, Matsushita K, Ishibashi M, Nezu M, Shimada H, Ochiai T, et al. Centromere protein H is up-regulated in primary human colorectal cancer and its overexpression induces aneuploidy. Cancer Res. 2005;65:4683–9. doi: 10.1158/0008-5472.CAN-04-3613. [DOI] [PubMed] [Google Scholar]
- 57.Tomonaga T, Matsushita K, Yamaguchi S, Oohashi T, Shimada H, Ochiai T, et al. Overexpression and mistargeting of centromere protein-A in human primary colorectal cancer. Cancer Res. 2003;63:3511–6. [PubMed] [Google Scholar]
- 58.Wang A, Yoshimi N, Ino N, Tanaka T, Mori H. Overexpression of cyclin B1 in human colorectal cancers. J Cancer Res Clin Oncol. 1997;123:124–7. doi: 10.1007/BF01269891. [DOI] [PMC free article] [PubMed] [Google Scholar]
- 59.Baba Y, Nosho K, Shima K, Irahara N, Kure S, Toyoda S, et al. Aurora-A expression is independently associated with chromosomal instability in colorectal cancer. Neoplasia. 2009;11:418–25. doi: 10.1593/neo.09154. [DOI] [PMC free article] [PubMed] [Google Scholar]
- 60.Takahashi T, Sano B, Nagata T, Kato H, Sugiyama Y, Kunieda K, et al. Polo-like kinase 1 (PLK1) is overexpressed in primary colorectal cancers. Cancer Sci. 2003;94:148–52. doi: 10.1111/j.1349-7006.2003.tb01411.x. [DOI] [PMC free article] [PubMed] [Google Scholar]
- 61.Ota T, Suto S, Katayama H, Han ZB, Suzuki F, Maeda M, et al. Increased mitotic phosphorylation of histone H3 attributable to AIM-1/Aurora-B overexpression contributes to chromosome number instability. Cancer Res. 2002;62:5168–77. [PubMed] [Google Scholar]
- 62.Corn PG, Summers MK, Fogt F, Virmani AK, Gazdar AF, Halazonetis TD, et al. Frequent hypermethylation of the 5′ CpG island of the mitotic stress checkpoint gene Chfr in colorectal and non-small cell lung cancer. Carcinogenesis. 2003;24:47–51. doi: 10.1093/carcin/24.1.47. [DOI] [PubMed] [Google Scholar]
- 63.Brandes JC, van Engeland M, Wouters KA, Weijenberg MP, Herman JG. CHFR promoter hypermethylation in colon cancer correlates with the microsatellite instability phenotype. Carcinogenesis. 2005;26:1152–6. doi: 10.1093/carcin/bgi058. [DOI] [PubMed] [Google Scholar]
- 64.Burum-Auensen E, Deangelis PM, Schjølberg AR, Røislien J, Andersen SN, Clausen OP. Spindle proteins Aurora A and BUB1B, but not Mad2, are aberrantly expressed in dysplastic mucosa of patients with longstanding ulcerative colitis. J Clin Pathol. 2007;60:1403–8. doi: 10.1136/jcp.2006.044305. [DOI] [PMC free article] [PubMed] [Google Scholar]
- 65.Baldwin AS., Jr. The NF-kappa B and I kappa B proteins: new discoveries and insights. Annu Rev Immunol. 1996;14:649–83. doi: 10.1146/annurev.immunol.14.1.649. [DOI] [PubMed] [Google Scholar]
- 66.Boatright KM, Salvesen GS. Mechanisms of caspase activation. Curr Opin Cell Biol. 2003;15:725–31. doi: 10.1016/j.ceb.2003.10.009. [DOI] [PubMed] [Google Scholar]
- 67.Sherr CJ. Cancer cell cycles. Science. 1996;274:1672–7. doi: 10.1126/science.274.5293.1672. [DOI] [PubMed] [Google Scholar]
- 68.Chang F, Lacey MR, Bouljihad M, Höner Zu Bentrup K, Fortgang IS. Tumor necrosis factor receptor 1 functions as a tumor suppressor. Am J Physiol Gastrointest Liver Physiol. 2012;302:G195–206. doi: 10.1152/ajpgi.00209.2011. [DOI] [PMC free article] [PubMed] [Google Scholar]
- 69.Igaki T, Pastor-Pareja JC, Aonuma H, Miura M, Xu T. Intrinsic tumor suppression and epithelial maintenance by endocytic activation of Eiger/TNF signaling in Drosophila. Dev Cell. 2009;16:458–65. doi: 10.1016/j.devcel.2009.01.002. [DOI] [PMC free article] [PubMed] [Google Scholar]
- 70.Belinsky GS, Parke AL, Huang Q, Blanchard K, Jayadev S, Stoll R, et al. The contribution of methotrexate exposure and host factors on transcriptional variance in human liver. Toxicol Sci. 2007;97:582–94. doi: 10.1093/toxsci/kfm067. [DOI] [PubMed] [Google Scholar]
- 71.Rigatti MJ, Verma R, Belinsky GS, Rosenberg DW, Giardina C. Pharmacological inhibition of Mdm2 triggers growth arrest and promotes DNA breakage in mouse colon tumors and human colon cancer cells. Mol Carcinog. 2012;51:363–78. doi: 10.1002/mc.20795. [DOI] [PMC free article] [PubMed] [Google Scholar]
- 72.Verma R, Rigatti MJ, Belinsky GS, Godman CA, Giardina C. DNA damage response to the Mdm2 inhibitor nutlin-3. Biochem Pharmacol. 2010;79:565–74. doi: 10.1016/j.bcp.2009.09.020. [DOI] [PMC free article] [PubMed] [Google Scholar]
- 73.Godman CA, Joshi R, Tierney BR, Greenspan E, Rasmussen TP, Wang HW, et al. HDAC3 impacts multiple oncogenic pathways in colon cancer cells with effects on Wnt and vitamin D signaling. Cancer Biol Ther. 2008;7:1570–80. doi: 10.4161/cbt.7.10.6561. [DOI] [PMC free article] [PubMed] [Google Scholar]
Associated Data
This section collects any data citations, data availability statements, or supplementary materials included in this article.


