Abstract
Nonlinear optical microscopy, based on femtosecond laser spectral reshaping, characterized and imaged graphene samples made from different methods, both on slides and in a biological environment. This technique clearly discriminates between graphene flakes with different numbers of layers and reveals the distinct nonlinear optical properties of reduced graphene oxide as compared to mechanically exfoliated or chemical vapor deposition grown graphene. The nonlinearity makes it applicable to scattering samples (such as tissue) as opposed to previous methods, such as transmission. This was demonstrated by high-resolution imaging of breast cancer cells incubated with graphene flakes.
Keywords: Graphene, graphene layer counting, nonlinear microscopy, optical pulse shaping
The novel physical and chemical properties of graphene and its derivatives have stimulated interest in biological and medical applications, including drug delivery, cancer therapy, 1–3 biological sensing,4,5 and tissue engineering.6 The potential adverse health impact7,8 further motivates works on graphene biological imaging, but most imaging techniques that are capable of resolving graphene face significant challenges. Atomic resolution techniques9 are time-consuming, invasive, and not applicable to bulk tissue. Conventional optical microscopy gives strong contrast only on selected substrates. 10–12 Linear and nonlinear fluorescence imaging methods have been demonstrated with graphene oxide (GO),13,14 but luminescence of graphene is very weak,15 even if the graphene is functionalized by dyes (the graphene quenches the dyes’ fluorescence).16 Spatially resolved Raman spectroscopy of graphene17,18 is compromised by tissue scattering. Here we overcome these limitations with a novel type of nonlinear microscopy, based on femtosecond laser spectral reshaping, which lets us quantitatively characterize graphene and image graphene in scattering environments.
The linear dispersion relation in graphene boosts nonlinear optical response through one- or two-photon resonances,19,20 and CARS-type four-wave-mixing (FWM) microscopy has produced images of single- and multilayer graphene flakes on a glass coverslip.21 This approach, as with other traditional nonlinear contrasts, works because it generates light of a different color than the excitation wavelengths; in this case two excitation colors (pump λP and Stokes λS) generate an anti-Stokes beam.22,23 Recently, femtosecond pulse shaping and pulse train amplitude control have provided access to new contrast mechanisms that need not generate a different color.24 For example, spectral reshaping can provide nonlinear optical contrast from mechanisms, such as self-phase modulation (SPM) and two-photon absorption (TPA),25 even at very high speeds;26 pump−probe microscopy can image the structure of historical pigments,27 melanin composition in malignant melanoma,28,29 or semiconducting and metallic carbon nanotubes; 30 and stimulated Raman microscopy can produce tissue images with lower background than coherent anti-Stokes Raman scattering (CARS) microscopy.31
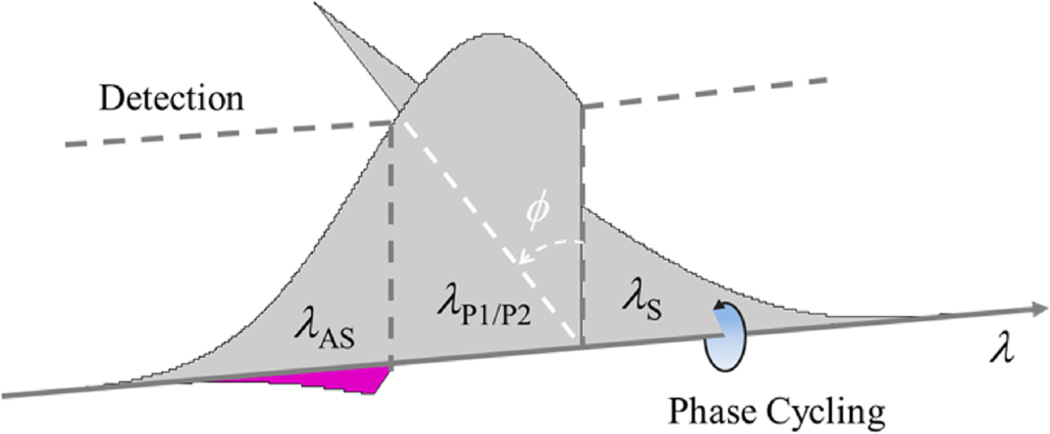
In this Letter, we adopted our spectral reshaping technique to simultaneously measure the SPM and TPA signals (the real and imaginary parts of the third-order nonlinear susceptibility χ(3)) produced in a FWM process excited by a single femtosecond laser pulse (see Supporting Information for more details). To implement this phase-sensitive measurement, the spectrum of a femtosecond mode-locked laser pulse is divided into three parts (Figure 1), which serve as the Stokes, pump, and anti-Stokes beams. Frequency shifting the Stokes component by a few MHz with an acousto-optic modulator introduces a phase shift ϕ (which is incremented from pulse to pulse) onto this component of each laser pulse. This cycling phase is then transferred to the generated anti-Stokes signal through the FWM process involving two pump photons (not necessarily degenerate) and one Stokes photon. The generated signal interferes with the original component at the anti-Stokes frequency (acting as a phase reference for heterodyne detection), producing intensity modulation in the output beam which can be measured by a lock-in amplifier (amplitude A, phase θ). A short pass filter rejects other components of the pulse. This provides information on the phase of the nonlinear interaction, amplifies the signal, and reduces sensitivity to scattering (as the reference field is part of the single exciting pulse). We adjust the lock-in reference phase such that pure SPM would give phase θ = 0; then for other positions, this phase is related to the susceptibility components as tan θ = β Im[χ(3)]/Re[χ(3)], where β takes into account the relative sensitivity of TPA and SPM measurements. The factor β depends on the specific pulse shape (e.g., the position of the edge filters) and can be calibrated experimentally (for our current pulse shape β = 1.7). For the experimental setup, please refer to the Supporting Information methods and Figure S1.
Figure 1.
Pulse shape for spectral reshaping imaging. Phase ϕ of the Stokes component (λS) is cycled at a given frequency f. Nonlinear interactions take this modulated Stokes component, together with the pump components (λP1/P2), and generate a new field in the anti-Stokes spectrum (λAS) indicated by the purple shape, which carries a spectral phase cycling at the same frequency f and interferes with the original static anti-Stokes components. The field generated in a TPA process is 180° out of phase with λS; the field generated in a SPM process is 90° out of phase.25,26 Therefore, the heterodyne detection of the intensity of the antistokes spectrum can distinguish TPA and SPM signals according to their phase orthogonality. The two dashed lines indicate edges of the short- and long-pass filters placed symmetrically about the spectral center.
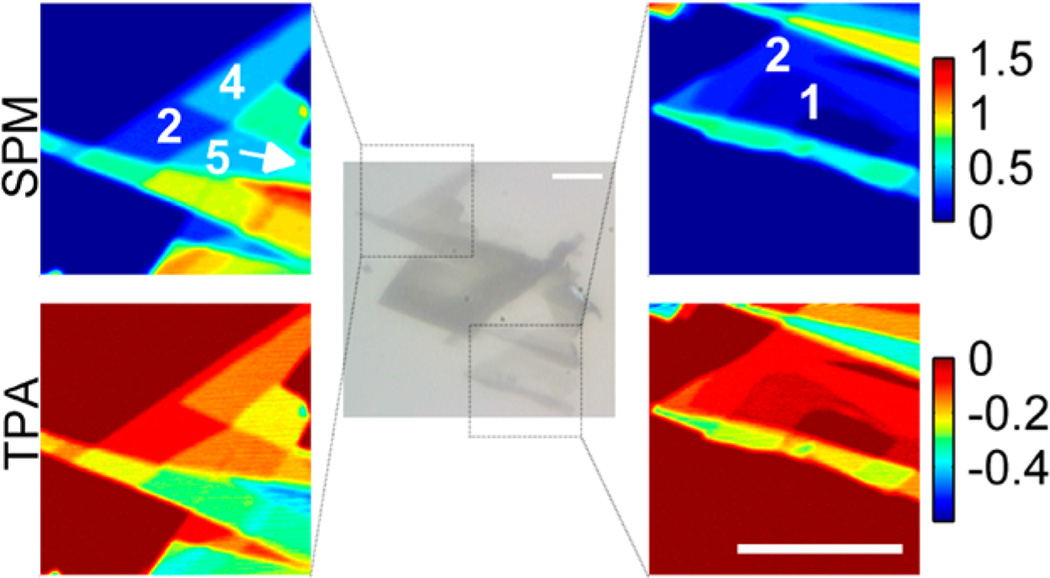
We first performed nonlinear optical imaging on mechanically exfoliated graphene flakes deposited on a glass coverslip using the ‘Scotch tape’ method.32 As Figure 2 illustrates, both SPM and TPA channels provide high-contrast images, and most regions display signals at discrete levels corresponding to graphene flakes with different numbers of layers. Similar patterns can also be seen in the bright-field image but with much lower dynamic range. For comparison, GO produces no appreciable nonlinear signal at the same power level (Figure S4). This is expected since GO does not possess the desired linear dispersion relation. After exposure to high optical power levels, GO can, however, show strong nonlinear signals; we suspect this is due to permanent light-induced reduction.33
Figure 2.
Bright-field image (grayscale, center) and nonlinear optical imaging of mechanically exfoliated graphene flakes (color, sides). Nonlinear optical images of regions indicated by dashed boxes in the bright-field images in the middle. White numbers label the numbers of layers in those specific regions. Input laser power is 0.5 mW. For some regions the number of layers is shown (see Figure 3 as well). Acquisition time is 1.6 s per frame, and the images are averaged over 8 frames. Scale bars are 20 µm.
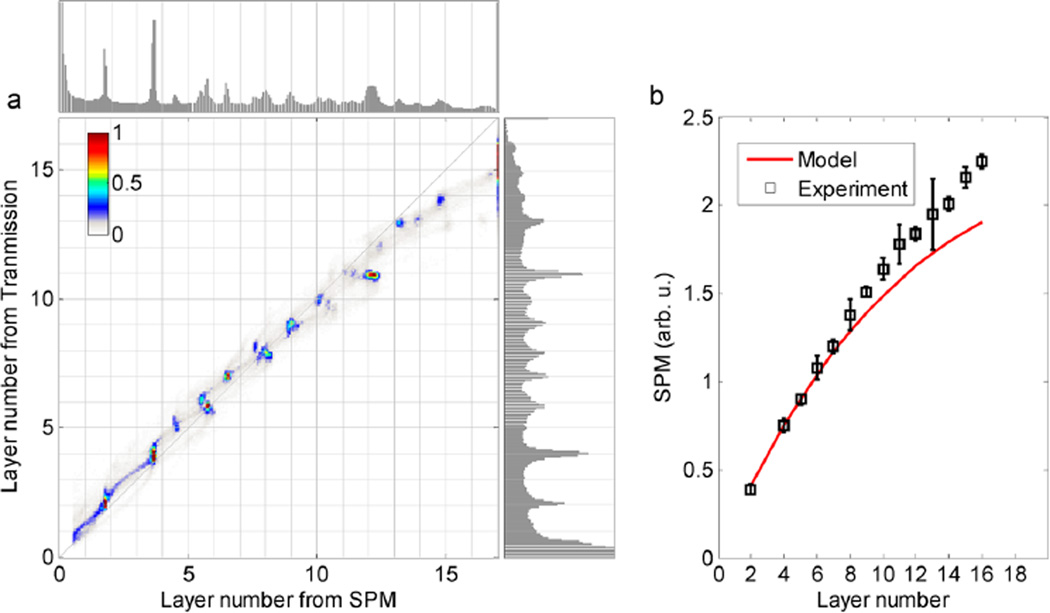
The high contrast in the nonlinear optical images lets us count the number of layers in each region. The region labeled with 1 in Figure 2 produces the minimum nonlinear signal; we confirmed that this is a single graphene layer by analyzing the same region with Raman spectroscopy (Figure S5). Figure 2 has little scattering, so we can compare the FWM images with coregistered transmission images to provide more insight in the signal generation and its dependence on number of layers (Figure S6). The expected transmittance is T = 1/(1 + NS)2 for graphene flakes with N layers.34 For the intensity used here (I = 10 GW/cm2) saturation is observed,35 and we include a saturation factor η in the definition S = ηπα/2, where α is the fine structure constant. As shown in ref 34 for a third-order process, a polarization field is generated that scales as E(3)= NS/(1 + NS)4. Because we measure an interference between the linearly transmitted phase reference and the generated anti-Stokes component, we expect our signal to scale as NS/(1 + NS)5. With these scaling relations, we convert both transmission and SPM signals to equivalent number of layers for each individual pixel (Figure 3a). A saturation factor of η = 0.71 provides good agreement of our experimental results with the theoretical model, aligning the peaks in the transmission histogram well to the grid; although it has previously been noted that the existing model for fitting FWM signal with the number of layers does not quantitatively fit21,34 (the SPM signal as a function of the number of graphene layers is plotted in Figure 3b). The background in these histograms arises from boundary areas that overlap different layer numbers within the image resolution, so by inspection the resolution is significantly better for the nonlinear approach. For instance, a small five-layer region (labeled in Figure 2a) is clearly shown in the top histogram but almost buried in the background in the right one. For large numbers of layers, small variations in the laser intensity with scattering (and thus, a position dependence of SPM signal) likely cause the weak splitting from the main line (see also supplementary Figure S6). The real significance, however, is that the SPM signals are still observable in a scattering sample, but small transmission differences are not.
Figure 3.
Comparison of graphene flake layer counting by transmission or nonlinear contrast. (a) Top (right) panel plots the histogram of number of layers converted from SPM (transmission) contrast in Figure S6. The major panel plots the 2D histogram of the number of layers, where the contributions from blank areas are masked. (b) SPM signal as a function of number of graphene layers. The red curve plots the scaling model NS/(1 + NS)5 with S obtained by fitting the small-layer transmission data.
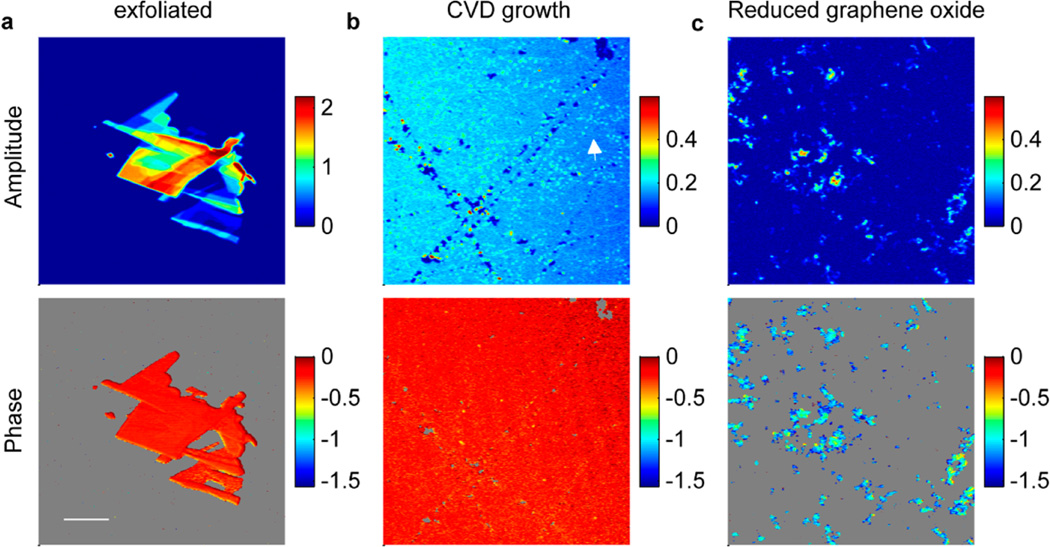
Figure 4 compares graphene samples produced by mechanical exfoliation, chemical vapor deposition (CVD) growth (1 ML-GL-1 × 1, Graphene Laboratories Inc.), or chemical reduction from graphene oxide (RGO). The RGO was obtained by hydrazine reduction of the GO that was synthesized by the modified Hummers method36,37 (see Supporting Information methods for detailed procedure). Monolayer graphene produced by CVD extends over a large scale (up to 1 mm), but the morphological inhomogeneity at the micrometer scale is higher than in mechanically exfoliated graphene flakes. Dotted bright lines in Figure 4b may be caused by granular boundaries on the copper foil where the graphene monolayer is grown, and the small holes and bright spots are likely due to scratching or contamination during the production and the transformation process. Although the physical appearances of CVD and mechanically exfoliated films are different, their nonlinear optical properties are quite similar. The nonlinear signal amplitude and phase of single-layer exfoliated graphene (A = 0.16 ± 0.004, θ = −0.24 ± 0.09 rad) are very close to the values in CVD growth monolayer graphene (A = 0.18 ± 0.006, θ = −0.21 ± 0.07 rad). This phase is also almost identical for flakes with different number of layers in Figure 4a, implying that SPM and TPA satisfy very similar layer−number scaling. However, RGO exhibits very distinct behavior. From Figure 4c we can see that RGO flakes are well dispersed on the glass coverslip, since the RGO suspension used to make this sample is stabilized with gum arabic. As revealed by high-resolution TEM images in Figure S7, the sample is composed of small RGO flakes with scrabbled edges and attached to each other, and the edges and contacting regions (equivalently more layers) produce much higher nonlinear signals, indicating by the bright edges in Figure 4c. The average signal strength is comparable to few-layer graphene flakes from exfoliated graphene samples, however, the phase in the RGO samples (−1.0 ± 0.3 rad) is vastly different from the other two types of graphene, and the inhomogeneity across the sample is bigger. The phase shifts toward TPA, which might indicate that the residue oxidization might result in strong nonlinear absorption.
Figure 4.
Nonlinear amplitude and phase images of different types of graphene. (a) Mechanically exfoliated few-layer graphene flakes. (b) CVD growth monolayer graphene transferred onto a glass substrate. The arrow shows bright dotted lines that may be caused by granular boundaries on the copper foil. (c) Gum arabic-stabilized RGO suspension dispersed on a glass coverslip. In the phase images, the low-amplitude areas are masked. All images are acquired with 0.7 mW input power. Acquisition time is 6.4 s per frame, and the images are averaged over 4 frames. The scale bar is 20 µm.
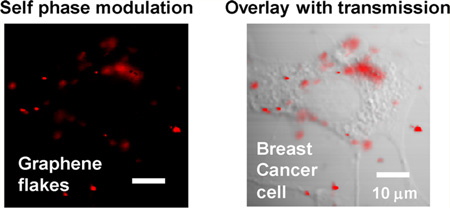
Finally, to demonstrate the ability to image graphene in biological environments by spectral reshaping, we acquired in vitro images of breast cancer cells incubated with gum arabic-stabilized RGO flakes. A transmission image of a breast cancer cell is displayed in Figure 5a; RGO flakes and aggregates are noticeable but present very little contrast. The coregistered nonlinear optical image in Figure 5b, on the other hand, highlights only the distribution of RGO flakes. Overlaying SPM contrast onto the transmission image clearly shows how the RGO flakes are distributed within the cell and its environment (Figure 5c). While the majority of the flakes are attached to the cell membrane, some flakes are trapped in the cytoplasm, and others are floating in the culture medium. Although Figure 5 just shows images taken at a specific depth, our technique is capable of 3D optical sectioning, and a stack of images at different depths is shown in the Supporting Information movie file.
Figure 5.
In vitro graphene imaging in BT549 breast cancer cells. (a) Transmission contrast displays a cell. (b) SPM contrast highlights the distribution of graphene flakes. (c) Composite image of both transmission and SPM contrasts. Laser power before the objective is 1 mW. Acquisition time is 3.2 s per frame, and the images are averaged over 8 frames. The scale bar is 20 µm. This technique is capable of 3D optical sectioning, and a stack of images at different depths is shown in the Supporting Information movie file.
Our technique provides several potential advantages over other available nonlinear imaging methods. For example, pump−probe microscopy28,30 can also image graphene, but our heterodyne technique discerns the nonlinear phase (the SPM/TPA ratio), which is independent of the number of layers in exfoliated and CVD grown graphene. Thus phase can distinguish graphene response from the many other TPA and SPM processes in complex materials, such as tissue. In addition, our technique utilizes a one-color laser system which is simpler and less expensive than the two-color laser system used in pump−probe and previous CARS-type FWM microscopy.
In conclusion, we have developed a versatile nonlinear optical imaging technique for quantitative graphene imaging in both solid-state and biological environments. This technique can be easily incorporated into a commercial multiphoton microscopy to provide additional valuable nonlinear optical contrasts. The high-contrast nonlinear optical images can quantify the layer number of few-layer graphene flakes with high resolution even on a scattering surface, which might be useful in solid-state graphene studies and in optoelectronic applications. With 3D optical sectioning, submicrometer resolution and fast imaging speed, our spectral reshaping nonlinear optical imaging technique also offers a promising way to study nano−bio interactions and the cytotoxicity of graphene products.
Supplementary Material
ACKNOWLEDGMENTS
B.L. is thankful to Prof. Mikhailov at the University of Augsburg, Germany and Dr. Hendry at the University of Exeter, UK, for helpful discussions on the layer dependence of transmission and nonlinear signal generation in graphene.
Footnotes
ASSOCIATED CONTENT
Supporting Information
This material is available free of charge via the Internet at http://pubs.acs.org.
The authors declare no competing financial interest.
REFERENCES
- 1.Yang K, Zhang SA, Zhang GX, Sun XM, Lee ST, Liu ZA. Nano Lett. 2010;10(9):3318–3323. doi: 10.1021/nl100996u. [DOI] [PubMed] [Google Scholar]
- 2.Liu Z, Robinson JT, Sun XM, Dai HJ. J. Am. Chem. Soc. 2008;130(33):10876–10877. doi: 10.1021/ja803688x. [DOI] [PMC free article] [PubMed] [Google Scholar]
- 3.Sun XM, Liu Z, Welsher K, Robinson JT, Goodwin A, Zaric S, Dai HJ. Nano Res. 2008;1(3):203–212. doi: 10.1007/s12274-008-8021-8. [DOI] [PMC free article] [PubMed] [Google Scholar]
- 4.Lu CH, Yang HH, Zhu CL, Chen X, Chen GN. Angew. Chem. Int. Ed. 2009;48(26):4785–4787. doi: 10.1002/anie.200901479. [DOI] [PubMed] [Google Scholar]
- 5.Loh KP, Bao QL, Eda G, Chhowalla M. Nat. Chem. 2010;2(12):1015–1024. doi: 10.1038/nchem.907. [DOI] [PubMed] [Google Scholar]
- 6.Park S, Mohanty N, Suk JW, Nagaraja A, An JH, Piner RD, Cai WW, Dreyer DR, Berry V, Ruoff RS. Adv. Mater. 2010;22(15):1736–1740. doi: 10.1002/adma.200903611. [DOI] [PubMed] [Google Scholar]
- 7.Schinwald A, Murphy FA, Jones A, MacNee W, Donaldson K. ACS Nano. 2012;6(1):736–746. doi: 10.1021/nn204229f. [DOI] [PubMed] [Google Scholar]
- 8.Duch MC, Budinger GRS, Liang YT, Soberanes S, Urich D, Chiarella SE, Campochiaro LA, Gonzalez A, Chandel NS, Hersam MC, Mutlu GM. Nano Lett. 2011;11(12):5201–5207. doi: 10.1021/nl202515a. [DOI] [PMC free article] [PubMed] [Google Scholar]
- 9.Ishigami M, Chen JH, Cullen WG, Fuhrer MS, Williams ED. Nano Lett. 2007;7(6):1643–1648. doi: 10.1021/nl070613a. [DOI] [PubMed] [Google Scholar]
- 10.Nair RR, Blake P, Grigorenko AN, Novoselov KS, Booth TJ, Stauber T, Peres NMR, Geim AK. Science. 2008;320(5881):1308–1308. doi: 10.1126/science.1156965. [DOI] [PubMed] [Google Scholar]
- 11.Roddaro S, Pingue P, Piazza V, Pellegrini V, Beltram F. Nano Lett. 2007;7(9):2707–2710. doi: 10.1021/nl071158l. [DOI] [PubMed] [Google Scholar]
- 12.Casiraghi C, Hartschuh A, Lidorikis E, Qian H, Harutyunyan H, Gokus T, Novoselov KS, Ferrari AC. Nano Lett. 2007;7(9):2711–2717. doi: 10.1021/nl071168m. [DOI] [PubMed] [Google Scholar]
- 13.Senyuk B, Behabtu N, Pacheco BG, Lee T, Ceriotti G, Tour JM, Pasquali M, Smalyukh II. ACS Nano. 2012;6(9):8060–8066. doi: 10.1021/nn302644r. [DOI] [PubMed] [Google Scholar]
- 14.Galande C, Mohite AD, Naumov AV, Gao W, Ci L, Ajayan A, Gao H, Srivastava A, Weisman RB, Ajayan PM. Sci. Rep. 2011;1(85):5. doi: 10.1038/srep00085. [DOI] [PMC free article] [PubMed] [Google Scholar]
- 15.Lui CH, Mak KF, Shan J, Heinz TF. Phys. Rev. Lett. 2010;105(12):127404. doi: 10.1103/PhysRevLett.105.127404. [DOI] [PubMed] [Google Scholar]
- 16.Kim J, Cote LJ, Kim F, Huang JX. J. Am. Chem. Soc. 2010;132(1):260–267. doi: 10.1021/ja906730d. [DOI] [PubMed] [Google Scholar]
- 17.Zavaleta C, de la Zerda A, Liu Z, Keren S, Cheng Z, Schipper M, Chen X, Dai H, Gambhir SS. Nano Lett. 2008;8(9):2800–2805. doi: 10.1021/nl801362a. [DOI] [PMC free article] [PubMed] [Google Scholar]
- 18.Havener RW, Ju SY, Brown L, Wang ZH, Wojcik M, Ruiz-Vargas CS, Park J. ACS Nano. 2012;6(1):373–380. doi: 10.1021/nn2037169. [DOI] [PubMed] [Google Scholar]
- 19.Druet SAJ, Attal B, Gustafson TK, Taran JP. Phys. Rev. A. 1978;18(4):1529–1557. [Google Scholar]
- 20.Wang Y, Lin C-Y, Nikolaenko A, Raghunathan V, Potma EO. Adv. Opt. Photonics. 2011;3(1):1–52. [Google Scholar]
- 21.Hendry E, Hale PJ, Moger J, Savchenko AK, Mikhailov SA. Phys. Rev. Lett. 2010;105(9):097401. doi: 10.1103/PhysRevLett.105.097401. [DOI] [PubMed] [Google Scholar]
- 22.Kim H, Sheps T, Collins PG, Potma EO. Nano Lett. 2009;9(8):2991–2995. doi: 10.1021/nl901412x. [DOI] [PMC free article] [PubMed] [Google Scholar]
- 23.Min W, Lu SJ, Rueckel M, Holtom GR, Xie XS. Nano Lett. 2009;9(6):2423–2426. doi: 10.1021/nl901101g. [DOI] [PubMed] [Google Scholar]
- 24.Warren WS, Fischer MC, Ye T. Laser Focus World. 2007;43(6):99–103. [Google Scholar]
- 25.Fischer MC, Ye T, Yurtsever G, Miller A, Ciocca M, Wagner W, Warren WS. Opt. Lett. 2005;30(12):1551–1553. doi: 10.1364/ol.30.001551. [DOI] [PubMed] [Google Scholar]
- 26.Li B, Claytor KE, Yuan H, Vol-Dinh T, Warren WS, Fischer MC. Opt. Lett. 2012;37(13):2763–2765. doi: 10.1364/OL.37.002763. [DOI] [PubMed] [Google Scholar]
- 27.Samineni P, deCruz A, Villafana TE, Warren WS, Fischer MC. Opt. Lett. 2012;37(8):1310–1312. doi: 10.1364/OL.37.001310. [DOI] [PubMed] [Google Scholar]
- 28.Fu D, Ye T, Matthews TE, Grichnik J, Hong L, Simon JD, Warren WS. J. Biomed. Opt. 2008;13(5):054036. doi: 10.1117/1.2976424. [DOI] [PubMed] [Google Scholar]
- 29.Matthews TE, Piletic IR, Selim MA, Simpson MJ, Warren WS. Sci. Transl. Med. 2011;3(71) doi: 10.1126/scitranslmed.3001604. 71ra15. [DOI] [PMC free article] [PubMed] [Google Scholar]
- 30.Tong L, Liu YX, Dolash BD, Jung Y, Slipchenko MN, Bergstrom DE, Cheng JX. Nat. Nanotechnol. 2012;7(1):56–61. doi: 10.1038/nnano.2011.210. [DOI] [PubMed] [Google Scholar]
- 31.Freudiger CW, Min W, Saar BG, Lu S, Holtom GR, He CW, Tsai JC, Kang JX, Xie XS. Science. 2008;322(5909):1857–1861. doi: 10.1126/science.1165758. [DOI] [PMC free article] [PubMed] [Google Scholar]
- 32.Novoselov KS, Geim AK, Morozov SV, Jiang D, Zhang Y, Dubonos SV, Grigorieva IV, Firsov AA. Science. 2004;306(5696):666–669. doi: 10.1126/science.1102896. [DOI] [PubMed] [Google Scholar]
- 33.El-Kady MF, Strong V, Dubin S, Kaner RB. Science. 2012;335(6074):1326–1330. doi: 10.1126/science.1216744. [DOI] [PubMed] [Google Scholar]
- 34.Mikhailov SA. Phys. E (Amsterdam, Neth.) 2012;44(6):924–927. [Google Scholar]
- 35.Xing G, Guo H, Zhang X, Sum TC, Huan CH. A. Opt. Express. 2010;18(5):4564–4573. doi: 10.1364/OE.18.004564. [DOI] [PubMed] [Google Scholar]
- 36.Hummers WS, Offeman RE. J. Am. Chem. Soc. 1958;80(6):1339–1339. [Google Scholar]
- 37.Zhao JP, Pei SF, Ren WC, Gao LB, Cheng HM. ACS Nano. 2010;4(9):5245–5252. doi: 10.1021/nn1015506. [DOI] [PubMed] [Google Scholar]
Associated Data
This section collects any data citations, data availability statements, or supplementary materials included in this article.


