

Abstract
Mood disorders such as major depressive disorder (MDD) and bipolar disorder (BD)—and their consequent effects on the individual and society—are among the most disabling and costly of all medical illnesses. While a number of antidepressant treatments are available in clinical practice, many patients still undergo multiple and lengthy medication trials before experiencing relief of symptoms. A tremendous need therefore exists to improve current treatment options, and to facilitate more rapid, successful treatment in patients suffering from the deleterious neurobiological effects of ongoing depression.
Towards that end, ongoing research is exploring the identification of biomarkers that may be involved in prevention, diagnosis, treatment response, severity, or prognosis of depression. Biomarkers evaluating treatment response will be the focus of this review, given the importance of providing relief to patients in a more expedient and systematic manner. A novel approach to developing such biomarkers of response would incorporate interventions with a rapid onset of action—such as sleep deprivation or intravenous drugs (e.g. ketamine or scopolamine). This alternative translational model for new treatments in psychiatry would facilitate shorter studies, improve feasibility, and increase higher compound throughput testing for these devastating disorders.
Keywords: antidepressant, depression, glutamate, ketamine, muscarinic, NMDA, scopolamine, sleep deprivation, biomarker
Introduction
Mood disorders such as major depressive disorder (MDD) and bipolar disorder (BD)— and their consequent impairments on the individual, family, work force, and society—are among the most disabling and costly of all medical illnesses (1). The serendipitous discovery of the mood-enhancing effects of anti-tuberculosis drugs in the 1950s introduced biological targets (i.e., serotonin and norepinephrine neurotransmitters) that were initially pursued to decipher the etiology and pathogenesis of MDD. Our increasing knowledge of these neurotransmitter systems led to the creation of a number of antidepressant drugs (i.e., tricyclic antidepressants, monoamine oxidase inhibitors, selective serotonin reuptake inhibitors, etc.) currently being used in standard clinical practice. Nevertheless, many patients continue to undergo multiple and lengthy medication trials before experiencing relief of symptoms, and many do not respond to the current array of antidepressant agents. Furthermore, until full antidepressant effects manifest, patients experience considerable disruption to their lives, and remain at risk for suicidal behavior. More importantly, individuals continue to be exposed to the deleterious neurobiological effects associated with ongoing depression. Thus, a tremendous need exists to facilitate more rapid and effective treatments for patients with mood disorders.
In developing any new therapeutic, the ability to assess both efficacy and safety is paramount. Testing these endpoints in clinical trials often requires significant time, and has contributed to the escalating cost of validating investigational new drugs. In psychiatric and central nervous system (CNS) trials, developing biomarkers could provide surrogate indices of clinically relevant endpoints. Similarly, biomarkers could contribute to insights regarding neurobiological correlates of treatment response (2). For this review, a biomarker is defined as “a characteristic that is objectively measured and evaluated as an indicator of normal biological processes, pathogenic processes, or pharmacological responses to a therapeutic intervention” (3). Although their value in terms of personalizing treatment remains unclear, mood disorders research has focused on identifying biomarkers that might be involved in prevention, diagnosis, treatment response, severity, or prognosis (4). Table S1 (see Supplement 1) broadly summarizes common biomarker tools used in treatment trials for mood disorders. Biomarkers evaluating rapid treatment response will be the focus of this review, given the significance of providing relief to patients in a more expedient and systematic manner.
One prominent limitation for developing biomarkers of response for existing traditional antidepressants is that many of these treatments require six weeks or more to exert an adequate treatment response. Other similar limitations are highlighted in Table S2 (see Supplement 1). A novel approach that would resolve some of these limitations is the incorporation of interventions with a rapid onset of action (e.g., intravenous ketamine or scopolamine). This alternative translational approach could ultimately facilitate shorter studies, improve feasibility, and promote testing of putative biomarkers with overall higher compound throughput. Moreover, once such biomarkers are identified, they can be used a priori to guide additional research by classifying patients based on expected clinical response to treatment.
Sleep Deprivation
Case observations of sleep deprivation (SD) in the early 1970s provided the first evidence that this treatment modality is a rapid-acting, non-pharmacologic antidepressant therapy (5). Since then, several studies have demonstrated relatively rapid reversal (24–48 hrs) of depressive symptoms in approximately 40–60% of depressed patients (6). SD interventions include total sleep deprivation (TSD, studies vary from 26–36 hours to 36–40 hours) (5), partial sleep deprivation (PSD, about 20 hours, often with less pronounced antidepressant effects) (7), and selective REM SD.
Multiple biologic factors have been implicated in the neurobiological mechanisms underlying the rapid antidepressant effects associated with SD, and a detailed review of these studies is beyond the scope of this paper. However, Table 1 highlights much of the past work evaluating potential human biomarkers to predict treatment response to SD. Below, we briefly focus on some of the more notable and recent translational studies.
Table 1.
Biomarkers used to predict treatment response to SD
| Biomarkers in SD | Design | Results | Reference |
|---|---|---|---|
| Neurophysiologic | |||
| EEG | n =16 MDD, TSD | Responders to treatment were rated as significantly more depressed and revealed a more “depressed” EEG sleep pattern prior to sleep deprivation than did NRs. | Duncan et al 1980 (20) |
| n=16 MDD, TSD/SPA | SD responders showed a steady decrease of SWA across successive NREM episodes; a high delta sleep ratio positively predicted SD response. | Nissen et al 2001 (21) | |
| n= 33 MDD, PSD/TSD | Using cutoffs of 30%, 35%, 40%, and 50% to dichotomize responders and NRs, PSG variables were evaluated for between-group differences; continuity differed between responders and NRs on baseline and recovery nights; no response cutoff tested was clearly “best” in terms of detecting the most PSG differences between groups. | Clark et al 2007 (73) | |
| n = 17 MDD, BSL/SWD/RCV | Reduction in depressive symptoms correlated with the overnight dissipation of fronto-central SWA on baseline sleep, the rebound in right frontal all-night SWA on recovery sleep, and the amount of REM sleep on the SWD night. | Landsness et al 2011 (22) | |
| Auditory-evoked potentials | n=17 depressed inpatients, TSD | The most prominent changes (responders and nonresponders) were found for the amplitude of the P300 component. Responders showed smaller N1 amplitudes before TSD but a higher increase after TSD than NRs. | Danos et al 1994 (74) |
| Neuroimaging | |||
| SPECT/HMPAO | n = 10 MDD - melancholic, TSD | All depressed pts (n=5) showed relative hypoperfusion in the left anterolateral PFC before and after TSD; responders showed hyperperfusion in limbic system at baseline with reduction in limbic region after TSD. | Ebert et al 1991 (75) |
| n=20 (15 MDD, 2 BD, 3 dysthmic), TSD | Responders (n=11) showed increased CBF to left temporal and mainly right parietal regions; CBF values and the severity of depression correlated inversely. | Volk et al 1992 (76) | |
| n = 20 MDD, melancholic, TSD | Before TSD, responders (n=11) showed hyperperfusion in the right ACC and in the right and left fronto-orbital cortex and basal cingulate gyrus. | Ebert et al 1994a (77) | |
| n= 10 MDD, TSD | Responders (n=5) showed decrease of basal ganglia D2 receptor occupancy after TSD compared to NRs; data suggests enhanced dopamine release in responders. | Ebert et al 1994b (78) | |
| n=15 (13 MDD, 2 BD), PSD | Responders (n=9) to PSD had higher perfusion in the right OFC than NRs before PSD; multiple regression analysis showed right orbitofrontal/basal cingulate perfusion before PSD, and left inferior temporal perfusion after PSD, as fairly accurate predictors of change in depression scores. | Volk et al 1997 (79) | |
| n=14 (12 MDD, 2 BD), TSD | Before TSD, responders (n=8) had higher anterior cingulate perfusion than the NRs that normalized after TSD; baseline left hypoperfusion in left PFC in all patients, which responders normalized on remission. | Holthoff et al 1999 (80) | |
| PET/FDG | n= 15 MDD, TSD | Depressed responders (n=4) had higher cingulate cortex metabolic rate than depressed NRs before TSD; this normalized after TSD. | Wu et al 1992 (81) |
| n=6 MDD, elderly, TSD | Greatest reductions in normalized, relative glucose metabolism after TSD were observed in the ACC (BA24); results persisted after recovery sleep and antidepressant treatment (paroxetine). | Smith et al 1999 (82) | |
| n= 36 MDD, TSD | Responders (n=12) had higher metabolic rates in the medial PFC, ventral ACC (BA 24), and posterior subcallosal gyrus at baseline than depressed NRs and controls; responders had decreases in the medial PFC and frontal pole after TSD. | Wu et al 1999 (83) | |
| n =12 MDD, elderly, TSD | Early metabolic alterations in the right cingulate gyrus and the persistence of these adaptive changes were associated with improvement in depressive symptoms. | Smith et al 2002 (84) | |
| n=6 BD/MDD, TSD | Positive correlations (decreased depression with reduced relative cerebral glucose metabolism) were found in the inferior frontal gyrus and inferior frontal/orbital frontal cortex; negative correlations were found in the dorsolateral prefrontal cortex. | Wu et al 2008 (16) | |
| fMRI | n= 17 MDD, PSD | Baseline bilateral amygdalar perfusion was greater in responders (n=5) than NRs; differential amygdalar perfusion changes were noted with PSD between responders and NRs. | Clark et al 2006 (85) |
| n=20 BD, repeat TSD with LT | SERTPR genotype of predicted response to treatment and influenced baseline neural responses in the ACC and the DLPFC. | Benedetti et al 2007 (86) | |
| MRS | n= 13 MDD, TSD | In the DLPFC, TSD did not change Glx or its elements, whereas the total creatine and choline signal increased marginally. No change noted in the POC. | Murck et al 2009 (87) |
| n=19 BD, repeat TSD and LT | Decrease in the Glx/creatine ratio significantly correlated with the improvement of both objective and subjective measures of depression. | Benedetti et al 2009 (88) | |
| Genetics | |||
| 5-HTTLPR | n=68 BD, TSD | Patients homozygotic for the long variant of 5-HTTLPR showed significantly better mood after TSD than heterozygotic and homozygotic patients with short variant. | Benedetti et al 1999 (89) |
| n=56 MDD, PSD | 5-HTTLPR gene variants showed no difference with reduction in depression scores. | Baghai et al 2003 (90) | |
| n=22 BD, TSD, LT | Light therapy sustained the effect of TSD. The effect was more marked in homozygotes for the long variant of 5-HTTLPR than in heterozygotes and homozygotes for the short variant. | Benedetti et al 2003 (91) | |
| n=122 BD, TSD | Triple interaction of 5-HTTLPR, rs334558 (promoter variant for GSK3β) and treatment on severity of depression noted. Among rs334558 T/T homozygotes the best antidepressant response was associated with 5-HTTLPR l/l homozygosity, and among the rs334558 C carriers the 5-HTTLPR s/s showed the best response to treatment. | Benedetti et al 2012 (92) | |
| COMT | COMT gene (rs4680) and response to TSD combined with light tx, n=87, BD inpatients | Patients homozygotic for the Val/Val variant showed less efficient antidepressant effect after the night awake than those who were heterozygotic and homozygotic for the Met variant. | Benedetti et al 2010 (93) |
| 5HT2A SNP | n = 80 BD, repeat TSD | All genotype groups showed comparable acute effects of the first TSD, but patients homozygous for the T variant had better perceived and observed benefits from treatment than carriers of the C allele. | Benedetti et al 2008 (11) |
| Peripheral Markers | |||
| BDNF | n = 51, repeat TSD, +/− sertraline | Serum BDNF levels were significantly lower at baseline in both treatment groups compared to controls; decreased levels of BDNF were also negatively correlated with depression scores. | Gorgulu et al 2009 (27) |
| Serum VEGF / BDNF, n =11 MDD, TSD | As depression scores decreased following TSD, VEGF plasma levels increased; no association found with BDNF levels. | Ibrahim et al 2011 (28) | |
| IL-6 | n= 10 BD, TSD/SPA | A significant inverse correlation was observed between IL-6 levels and VAS scores after TSD (Day 2) and after SPA (Day 3); no correlation on measures after day 1. | Benedetti et al 2002 (94) |
| Neuroactive steroids | n = 29 MDD, PSD | PSD did not affect the concentrations of neuroactive steroids in either responders (n=20) or NRs. | Schule et al 2004 (95) |
| RAAS | n = 7 MDD, PSG, TSD | TSD in patients with depression led to an increase in renin secretion and a concomitant trend for a decrease in HPA axis activity in the recovery night. | Murck et al 2006 (96) |
Abbreviations:
ACC = anterior cingulate cortex; BDNF = brain-derived neurotrophic factor; BD = bipolar disorder (depressed); BSL = baseline; CBF = cerebral blood flow; COMT = catechol-O-methyltransferase; DLPFC = dorsolateral prefrontal cortex; EEG = electroencephalogram; FDG = fluorodeoxyglucose; fMRI = functional magnetic resonance imaging; Glx = sum-peak of glutamate; glutamine and gamma aminobutyric acid (GABA); GSK3β = glycogen synthase kinase 3-beta; HMPAO =Technetium -99- hexamethyl propyleneamine oxime; HPA axis = hypothalamic pituitary adrenal axis; IL-6 = interleukin-6; LT = light therapy; MDD =major depressive disorder; MRS = magnetic resonance spectroscopy; NREM = non rapid eye movement; NRs = non-responders; OFC = orbitofrontal cortex; PET = positron emission tomography; PFC = prefrontal cortex; POC = parieto-occipital cortex; PSD = partial sleep deprivation; PSG = polysomnography; RAAS = renin-angiontensin-aldosterone system; RCV = recovery sleep nights; SERTPR = promoter region of the serotonin transporter SNP = single nucleotide polymorphism; SPA = sleep phase advance; SPECT = single photon emission computerized tomography; SWA = slow wave activity; SWD = slow wave deprivation intervention; TSD = total sleep deprivation; VAS = visual analogue scale; VEGF = vascular endothelial growth factor; 5HTTLPR = 5-HTT linked polymorphic region.
Sleep Deprivation: Genetics
The 5-HT2A receptor, which is associated with depression and suicide (8), influences slow wave sleep regulation (9) and contributes to improved sleep response following mirtazapine, a 5-HT2A blocker (10). The effects of rs6313, a single nucleotide polymorphism (SNP) of the 5-HT2A receptor gene, and repeated TSD was evaluated in patients with BD (n=80) (11). While no difference among groups occurred following the first TSD, homozygotes for the T variant (rs6313 T/T) experienced a 36% larger response to treatment after the first recovery night than did carriers of the C allele (rs6313 T/C, C/C) (11).
The noradrenergic and dopaminergic systems are well established targets for antidepressants (12), and variants of the catechol-O-methyltransferase (COMT) gene (a major degrading enzyme for dopamine and norepinephrine) influence response to traditional antidepressants (13, 14). The COMT Val (108/158) Met polymorphism (rs4680) was evaluated relative to response following SD combined with light therapy in patients with BD. Patients who were homozygotic for the Val/Val variant showed less of an antidepressant response than those who were heterozygotic and homozygotic for the Met variant. Interestingly, the effects of rs4680 were similar to those observed with paroxetine (13) and fluoxetine (14) in that the magnitude of the effect was promoted by the negative presence of the Val/Val genotype, but opposite to that of ketamine (discussed in detail below). Such findings not only highlight how treatment responses can vary with the same genotype, but also how personalizing treatment based on underlying neurobiology could be applied. Other genetic findings are summarized in Table 1.
Sleep Deprivation: Functional Neuroimaging
Earlier work using positron emission tomography (PET) with 18 fluorodeoxyglucose (18FDG) or single photon emission computerized tomography (SPECT) with Technetium-99-bexamethyl propyleneamine oxime (HMPAO) showed that (a) patients who subsequently responded to SD had increased metabolism at baseline compared to non-responders in the orbital prefrontal cortex (PFC), and ventral anterior cingulate cortex (ACC); and (b) that normalization of these areas paralleled treatment response to SD (15). Higher resolution PET scans with 18FDG were used with patients on sertraline and lithium before and after SD. Correlations between treatment response and glucose metabolism were found in the inferior frontal gyrus, inferior frontal/orbital frontal cortex, and dorsolateral PFC (16). The interested reader is referred to (15) for a more detailed review.
Sleep Deprivation: Sleep Architecture
Sleep disturbances play a prominent role in diagnostic criteria for MDD, and abnormalities can include shortening of REM latency, increased REM density, overall disturbance of sleep continuity (17, 18), and reduced slow wave sleep (slow delta electroencephalogram (EEG) activity) (19). Patients who responded to SD exhibited a greater rebound of slow wave sleep and total sleep time after recovery sleep compared to baseline (20). Moreover, a high delta sleep ratio (ratio of slow wave activity [SWA] in the first to the second REM sleep cycle) on the night before SD predicted antidepressant response (21). More recently, a selective slow wave deprivation (SWD) technique was assessed in MDD patients to evaluate the role of slow wave homeostasis in antidepressant response to SD using high-density EEG (hdEEG). Participants experienced a small decrease in depressive symptoms that correlated with the overnight dissipation of fronto-central SWA on baseline sleep, rebound in right frontal all-night SWA on recovery sleep, and amount of REM sleep on the SWD night (22).
Sleep Deprivation: Neurotrophic Factors
One of the most studied neurotrophic factors in mood disorders is brain derived neurotrophic factor (BDNF) (23). BDNF is extensively expressed in the CNS, and mediates neurogenesis and synaptic plasticity in depressed patients (24). One recent review (n=1504 subjects) noted that BDNF levels increased following antidepressant treatment in a manner that correlated with treatment response (25). BDNF levels also are implicated in sleep-wake physiology (26), and researchers showed that a single TSD in MDD patients rapidly increased serum BDNF levels in a manner that correlated with treatment response (27). While others have failed to replicate these findings (28), overall these data lend support to the neurotrophic hypothesis of depression (27).
Sleep Deprivation: Glutamatergic System
Abnormalities in glutamatergic and gamma aminobutyric acid (GABA)ergic neurotransmission in MDD (29) have been of particular recent interest in light of findings that the N-methyl-D-aspartate (NMDA) antagonist ketamine rapidly improves depressive symptoms (30, 31). Magnetic resonance spectroscopy (MRS) allows researchers to assess glutamate-related metabolites in vivo. A recent review of MRS studies in mood disorders found relatively consistent and widespread patterns of Glx-level (reflecting the sum of glutamate, glutamine (GLN) and GABA concentrations) reductions in MDD and elevations in BD (32). Research also shows that reduced levels of Glx normalized after electroconvulsive therapy (ECT) (33). These findings suggest that the glutamatergic system is a viable target for further evaluation of potential biomarkers of antidepressant treatment response.
Novel Rapid-Acting Antidepressants: Ketamine and Scopolamine
Ketamine
Recent reviews have detailed the significant antidepressant effects of ketamine in patients with treatment resistant mood disorders (34, 35). Several neurobiological correlates of ketamine’s antidepressant effects are being investigated via a multi-modal approach to both inform the likelihood of response and provide insights into ketamine’s mechanisms of action (Figure 1, Table 2). Towards this end, identifying these or similar biomarkers would promote the development of new rapid-acting antidepressants and help identify patients who will favorably respond. This work is still preliminary, and thus larger replication studies will be required to validate this approach. This section briefly highlights some of the more prominent biomarker studies involving ketamine.
Fig 1. Conceptual Framework of Translating Biomarkers of Treatment Response to Develop Rapid Acting Antidepressants.
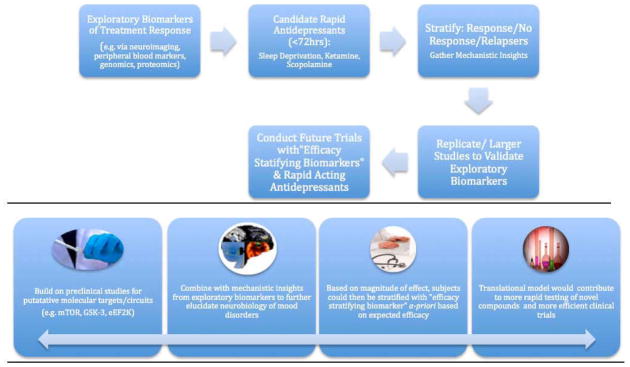
This model characterizes our approach to the study of biomarkers and is designed to enhance our ability to rapidly identify and test surrogate clinical and biological endpoints that predict treatment outcomes (e.g. ≥50% antidepressant response) in mood disorders. The method uses novel agents or other interventions that produce rapid antidepressant clinical effects (i.e. ≤72 hours). Results lead to both prompt evaluation of efficacy and potential insights into relevant neural and molecular correlates of outcome (e.g. mTOR activation, eEF2K inhibition). The benefits of developing biomarkers within this model are contrasted with the model used to evaluate conventional antidepressant treatments (Table S2 in Supplement 1). The long-term goal of this model is to validate successful biomarkers of response, where patients can then be stratified a priori based on expected efficacy. Overall, this will contribute to more efficient prospective trials and lead to the identification of enriched biological subgroups.
In this figure, ketamine can be used as a prototype: approximately 50% of subjects achieve response within four hours thus permitting the assessment of multiple biomarkers (e.g. fMRI, MEG, PSG, BDNF, SNPs) and resulting neural and molecular correlates of outcome (Table 3). Ketamine’s antidepressant effects in most patients with treatment-resistant depression appear to fade in one to two weeks. Thus, this time point also permits the opportunity to assess the molecular and neural correlates of relapse in mood disorders.
Table 2.
Controlled trials of Scopolamine and Ketamine using biomarkers to predict treatment response
| Study | Biomarker used | Sample/Design | Administration route | Rating scale | Clinical outcome | Biomarker finding |
|---|---|---|---|---|---|---|
| Scopolamine | ||||||
| Furey et al in press (68) | fMRI BOLD + face-identify and face-emotion working memory tasks | MDD (N=15; 11 male, 4 female, mean age 32.9 years); outpatients; drug-free for 3 weeks prior to study drug. Double blind, placebo controlled design. Inclusion: MADRS ≥20 (mean MADRS baseline 30) Comorbidity permitted except for current nicotine use, lifetime history of substance dependence, or substance abuse within 1 year |
i.v. 4ug/kg | MADRS | Antidepressant response at first post-drug assessment (3–5 days after infusion) (p<0.001; mean decrease in MADRS from baseline to study end 63±29%) | Baseline BOLD response in bilateral middle occipital cortex, selectively during the stimulus processing components of the emotion WM task (no significant correlation during the identity task), correlated with treatment response magnitude. Change in BOLD following scopolamine in the same middle occipital areas while performing the same task conditions also correlated with clinical response. |
| Furey et al 2012 (69) | Self-rating mood scales | MDD (N=37) and BD (N=14); outpatients; drug-free for 3 weeks prior to study drug. Double blind, placebo controlled design. Inclusion: MADRS ≥20 (mean MADRS baseline 30) Comorbidity permitted except for current nicotine use, lifetime history of substance dependence, or substance abuse within 1 year |
i.v. 4ug/kg | MADRS | Antidepressant response at first post-drug assessment (3–5 days after infusion) (p<0.001; mean decrease in MADRS from baseline to study end 63±29%) | Baseline self-rating mood scales (POMS and VAS) separated responders from non-responders in a discriminant function; the discriminant function also classified over 85% of patients as responders/non-responders |
| Ketamine | ||||||
| Cornwell et al 2012 (97) | MEG recording+ passive tactile stimulation (baseline and 6–7 hrs following ketamine) | MDD (N=22; 15 male, 5 female, mean age 46 years); TRD inpatients; drug-free for 2 weeks prior to study drug Inclusion: MADRS ≥22 (mean MADRS baseline 33) Comorbidity permitted except for drug or alcohol dependence or abuse in the last 3 months: |
Ketamine 0.5 mg/kg i.v. infusion over 40 minutes | MADRS | MADRS significantly improved at all time points prior and at 230 min post-infusion (p<0.001); responders: (≥50% in MADRS scores at 230 min post-infusion (n=9); non-responders (<50% improvement) (n=11). | Patients with robust improvements in depressive symptoms 230 min after infusion (responders) exhibited increased cortical excitability. Stimulus-evoked somatosensory cortical responses increase after infusion, relative to pretreatment responses in responders but not in treatment non-responders. |
| Duncan et al 2012 (49) | EEG sleep recordings SWA, EEG activity (between 1 and Hz) day before, day of infusion and day after ketamine infusion; BDNF plasma (before infusion and at 230 min post-infusion) | MDD (N=30; 20 male, 10 female, mean age 48 years); TRD inpatients; drug-free for 2 weeks prior to study drug Inclusion: MADRS ≥22 (mean MADRS baseline 32.5) Comorbidity permitted except for drug or alcohol dependence or abuse in the last 3 months |
Ketamine 0.5 mg/kg i.v. infusion over 40 minutes | MADRS | Percent change in MADRS improvement at 230 min post-infusion (−41.46±6.62%; p<0.00001), at 1 d post-infusion (−40.38±6.61%; p<0.00001) and at 2 d post-infusion (−39.75±6.54%; p<0.00001). Responders: (≥50% in MADRS scores at 230 min post-infusion (n=13); non-responders (<50% improvement) (n=17). | Compared to baseline, BDNF levels and early sleep SWA (during the first non-REM episode) increased after ketamine. Changes in BDNF levels were proportional to changes in SWA parameters. This link was present only in patients who responded to ketamine treatment, suggesting that enhanced synaptic plasticity – as reflected by increased SWA, individual slow wave parameters and plasma BDNF – is part of the physiological mechanism underlying ketamine’s antidepressant effects |
| Duncan et al 2012 (98) | EEG sleep recordings (DSR); DSR was calculated as the quotient of normalized SWA in the first to the second NREM episode | MDD (N=30; 20 male, 10 female, mean age 47 years); TRD inpatients; drug-free for 2 weeks prior to study drug Inclusion: MADRS ≥22 (mean MADRS baseline 33) Comorbidity permitted except for drug or alcohol dependence or abuse in the last 3 months |
Ketamine 0.5 mg/kg i.v. infusion over 40 minutes | MADRS | Responders: (≥50% in MADRS scores at 230 min post-infusion (n=12); non-responders (<50% improvement) (n=18). | A significant positive correlation was observed between baseline DSR and reduced MADRS scores from baseline to Day 1 (p=.02). After dividing the patient group based on a threshold DSR ≤ 1 (SWANREM1 = SWANREM2), MADRS ratings over seven days showed a significant interaction between patients with low and high DSR scores (p=.015). Individuals with low DSR scores showed a greater and more sustained clinical improvement than individuals with higher DSR scores. |
| Zarate et al 2012 (99) | 1) Plasma concentrations of ketamine and its metabolites: NK, DHNK, HNK, and HK 2) Cytochrome P450 enzymes: CYP2A6, CYP2B6, CYP2C9, CYP2C19, CYP3A4, and CYP3A5 |
N=76, MDD 45 [male 28], BD 22 [male 6], mean age 46 y); TRD inpatients; MDD drug-free for 2 weeks prior to study drug; BD only on lithium or valproate; MADRS ≥22 (mean MADRS baseline MDD =33, BD =32). Comorbidity permitted except for drug or alcohol dependence or abuse in the last 3 months | Ketamine 0.5 mg/kg i.v. infusion over 40 minutes | MADRS, BPRS, CADSS | Percent change in MADRS at 230 min post-infusion MDD (−37.3±32.1), BD (−46.5±33.6) | Ketamine, NK, DHNK, four of six HNKs, and HK were present during the first 230 minutes post-infusion. Patients with BD had higher plasma concentrations of DHNK, (2S,6S;2R,6R)-HNK, (2S,6R;2R,6S)-HNK, and (2S,5S;2R,5R)-HNK than patients with MDD, who, in turn, had higher concentrations of (2S,6S;2R,6R)-HK. Higher (2S,5S;2R,5R)- HNK concentrations were associated with non-response to ketamine in BD patients. DHNK, HNK4c, and HNK4f levels were significantly negatively correlated with psychotic and dissociative symptoms at 40 min. P450 genes were not associated with response. |
| Salvadore et al 2011 (44) | 1H-MRS (GABA, glutamate, Glx/glutamate ratio) 1–3 days pre-treatment with ketamine; regions: DM/DA- PFC; VM-PFC | MDD (N=14; 9 male, 5 female, mean age 50 years); TRD inpatients; drug-free for 2 weeks prior to study drug Inclusion: MADRS ≥22 (mean MADRS baseline 33.4) Comorbidity permitted except for drug or alcohol dependence or abuse in the last 3 months |
Ketamine 0.5 mg/kg i.v. infusion over 40 minutes | MADRS, HAM-A | Pre-treatment MADRS score was 33.4±5.9, and the mean MADRS score 230 min after ketamine was 25.1±11; p=0.006); HAM-A pretreatment score: 20.9±4.1; mean HAM-A score 230 min after ketamine: 13.64±4.5; p≤0.001) | Pretreatment GABA and glutamate concentrations did not correlate with improvement of depressive symptoms in either region of interest. Pretreatment Glx/glutamate ratio in the DM/DA PFC was negatively correlated with clinical improvement to ketamine (p=0.04). Ketamine was associated with a significant improvement HAM-A scores (p≤0.001; pretreatment mean HAM-A: 20.9±4.1; mean HAM-A score 230 min after ketamine: 13.64±4.5). Glutamate levels in the VM voxel revealed a significant association with reduction in anxiety symptoms 230 min after ketamine administration [p=0.042]. Twenty-four hours post-infusion, no significant correlation with change in MADRS score was observed. |
| Salvadore et al 2010 (41) | MEG recordings + working memory task 1–3 days pre-treatment with ketamine; regions: pgACC, amygdala and long-range connectivity between these regions | MDD (N=14; 9 male, 5 female, mean age 50 years); TRD inpatients; drug-free for 2 weeks prior to study drug Inclusion: MADRS ≥22 (mean MADRS baseline 33). Comorbidity permitted except for drug or alcohol dependence or abuse in the last 3 months |
Ketamine 0.5 mg/kg i.v. infusion over 40 minutes | MADRS, HAM-A | Pre-treatment MADRS score was 33.5±4.9, and the mean MADRS score 230 min after ketamine was 21.0±11.6; p=0.006); HAM-A pretreatment score: 23.8±5.7; mean HAM-A score 230 min after ketamine: 13.64±5.4; p≤0.001) | Patients who showed the least engagement of the pgACC in response to increased working memory load showed the greatest symptomatic improvement within 4 hrs of ketamine administration (r=0.82, p=0.0002). Pretreatment functional connectivity between the pgACC and the left amygdala was negatively correlated with antidepressant (r=−0.73, p=0.0021) and anti-anxiety symptom change. |
| Machado-Vieira et al 2009 (100) | BDNF plasma levels at baseline, 40, 80, 110 and 230 minutes post-infusion | MDD (N=23; 14 male, 9 female, mean age 43.9 years); TRD inpatients; drug-free for 2 weeks prior to study drug Inclusion: MADRS ≥22 (mean MADRS baseline 33.5) Comorbidity permitted except for drug or alcohol dependence or abuse in the last 3 months |
Ketamine 0.5 mg/kg i.v. infusion over 40 minutes | MADRS | Significant decrease in MADRS scores from baseline to 230 minutes post-infusion (p<.001); Responders: (≥50% in MADRS scores at 230 min post-infusion (n=11); non-responders (<50% improvement) (n=12). | No significant changes in BDNF levels were observed in subjects after they received ketamine compared to baseline. No association was found between antidepressant response and BDNF levels |
| Phelps et al 200(56) | Family history of alcoholism | MDD (N=26; 14 male, 12 female, mean age 43.5 years); TRD inpatients drug-free for 2 weeks prior to study drug. Inclusion: MADRS ≥22 (mean MADRS baseline 32.8) Comorbidity permitted except for drug or alcohol dependence or abuse in the last 3 months; family history collected by FIGS; FHP was defined here as the presence of at least one affected first-degree relative or at least two second-degree relatives. Individual histories of alcohol abuse or dependence were determined by SCID. |
Ketamine 0.5 mg/kg i.v. infusion over 40 minutes | MADRS, HAM-D, BPRS, CADSS, BDI | Response (MADRS: 50% decrease) 43%; 12 were FHP, 14 were FHN | Subjects with an FHP showed significantly greater improvement in MADRS scores compared with subjects who had no FHP. The FHP group had a significantly higher response rate (67%) than the FHN group (18%; p = .02). The FHP group had significantly lower MADRS scores at 120 min ketamine post-infusion. HAM-D and BDI confirmed these results, showing significant differences between the FHP and FHN groups from 80 to 230 min. Significant interactions between group and time were present for both measures (HDRS: p= .047; BDI: p =.03) |
| Salvadore et al 2009 (40) | MEG recordings + fearful faces task 1–3 days pre-treatment with ketamine; regions: pgACC | MDD (N=11; 7 male, 4 female, mean age 44 years); TRD inpatients; drug-free for 2 weeks prior to study drug Inclusion: MADRS ≥22 (mean MADRS baseline 32) Comorbidity permitted except for drug or alcohol dependence or abuse in the last 3 months; 11 healthy controls |
Ketamine 0.5 mg/kg i.v. infusion over 40 minutes | MADRS, HAM-A | Pre-treatment MADRS score was 31.9±3.3, and the mean MADRS score 230 min after ketamine was 20.4±1.2; p=0.005); HAM-A pretreatment score: 23.4±6.5; mean HAM-A score 230 min after ketamine: 14.3±7.8; p≤0.01) | Patients with MDD compared to healthy controls showed robust increases in pre-treatment ACC activity; this increase was positively correlated with subsequent antidepressant response to ketamine (p<.05). Exploratory analyses showed that pretreatment right amygdala activity was negatively correlated with change in depressive symptoms (p<.05) |
Abbreviations:
ACC = anterior cingulate cortex; BD = bipolar disorder; BDI = Beck Depression Inventory; BDNF = brain-derived neurotrophic factor; BOLD = Blood oxygen level dependent; BPRS = Brief Psychiatric Rating Scale; CADSS = Clinician Administered Dissociative States Scale; CES-D = Center for Epidemiological Studies Depression Scale; DHNK = dehydronorketamine; DM/DA – PFC = dorsomedial/dorsal anterolateral prefrontal cortex; DSR = delta sleep ratio; EEG = electroencephalogram; FHN = no family history of alcohol dependence; FHP = positive family history of alcohol dependence; FIGS = Family Interview for Genetic Studies; fMRI = functional magnetic resonance imaging; GABA = gamma aminobutyric acid; Glx = sum-peak of glutamate, glutamine and GABA; HAM-A = Hamilton Anxiety Rating Scale; HDRS/HAM-D = Hamilton Depression Rating Scale; HK = hydroxyketamine; HNK= hydroxynorketamine; MADRS = Montgomery Åsberg Depression Rating Scale; MDD = major depressive disorder; MEG = magnetoencephalography; MRS = magnetic resonance spectroscopy; NK = norketamine; NREM = non rapid eye movement; pgACC = pregenual anterior cingulate cortex; POMS = Profiles of Mood State; SCID = Structured Clinical Interview for DSM-IV; SWA = slow wave activity; TRD = treatment-resistant depression; VAS = visual analogue scale; VM-PFC = ventromedial prefrontal cortex; 1H-MRS = proton magnetic resonance spectroscopy
Ketamine: Genetics
The Val66Met SNP has been linked to psychiatric disorders and impaired trafficking/regulation of BDNF (36). Animal studies found that Val/Val mice exhibited increased antidepressant response to ketamine (and PFC synaptogenesis) (37). Building on this work, one recent study (n = 62) evaluated whether rs6265 (Val66Met SNP) was associated with ketamine response in patients with MDD. Results showed that patients with the Val/Val BDNF allele were more likely to have an increased antidepressant response to ketamine than Met carriers (38).
Ketamine: Functional Neuroimaging
Salvadore and colleagues used magnetoencephalography (MEG) to measure response to fearful faces in the rostral ACC (rACC) in drug-free patients with MDD. As noted earlier, higher pretreatment ACC metabolism predicted antidepressant response to both SD and some antidepressant treatments (39). This MEG study demonstrated that higher pretreatment levels of rACC activity correlated positively with the magnitude of subsequent antidepressant response to ketamine (four hours later), with healthy individuals displaying lower activity in this region (40).
Similarly, a working memory task (N-back task) was administered to drug-free patients with MDD during MEG recordings. One to three days after scanning, subjects received an infusion of ketamine or saline in a cross-over design. Participants with the least engagement of the pgACC as working memory load increased (pretreatment) showed the greatest symptomatic improvement within four hours of ketamine administration. In addition, pretreatment levels of functional connectivity between the pgACC and left amygdala correlated negatively with antidepressant response to ketamine. Taken together, these studies suggest that high pgACC response to emotionally salient stimuli, but low pgACC response to increased cognitive demands, predicts antidepressant response to ketamine (41). Given that these studies are congruent with the extant literature supporting the role of ACC activity as a promising predictor of antidepressant response, it appears that pretreatment ACC activity may be a putative biomarker of treatment response to antidepressant interventions with different mechanisms of action (42).
Lastly, a proton MRS study was conducted to predict treatment outcome following ketamine administration, given that GABA and Glx levels are reduced in the medial and dorsal anterolateral prefrontal cortices of patients with MDD (43). Correlation analyses were conducted to determine whether pretreatment levels of GABA, glutamate, and Glx/glutamate ratio would predict changes in depressive or anxiety symptoms 230 minutes post-ketamine administration in the ventromedial prefrontal cortex (VM-PFC) and the dorsomedial/dorsal anterolateral prefrontal cortex (DM/DA-PFC). Pretreatment Glx/glutamate ratio in the DM/DA-PFC was found to negatively correlate with improvement. Because the Glx/glutamate ratio is altered by changes in glutamine, the authors suggested that MDD patients who show the greatest clinical improvement with ketamine may be characterized by larger reductions in glial concentrations (44). This hypothesis is supported by post-mortem studies that found prominent reductions in glial pathology in MDD patients (45). Thus, glial cellular deficits may serve as unique targets for novel strategies in the treatment of MDD.
Ketamine: Sleep Architecture
As noted earlier, decreased slow wave sleep is a prominent feature of depression. A recent study of patients with treatment-resistant MDD investigated the acute effects of ketamine on depressive symptoms relative to EEG SWA, individual slow wave parameters, and plasma BDNF (230 minutes post infusion). Prior research had shown that SWA and individual slow wave parameters are sensitive markers of cortical synaptic strength, thus serving as surrogate markers of central synaptic plasticity (46, 47). In this study, early sleep SWA (during the first non-REM episode) and BDNF levels increased compared to baseline. Those patients that responded to ketamine had changes in BDNF proportional to changes in EEG parameters (48), although the study was limited by the lack of a placebo control.
Baseline delta sleep ratios (DSR) have also been examined as putative predictors of rapid antidepressant response to ketamine. DSR is defined by the ratio of SWA between the first two non-REM sleep episodes and is lower in depressed patients than healthy controls. A significant positive correlation was found between baseline DSR and reduced Montgomery–Åsberg Depression Rating Scale (MADRS) scores from baseline to Day 1, post-ketamine infusion (49). Low baseline DSR scores also predicted an improved response the following week, suggesting that Day 1 ratings preceded a more sustained treatment response. Interestingly, these effects are similar to those seen following antidepressant treatment in general, which normalizes slow wave sleep and DSR (50, 51), suggesting that DSR may reflect a biomarker of response to ketamine (49).
Ketamine: Clinical Predictors
While clinical predictors of antidepressant response may not represent biological markers directly, they facilitate the identification of patient subgroups that differentially respond to treatment, which can subsequently guide additional research aimed at identifying viable biological markers.
Data from the Sequenced Treatment Alternatives to Relieve Depression (STAR*D) study showed that 46% of participants had a positive family history of substance abuse (52). Recent research has implicated the glutamatergic system in the pathogenesis of alcohol dependence (53). Ethanol inhibits the functioning of NMDA subunit receptors (54), and healthy individuals with a positive family history of alcohol dependence (FHP) show a diminished response to the psychotomimetic effects of ketamine compared to those without a positive family history (FHN) (55).
Phelps and colleagues showed that MDD patients with a FHP had a higher response rate (67%) to ketamine (230 mins post-infusion) than FHN patients (18%). Moreover, the FHP group had fewer dysphoric symptoms than the FHN group (56). A recent post-hoc analysis of BD-I or II subjects pooled from two randomized and placebo controlled studies (57, 58) showed that compared to those with FHN, subjects with FHP had attenuated psychotomimetic and dissociative scores (but not dysphoria) in response to ketamine, and had greater improvement on MADRS scores up to three days post-infusion.
Overall, familial and epigenetic mechanisms may explain the relationship between FHP and ketamine response. Likewise, a genetic variation in the NR2A subunit may be involved in susceptibility to alcohol dependence (59), suggesting a neurobiological subtype that could modulate ketamine response. Future prospective studies will explore these exciting associations.
Scopolamine
The muscarinic receptors of the cholinergic neurotransmitter system were implicated in mood disorders as early as the 1970s (60) when researchers demonstrated that muscarinic receptors were hyper-sensitive in MDD and BD, but were only recently shown to be a viable antidepressant target (61). Randomized, controlled clinical trials found that the anti-muscarinic agent scopolamine had rapid antidepressant effects in MDD and BD patients (61) (see Table 2). As with ketamine, the rapid clinical improvement observed offers the opportunity to efficiently evaluate potential biomarkers of response. Moreover, the identification of biomarkers that predict response to scopolamine may provide important insights regarding underlying mechanisms of antidepressant action and contributes to the overall development of more rapid and effective therapeutic options.
Scopolamine: Genetics
Several genes associated with the cholinergic system have been implicated in mood disorders. The cholinergic muscarinic-2 receptor gene (CHRM2) has been linked to risk of developing depression (62), and the distribution volume of this receptor is reduced in BD (63). Recently, Cannon and colleagues evaluated the influence of six SNPs for CHROM2 on M2-receptor binding and found an allelic effect on distribution volume of the M2 receptor in the pre-genual and sub-genual areas of the ACC in patients with BD versus healthy controls (64). Moreover, genotype was related to severity of illness (64). These studies identified genetic cholinergic markers in mood disorders that are ideal candidates to evaluate as potential predictors of treatment response to scopolamine.
Scopolamine: Functional Neuroimaging
The cholinergic system is also centrally implicated in cognition (65), and the existing pharmaco-imaging literature on cholinergic function during cognitive tasks highlights the potential for cognitive studies in patients with cholinergic dysfunction to be informative. Cholinergic activity has been hypothesized to act via stimulus processing mechanisms (reviewed in (66)), and thus cholinergic function/dysfunction likely influences cognition by modifying neural representations of stimuli (66). The best-characterized cognitive feature in mood disorders is described as a negative stimulus processing bias, where negative emotional stimuli are processed preferentially over positive emotional stimuli (66, 67). The excessive cholinergic activity in mood disorders may underlie this negative processing bias (66), and thus assessment of the negative processing bias may provide a potential biological marker of treatment response to scopolamine.
A working memory task was used to determine if neural activity in response to emotional information during visual stimulus processing could predict subsequent clinical response to scopolamine (68). Participants viewed emotional faces, attending to either facial identity or facial emotion during working memory as neural response was assessed based on MRI blood-oxygen-level-dependent (BOLD) signal. Pre-treatment levels of neural response in the visual processing area of middle occipital cortex (MOC) when patients attended to facial emotion correlated with subsequent treatment response. Critically, no correlation emerged when patients were processing the same stimuli while attending to acial identity, emphasizing the selectivity of this effect to emotion processing (68).
A selective attention task using emotional faces (happy and sad) was also used to determine if pre-treatment BOLD response could predict treatment outcome to scopolamine in patients with MDD. Here, patients were presented with two pictures comprising superimposed images of faces (happy or sad) and houses, and were instructed to selectively attend to either the face or house stimulus component and perform a matching task. The magnitude of treatment response following scopolamine was correlated with difference in BOLD response magnitude to emotional faces (happy vs. sad) when attending to faces (explicit emotional processing) and when attending to houses (implicit emotional processing). Significant correlations were observed during implicit processing in the MOC and ACC (69). No correlation was observed with the explicit emotional processing condition, again highlighting the selectivity of this effect. Taken together, these fMRI finding may indicate that the level of underlying cholinergic dysfunction in MDD is expressed in baseline levels of neural response to emotional information, and that this underlying level of cholinergic dysfunction represents a biomarker for subsequent response to scopolamine.
Scopolamine: Sleep Architecture
As described above, patterns of sleep dysfunction in mood disorders includes increased REM density and reduced REM latency, both of which could be explained by increased muscarinic sensitivity (70). While these features of sleep architecture have yet to be evaluated as potential biomarkers for response to scopolamine, the implication of cholinergic dysfunction in these basic sleep features of mood disorders renders them targets of high interest.
Scopolamine: Clinical Predictors
Identifying clinical subtypes that respond differentially to antidepressant treatments has been a focus in psychiatric research. Diagnostic subtypes of primary mood disorders (MDD vs BD) show similar magnitudes of treatment response to scopolamine as do patients with and without a co-morbid anxiety disorder (61). A differential response based on gender is reported (71) with women showing greater improvement following scopolamine than men.
In an effort to identify subgroups that might preferentially respond to scopolamine, baseline self-rating scales (Profile of Mood States (POMS) and Visual Analogue Scale (VAS)) were submitted to discriminant function analysis. This analysis separated treatment responders from non-responders for both MDD and BD subgroups, and the discriminant function accurately classified over 85% of participants. These findings indicate that the relative pattern of scores on these specific mood scales may reflect features of patient subgroups that preferentially respond to scopolamine, and suggest that self-rating mood scales have the potential to predict treatment response to scopolamine in individual patients (69).
Conclusion
This article provides an overview of biomarkers associated with treatments that produce rapid antidepressant effects. These findings offer tremendous hope that eventually we will be able to successfully apply these techniques to clinical populations.
The fields of psychiatry and neuroscience have made sufficient progress that we now can begin to ask questions regarding what has been learned, and how this knowledge can guide further research. One important question is what biomarkers of treatment response can teach us about specific therapeutic agents. Relatedly, will their predictive ability generalize across antidepressant options? For instance, ACC function was identified as a biomarker for each of the antidepressant methods discussed in this review, and has been identified in association with other treatments as well (42). While the answer to this question remains empirical, the growing body of literature would argue for ongoing consideration of this particular brain region as a generalized biomarker of antidepressant response. In contrast, we do not have sufficient data to address some important questions, such as the differential benefit of biomarkers based on diagnostic features; we anticipate that this will be possible in the future.
Treatment-specific biomarkers may also be expected. Because patient response to treatment is quite variable, and because this variability may reflect differences in underlying pathophysiology, some biomarkers may reflect the likelihood of response to specific agents. For example, carriers of the COMT Val/Val genotype showed a reduced antidepressant response to SD relative to other genotypes, while the BDNF Val/Val genotype was associated with larger responses to ketamine. In addition, the MOC may prove to be specific to antimuscarinic treatments, as this finding may be related specifically to cholinergic dysfunction in the processing of emotional stimuli. Such biomarkers may prove to be extremely useful in clinical decisions related to the application of specific agents.
Finally, these findings may promote various targets as viable markers of treatment response. The biomarkers identified to date encompass aspects of known underlying dysfunction in mood disorders. The ACC and the amygdala are brain areas that show functional and structural abnormalities in mood disorders. Genes associated with illness vulnerability and features of SD that characterize mood disorders have been identified as biomarkers of treatment response. Thus, focusing on targets that encompass known aspects of underlying neurobiological dysfunction has proven to be highly successful, and this knowledge can continue to guide research.
As research efforts work to improve treatments for patients with mood disorders, we should consider broader directions for the future. For example, the field may benefit from the testing of biomarkers within the context of multiple treatments to determine if individual markers will be generalizable or treatment-specific. As Figure 1 and Table S2 (in Supplement 1) highlight, the biomarkers with the largest effect sizes could then be incorporated into larger prospective studies. This would lead to more efficient trial designs, where patients could be randomized by “efficacy stratifying biomarkers”. Furthermore, promising biomarkers may lead to new therapeutics in a fashion similar to the field of cardiovascular drug delivery, where lipid biomarkers play a role in both phenotyping disease processes and developing parallel therapeutic strategies (72). Moving in such directions would ultimately facilitate the development of personalized treatment, increasing the probability of success. While significant challenges to applying this paradigm in clinical settings and altering current practices lie ahead, this is a goal worth pursuing to promote better patient care.
Supplementary Material
Acknowledgments
Funding:
Funding for this work was supported by the Intramural Research Program at the National Institute of Mental Health, National Institutes of Health, and Department of Health & Human Services (IRP-NIMH-NIH-DHHS), by a NARSAD Independent Investigator to CAZ, and by the Brain & Behavior Mood Disorders Research Award to CAZ. A patent application for the use of ketamine in depression has been submitted listing CAZ among the inventors; he has assigned his rights on the patent to the U.S. government, but will share a percentage of any royalties that may be received by the government. A patent application for the use of scopolamine in depression has been submitted listing MLF among the inventors; she has assigned her rights on the patent to the U.S. government, but will share a percentage of any royalties that may be received by the government.
The authors gratefully acknowledge the support of the Intramural Research Program at the National Institute of Mental Health, National Institutes of Health, and Department of Health & Human Services (IRP-NIMH-NIH-DHHS). Ioline Henter provided excellent editorial assistance.
Abbreviations
- fMRI
functional magnetic resonance imaging
- MEG
magnetoencephalography
- PSG
polysomnography
- BDNF
brain-derived neurotrophic factor
- SNP
single nucleotide polymorphism
- mTOR
mammalian target of rapamycin
- eEF2K
eukaryotic elongation factor 2 kinase
Footnotes
Disclosures:
DCM reports no biomedical financial interests or potential conflicts of interest.
Publisher's Disclaimer: This is a PDF file of an unedited manuscript that has been accepted for publication. As a service to our customers we are providing this early version of the manuscript. The manuscript will undergo copyediting, typesetting, and review of the resulting proof before it is published in its final citable form. Please note that during the production process errors may be discovered which could affect the content, and all legal disclaimers that apply to the journal pertain.
References
- 1.Moussavi S, Chatterji S, Verdes E, Tandon A, Patel V, Ustun B. Depression, chronic diseases, and decrements in health: results from the World Health Surveys. Lancet. 2007;370:851–858. doi: 10.1016/S0140-6736(07)61415-9. [DOI] [PubMed] [Google Scholar]
- 2.Ledford H. Translational research: 4 ways to fix the clinical trial. Nature. 2011;477:526–528. doi: 10.1038/477526a. [DOI] [PubMed] [Google Scholar]
- 3.Atkinson AJ, Jr, Colburn WA, DeGruttola VG, DeMets DL, Downing GJ, Hoth DF, et al. Biomarkers and surrogate endpoints: preferred definitions and conceptual framework. Clin Pharmacol Ther. 2001;69:89–95. doi: 10.1067/mcp.2001.113989. [DOI] [PubMed] [Google Scholar]
- 4.Leuchter AF, Cook IA, Hamilton SP, Narr KL, Toga A, Hunter AM, et al. Biomarkers to predict antidepressant response. Curr Psychiatry Rep. 2010;12:553–562. doi: 10.1007/s11920-010-0160-4. [DOI] [PMC free article] [PubMed] [Google Scholar]
- 5.Benedetti F, Colombo C. Sleep deprivation in mood disorders. Neuropsychobiology. 2011;64:141–151. doi: 10.1159/000328947. [DOI] [PubMed] [Google Scholar]
- 6.Wu JC, Bunney WE. The biological basis of an antidepressant response to sleep deprivation and relapse: review and hypothesis. Am J Psychiatry. 1990;147:14–21. doi: 10.1176/ajp.147.1.14. [DOI] [PubMed] [Google Scholar]
- 7.Schilgen B, Tolle R. Partial sleep deprivation as therapy for depression. Arch Gen Psychiatry. 1980;37:267–271. doi: 10.1001/archpsyc.1980.01780160037003. [DOI] [PubMed] [Google Scholar]
- 8.Mann JJ, Brent DA, Arango V. The neurobiology and genetics of suicide and attempted suicide: a focus on the serotonergic system. Neuropsychopharmacology. 2001;24:467–477. doi: 10.1016/S0893-133X(00)00228-1. [DOI] [PubMed] [Google Scholar]
- 9.Popa D, Lena C, Fabre V, Prenat C, Gingrich J, Escourrou P, et al. Contribution of 5-HT2 receptor subtypes to sleep-wakefulness and respiratory control, and functional adaptations in knock-out mice lacking 5-HT2A receptors. J Neurosci. 2005;25:11231–11238. doi: 10.1523/JNEUROSCI.1724-05.2005. [DOI] [PMC free article] [PubMed] [Google Scholar]
- 10.Kang RH, Choi MJ, Paik JW, Hahn SW, Lee MS. Effect of serotonin receptor 2A gene polymorphism on mirtazapine response in major depression. Int J Psychiatry Med. 2007;37:315–329. doi: 10.2190/PM.37.3.h. [DOI] [PubMed] [Google Scholar]
- 11.Benedetti F, Barbini B, Bernasconi A, Fulgosi MC, Colombo C, Dallaspezia S, et al. Serotonin 5-HT2A receptor gene variants influence antidepressant response to repeated total sleep deprivation in bipolar depression. Prog Neuropsychopharmacol Biol Psychiatry. 2008;32:1863–1866. doi: 10.1016/j.pnpbp.2008.08.017. [DOI] [PubMed] [Google Scholar]
- 12.Nutt DJ. The role of dopamine and norepinephrine in depression and antidepressant treatment. J Clin Psychiatry. 2006;67:3–8. [PubMed] [Google Scholar]
- 13.Benedetti F, Colombo C, Pirovano A, Marino E, Smeraldi E. The catechol-O-methyltransferase Val(108/158)Met polymorphism affects antidepressant response to paroxetine in a naturalistic setting. Psychopharmacology (Berl) 2009;203:155–160. doi: 10.1007/s00213-008-1381-7. [DOI] [PubMed] [Google Scholar]
- 14.Tsai SJ, Gau YT, Hong CJ, Liou YJ, Yu YW, Chen TJ. Sexually dimorphic effect of catechol-O-methyltransferase val158met polymorphism on clinical response to fluoxetine in major depressive patients. J Affect Disord. 2009;113:183–187. doi: 10.1016/j.jad.2008.04.017. [DOI] [PubMed] [Google Scholar]
- 15.Benedetti F, Smeraldi E. Neuroimaging and genetics of antidepressant response to sleep deprivation: implications for drug development. Curr Pharm Des. 2009;15:2637–2649. doi: 10.2174/138161209788957447. [DOI] [PubMed] [Google Scholar]
- 16.Wu JC, Gillin JC, Buchsbaum MS, Schachat C, Darnall LA, Keator DB, et al. Sleep deprivation PET correlations of Hamilton symptom improvement ratings with changes in relative glucose metabolism in patients with depression. J Affect Disord. 2008;107:181–186. doi: 10.1016/j.jad.2007.07.030. [DOI] [PubMed] [Google Scholar]
- 17.Benca RM, Obermeyer WH, Thisted RA, Gillin JC. Sleep and psychiatric disorders. A meta-analysis. Arch Gen Psychiatry. 1992;49:651–668. doi: 10.1001/archpsyc.1992.01820080059010. discussion 669–670. [DOI] [PubMed] [Google Scholar]
- 18.Duncan WC, Jr, Pettigrew KD, Gillin JC. REM architecture changes in bipolar and unipolar depression. Am J Psychiatry. 1979;136:1424–1427. doi: 10.1176/ajp.136.11.1424. [DOI] [PubMed] [Google Scholar]
- 19.Doerr JP, Hirscher V, Riemann D, Voderholzer U. Disturbances of slow-wave sleep and psychiatric disorders. Nervenarzt. 2010;81:347–354. doi: 10.1007/s00115-009-2897-8. [DOI] [PubMed] [Google Scholar]
- 20.Duncan WC, Jr, Gillin JC, Post RM, Gerner RH, Wehr TA. Relationship between EEG sleep patterns and clinical improvement in depressed patients treated with sleep deprivation. Biol Psychiatry. 1980;15:879–889. [PubMed] [Google Scholar]
- 21.Nissen C, Feige B, Konig A, Voderholzer U, Berger M, Riemann D. Delta sleep ratio as a predictor of sleep deprivation response in major depression. J Psychiatr Res. 2001;35:155–163. doi: 10.1016/s0022-3956(01)00021-8. [DOI] [PubMed] [Google Scholar]
- 22.Landsness EC, Goldstein MR, Peterson MJ, Tononi G, Benca RM. Antidepressant effects of selective slow wave sleep deprivation in major depression: a high-density EEG investigation. J Psychiatr Res. 2011;45:1019–1026. doi: 10.1016/j.jpsychires.2011.02.003. [DOI] [PMC free article] [PubMed] [Google Scholar]
- 23.Autry AE, Monteggia LM. Brain-derived neurotrophic factor and neuropsychiatric disorders. Pharmacol Rev. 2012;64:238–258. doi: 10.1124/pr.111.005108. [DOI] [PMC free article] [PubMed] [Google Scholar]
- 24.Castren E, Rantamaki T. The role of BDNF and its receptors in depression and antidepressant drug action: Reactivation of developmental plasticity. Dev Neurobiol. 2010;70:289–297. doi: 10.1002/dneu.20758. [DOI] [PubMed] [Google Scholar]
- 25.Brunoni AR, Lopes M, Fregni F. A systematic review and meta-analysis of clinical studies on major depression and BDNF levels: implications for the role of neuroplasticity in depression. Int J Neuropsychopharmacol. 2008;11:1169–1180. doi: 10.1017/S1461145708009309. [DOI] [PubMed] [Google Scholar]
- 26.Cirelli C, Tononi G. Gene expression in the brain across the sleep-waking cycle. Brain Res. 2000;885:303–321. doi: 10.1016/s0006-8993(00)03008-0. [DOI] [PubMed] [Google Scholar]
- 27.Gorgulu Y, Caliyurt O. Rapid antidepressant effects of sleep deprivation therapy correlates with serum BDNF changes in major depression. Brain Res Bull. 2009;80:158–162. doi: 10.1016/j.brainresbull.2009.06.016. [DOI] [PubMed] [Google Scholar]
- 28.Ibrahim L, Duncan W, Luckenbaugh DA, Yuan P, Machado-Vieira R, Zarate CA., Jr Rapid antidepressant changes with sleep deprivation in major depressive disorder are associated with changes in vascular endothelial growth factor (VEGF): a pilot study. Brain Res Bull. 2011;86:129–133. doi: 10.1016/j.brainresbull.2011.06.003. [DOI] [PMC free article] [PubMed] [Google Scholar]
- 29.Sanacora G, Treccani G, Popoli M. Towards a glutamate hypothesis of depression: an emerging frontier of neuropsychopharmacology for mood disorders. Neuropharmacology. 2012;62:63–77. doi: 10.1016/j.neuropharm.2011.07.036. [DOI] [PMC free article] [PubMed] [Google Scholar]
- 30.Berman RM, Cappiello A, Anand A, Oren DA, Heninger GR, Charney DS, et al. Antidepressant effects of ketamine in depressed patients. Biol Psychiatry. 2000;47:351–354. doi: 10.1016/s0006-3223(99)00230-9. [DOI] [PubMed] [Google Scholar]
- 31.Zarate CA, Jr, Singh JB, Carlson PJ, Brutsche NE, Ameli R, Luckenbaugh DA, et al. A randomized trial of an N-methyl-D-aspartate antagonist in treatment-resistant major depression. Arch Gen Psychiatry. 2006;63:856–864. doi: 10.1001/archpsyc.63.8.856. [DOI] [PubMed] [Google Scholar]
- 32.Yuksel C, Ongur D. Magnetic resonance spectroscopy studies of glutamate-related abnormalities in mood disorders. Biol Psychiatry. 2010;68:785–794. doi: 10.1016/j.biopsych.2010.06.016. [DOI] [PMC free article] [PubMed] [Google Scholar]
- 33.Michael N, Erfurth A, Ohrmann P, Arolt V, Heindel W, Pfleiderer B. Neurotrophic effects of electroconvulsive therapy: a proton magnetic resonance study of the left amygdalar region in patients with treatment-resistant depression. Neuropsychopharmacology. 2003;28:720–725. doi: 10.1038/sj.npp.1300085. [DOI] [PubMed] [Google Scholar]
- 34.Aan Het Rot M, Zarate CA, Jr, Charney DS, Mathew SJ. Ketamine for Depression: Where Do We Go from Here? Biol Psychiatry. 2012;15:15. doi: 10.1016/j.biopsych.2012.05.003. [DOI] [PMC free article] [PubMed] [Google Scholar]
- 35.Mathews DC, Henter ID, Zarate CA. Targeting the glutamatergic system to treat major depressive disorder: rationale and progress to date. Drugs. 2012;72:1313–1333. doi: 10.2165/11633130-000000000-00000. [DOI] [PMC free article] [PubMed] [Google Scholar]
- 36.Egan MF, Kojima M, Callicott JH, Goldberg TE, Kolachana BS, Bertolino A, et al. The BDNF val66met polymorphism affects activity-dependent secretion of BDNF and human memory and hippocampal function. Cell. 2003;112:257–269. doi: 10.1016/s0092-8674(03)00035-7. [DOI] [PubMed] [Google Scholar]
- 37.Liu RJ, Lee FS, Li XY, Bambico F, Duman RS, Aghajanian GK. Brain-derived neurotrophic factor Val66Met allele impairs basal and ketamine-stimulated synaptogenesis in prefrontal cortex. Biol Psychiatry. 2012;71:996–1005. doi: 10.1016/j.biopsych.2011.09.030. [DOI] [PMC free article] [PubMed] [Google Scholar]
- 38.Laje G, Lally N, Brutsche N, Chemerinski A, Akula N, Kelmendi B, et al. Brain-Derived Neurotrophic Factor Val66Met polymorphism and antidepressant efficacy of ketamine in depressed patients. Biol Psychiatry. 2012;72:e27–28. doi: 10.1016/j.biopsych.2012.05.031. [DOI] [PMC free article] [PubMed] [Google Scholar]
- 39.Gillin JC, Buchsbaum M, Wu J, Clark C, Bunney W., Jr Sleep deprivation as a model experimental antidepressant treatment: findings from functional brain imaging. Depress Anxiety. 2001;14:37–49. doi: 10.1002/da.1045. [DOI] [PubMed] [Google Scholar]
- 40.Salvadore G, Cornwell BR, Colon-Rosario V, Coppola R, Grillon C, Zarate CA, Jr, et al. Increased anterior cingulate cortical activity in response to fearful faces: a neurophysiological biomarker that predicts rapid antidepressant response to ketamine. Biol Psychiatry. 2009;65:289–295. doi: 10.1016/j.biopsych.2008.08.014. [DOI] [PMC free article] [PubMed] [Google Scholar]
- 41.Salvadore G, Cornwell BR, Sambataro F, Latov D, Colon-Rosario V, Carver F, et al. Anterior cingulate desynchronization and functional connectivity with the amygdala during a working memory task predict rapid antidepressant response to ketamine. Neuropsychopharmacology. 2010;35:1415–1422. doi: 10.1038/npp.2010.24. [DOI] [PMC free article] [PubMed] [Google Scholar]
- 42.Pizzagalli DA. Frontocingulate dysfunction in depression: toward biomarkers of treatment response. Neuropsychopharmacology. 2011;36:183–206. doi: 10.1038/npp.2010.166. [DOI] [PMC free article] [PubMed] [Google Scholar]
- 43.Hasler G, van der Veen JW, Tumonis T, Meyers N, Shen J, Drevets WC. Reduced prefrontal glutamate/glutamine and gamma-aminobutyric acid levels in major depression determined using proton magnetic resonance spectroscopy. Arch Gen Psychiatry. 2007;64:193–200. doi: 10.1001/archpsyc.64.2.193. [DOI] [PubMed] [Google Scholar]
- 44.Salvadore G, van der Veen JW, Zhang Y, Marenco S, Machado-Vieira R, Baumann J, et al. An investigation of amino-acid neurotransmitters as potential predictors of clinical improvement to ketamine in depression. Int J Neuropsychopharmacol. 2011;1:1–10. doi: 10.1017/S1461145711001593. [DOI] [PMC free article] [PubMed] [Google Scholar]
- 45.Rajkowska G. Postmortem studies in mood disorders indicate altered numbers of neurons and glial cells. Biol Psychiatry. 2000;48:766–777. doi: 10.1016/s0006-3223(00)00950-1. [DOI] [PubMed] [Google Scholar]
- 46.Esser SK, Hill SL, Tononi G. Sleep homeostasis and cortical synchronization: I. Modeling the effects of synaptic strength on sleep slow waves. Sleep. 2007;30:1617–1630. doi: 10.1093/sleep/30.12.1617. [DOI] [PMC free article] [PubMed] [Google Scholar]
- 47.Riedner BA, Vyazovskiy VV, Huber R, Massimini M, Esser S, Murphy M, et al. Sleep homeostasis and cortical synchronization: III. A high-density EEG study of sleep slow waves in humans. Sleep. 2007;30:1643–1657. doi: 10.1093/sleep/30.12.1643. [DOI] [PMC free article] [PubMed] [Google Scholar]
- 48.Duncan WC, Sarasso S, Ferrarelli F, Selter J, Riedner BA, Hejazi NS, et al. Concomitant BDNF and sleep slow wave changes indicate ketamine-induced plasticity in major depressive disorder. Int J Neuropsychopharmacol. 2012;7:1–11. doi: 10.1017/S1461145712000545. [DOI] [PMC free article] [PubMed] [Google Scholar]
- 49.Duncan WC, Jr, Selter J, Brutsche N, Sarasso S, Zarate CA., Jr Baseline delta sleep ratio predicts acute ketamine mood response in major depressive disorder. J Affect Disord. 2012 Aug 4; doi: 10.1016/j.jad.2012.05.042. [Epub ahead of print] [DOI] [PMC free article] [PubMed] [Google Scholar]
- 50.Argyropoulos SV, Hicks JA, Nash JR, Bell CJ, Rich AS, Nutt DJ, et al. Redistribution of slow wave activity of sleep during pharmacological treatment of depression with paroxetine but not with nefazodone. J Sleep Res. 2009;18:342–348. doi: 10.1111/j.1365-2869.2008.00724.x. [DOI] [PubMed] [Google Scholar]
- 51.Ehlers CL, Havstad JW, Kupfer DJ. Estimation of the time course of slow-wave sleep over the night in depressed patients: effects of clomipramine and clinical response. Biol Psychiatry. 1996;39:171–181. doi: 10.1016/0006-3223(95)00139-5. [DOI] [PubMed] [Google Scholar]
- 52.Davis LL, Frazier EC, Gaynes BN, Trivedi MH, Wisniewski SR, Fava M, et al. Are depressed outpatients with and without a family history of substance use disorder different? A baseline analysis of the STAR*D cohort. J Clin Psychiatry. 2007;68:1931–1938. doi: 10.4088/jcp.v68n1214. [DOI] [PubMed] [Google Scholar]
- 53.Tsai GE, Ragan P, Chang R, Chen S, Linnoila VM, Coyle JT. Increased glutamatergic neurotransmission and oxidative stress after alcohol withdrawal. Am J Psychiatry. 1998;155:726–732. doi: 10.1176/ajp.155.6.726. [DOI] [PubMed] [Google Scholar]
- 54.Allgaier C. Ethanol sensitivity of NMDA receptors. Neurochem Int. 2002;41:377–382. doi: 10.1016/s0197-0186(02)00046-3. [DOI] [PubMed] [Google Scholar]
- 55.Petrakis IL, Limoncelli D, Gueorguieva R, Jatlow P, Boutros NN, Trevisan L, et al. Altered NMDA glutamate receptor antagonist response in individuals with a family vulnerability to alcoholism. Am J Psychiatry. 2004;161:1776–1782. doi: 10.1176/ajp.161.10.1776. [DOI] [PubMed] [Google Scholar]
- 56.Phelps LE, Brutsche N, Moral JR, Luckenbaugh DA, Manji HK, Zarate CA., Jr Family history of alcohol dependence and initial antidepressant response to an N-methyl-D-aspartate antagonist. Biol Psychiatry. 2009;65:181–184. doi: 10.1016/j.biopsych.2008.09.029. [DOI] [PMC free article] [PubMed] [Google Scholar]
- 57.Diazgranados N, Ibrahim L, Brutsche NE, Newberg A, Kronstein P, Khalife S, et al. A randomized add-on trial of an N-methyl-D-aspartate antagonist in treatment-resistant bipolar depression. Arch Gen Psychiatry. 2010;67:793–802. doi: 10.1001/archgenpsychiatry.2010.90. [DOI] [PMC free article] [PubMed] [Google Scholar]
- 58.Zarate CA, Jr, Brutsche NE, Ibrahim L, Franco-Chaves J, Diazgranados N, Cravchik A, et al. Replication of ketamine’s antidepressant efficacy in bipolar depression: a randomized controlled add-on trial. Biol Psychiatry. 2012;71:939–946. doi: 10.1016/j.biopsych.2011.12.010. [DOI] [PMC free article] [PubMed] [Google Scholar]
- 59.Schumann G, Johann M, Frank J, Preuss U, Dahmen N, Laucht M, et al. Systematic analysis of glutamatergic neurotransmission genes in alcohol dependence and adolescent risky drinking behavior. Arch Gen Psychiatry. 2008;65:826–838. doi: 10.1001/archpsyc.65.7.826. [DOI] [PubMed] [Google Scholar]
- 60.Janowsky DS, el-Yousef MK, Davis JM, Hubbard B, Sekerke HJ. Cholinergic reversal of manic symptoms. Lancet. 1972;1:1236–1237. doi: 10.1016/s0140-6736(72)90956-7. [DOI] [PubMed] [Google Scholar]
- 61.Furey ML, Drevets WC. Antidepressant efficacy of the antimuscarinic drug scopolamine: a randomized, placebo-controlled clinical trial. Arch Gen Psychiatry. 2006;63:1121–1129. doi: 10.1001/archpsyc.63.10.1121. [DOI] [PMC free article] [PubMed] [Google Scholar]
- 62.Wang JC, Hinrichs AL, Stock H, Budde J, Allen R, Bertelsen S, et al. Evidence of common and specific genetic effects: association of the muscarinic acetylcholine receptor M2 (CHRM2) gene with alcohol dependence and major depressive syndrome. Hum Mol Genet. 2004;13:1903–1911. doi: 10.1093/hmg/ddh194. [DOI] [PubMed] [Google Scholar]
- 63.Cannon DM, Carson RE, Nugent AC, Eckelman WC, Kiesewetter DO, Williams J, et al. Reduced muscarinic type 2 receptor binding in subjects with bipolar disorder. Arch Gen Psychiatry. 2006;63:741–747. doi: 10.1001/archpsyc.63.7.741. [DOI] [PubMed] [Google Scholar]
- 64.Cannon DM, Klaver JK, Gandhi SK, Solorio G, Peck SA, Erickson K, et al. Genetic variation in cholinergic muscarinic-2 receptor gene modulates M2 receptor binding in vivo and accounts for reduced binding in bipolar disorder. Mol Psychiatry. 2011;16:407–418. doi: 10.1038/mp.2010.24. [DOI] [PMC free article] [PubMed] [Google Scholar]
- 65.Hasselmo ME, Sarter M. Modes and models of forebrain cholinergic neuromodulation of cognition. Neuropsychopharmacology. 2011;36:52–73. doi: 10.1038/npp.2010.104. [DOI] [PMC free article] [PubMed] [Google Scholar]
- 66.Furey ML. The prominent role of stimulus processing: cholinergic function and dysfunction in cognition. Curr Opin Neurol. 2011;24:364–370. doi: 10.1097/WCO.0b013e328348bda5. [DOI] [PMC free article] [PubMed] [Google Scholar]
- 67.Leppanen JM. Emotional information processing in mood disorders: a review of behavioral and neuroimaging findings. Curr Opin Psychiatry. 2006;19:34–39. doi: 10.1097/01.yco.0000191500.46411.00. [DOI] [PubMed] [Google Scholar]
- 68.Furey ML, Drevets WC, Hoffman EM, Frankel E, Speer AM, Zarate CA., Jr Pre-treatment neural activity in visual cortex during emotional processing predicts treatment response to scopolamine in major depressive disorder. Arch Gen Psychiatry. doi: 10.1001/2013.jamapsychiatry.60. in press. [DOI] [PMC free article] [PubMed] [Google Scholar]
- 69.Furey ML, Drevets WC, Khana A, Zarate CA., Jr . Society of BIological Psychiatry. Philadelphia, Pennsylvania: Elsevier; 2012. Differences in response to implicit emotional faces in anterior cingluate cortex predict antidepressant response to scopolamine in major depressive disorder; p. 293S. [Google Scholar]
- 70.Sitaram N, Nurnberger JI, Jr, Gershon ES, Gillin JC. Cholinergic regulation of mood and REM sleep: potential model and marker of vulnerability to affective disorder. Am J Psychiatry. 1982;139:571–576. doi: 10.1176/ajp.139.5.571. [DOI] [PubMed] [Google Scholar]
- 71.Furey ML, Khanna A, Hoffman EM, Drevets WC. Scopolamine produces larger antidepressant and antianxiety effects in women than in men. Neuropsychopharmacology. 2010;35:2479–2488. doi: 10.1038/npp.2010.131. [DOI] [PMC free article] [PubMed] [Google Scholar]
- 72.Puri R, Duong M, Uno K, Kataoka Y, Nicholls SJ. The emerging role of plasma lipidomics in cardiovascular drug discovery. Expert Opin Drug Discov. 2012;7:63–72. doi: 10.1517/17460441.2012.644041. [DOI] [PubMed] [Google Scholar]
- 73.Clark CP, Golshan S. Polysomnography and criteria for the antidepressant response to sleep deprivation. J Affect Disord. 2007;101:195–200. doi: 10.1016/j.jad.2006.11.020. [DOI] [PMC free article] [PubMed] [Google Scholar]
- 74.Danos P, Kasper S, Scholl HP, Kaiser J, Ruhrmann S, Hoflich G, et al. Clinical response to sleep deprivation and auditory-evoked potentials--preliminary results. Pharmacopsychiatry. 1994;27:70–71. doi: 10.1055/s-2007-1014281. [DOI] [PubMed] [Google Scholar]
- 75.Ebert D, Feistel H, Barocka A. Effects of sleep deprivation on the limbic system and the frontal lobes in affective disorders: a study with Tc-99m-HMPAO SPECT. Psychiatry Res. 1991;40:247–251. doi: 10.1016/0925-4927(91)90016-j. [DOI] [PubMed] [Google Scholar]
- 76.Volk S, Kaendler SH, Weber R, Georgi K, Maul F, Hertel A, et al. Evaluation of the effects of total sleep deprivation on cerebral blood flow using single photon emission computerized tomography. Acta Psychiatr Scand. 1992;86:478–483. doi: 10.1111/j.1600-0447.1992.tb03301.x. [DOI] [PubMed] [Google Scholar]
- 77.Ebert D, Feistel H, Barocka A, Kaschka W. Increased limbic blood flow and total sleep deprivation in major depression with melancholia. Psychiatry Res. 1994;55:101–109. doi: 10.1016/0925-4927(94)90004-3. [DOI] [PubMed] [Google Scholar]
- 78.Ebert D, Feistel H, Kaschka W, Barocka A, Pirner A. Single photon emission computerized tomography assessment of cerebral dopamine D2 receptor blockade in depression before and after sleep deprivation--preliminary results. Biol Psychiatry. 1994;35:880–885. doi: 10.1016/0006-3223(94)90024-8. [DOI] [PubMed] [Google Scholar]
- 79.Volk SA, Kaendler SH, Hertel A, Maul FD, Manoocheri R, Weber R, et al. Can response to partial sleep deprivation in depressed patients be predicted by regional changes of cerebral blood flow? Psychiatry Res. 1997;75:67–74. doi: 10.1016/s0925-4927(97)00021-8. [DOI] [PubMed] [Google Scholar]
- 80.Holthoff VA, Beuthien-Baumann B, Pietrzyk U, Pinkert J, Oehme L, Franke WG, et al. Changes in regional cerebral perfusion in depression. SPECT monitoring of response to treatment. Nervenarzt. 1999;70:620–626. doi: 10.1007/s001150050487. [DOI] [PubMed] [Google Scholar]
- 81.Wu JC, Gillin JC, Buchsbaum MS, Hershey T, Johnson JC, Bunney WE., Jr Effect of sleep deprivation on brain metabolism of depressed patients. Am J Psychiatry. 1992;149:538–543. doi: 10.1176/ajp.149.4.538. [DOI] [PubMed] [Google Scholar]
- 82.Smith GS, Reynolds CF, 3rd, Pollock B, Derbyshire S, Nofzinger E, Dew MA, et al. Cerebral glucose metabolic response to combined total sleep deprivation and antidepressant treatment in geriatric depression. Am J Psychiatry. 1999;156:683–689. doi: 10.1176/ajp.156.5.683. [DOI] [PubMed] [Google Scholar]
- 83.Wu J, Buchsbaum MS, Gillin JC, Tang C, Cadwell S, Wiegand M, et al. Prediction of antidepressant effects of sleep deprivation by metabolic rates in the ventral anterior cingulate and medial prefrontal cortex. Am J Psychiatry. 1999;156:1149–1158. doi: 10.1176/ajp.156.8.1149. [DOI] [PubMed] [Google Scholar]
- 84.Smith GS, Reynolds CF, 3rd, Houck PR, Dew MA, Ma Y, Mulsant BH, et al. Glucose metabolic response to total sleep deprivation, recovery sleep, and acute antidepressant treatment as functional neuroanatomic correlates of treatment outcome in geriatric depression. Am J Geriatr Psychiatry. 2002;10:561–567. [PubMed] [Google Scholar]
- 85.Clark CP, Brown GG, Archibald SL, Fennema-Notestine C, Braun DR, Thomas LS, et al. Does amygdalar perfusion correlate with antidepressant response to partial sleep deprivation in major depression? Psychiatry Res. 2006;146:43–51. doi: 10.1016/j.pscychresns.2005.09.007. [DOI] [PMC free article] [PubMed] [Google Scholar]
- 86.Benedetti F, Bernasconi A, Blasi V, Cadioli M, Colombo C, Falini A, et al. Neural and genetic correlates of antidepressant response to sleep deprivation: a functional magnetic resonance imaging study of moral valence decision in bipolar depression. Arch Gen Psychiatry. 2007;64:179–187. doi: 10.1001/archpsyc.64.2.179. [DOI] [PubMed] [Google Scholar]
- 87.Murck H, Schubert MI, Schmid D, Schussler P, Steiger A, Auer DP. The glutamatergic system and its relation to the clinical effect of therapeutic-sleep deprivation in depression - an MR spectroscopy study. J Psychiatr Res. 2009;43:175–180. doi: 10.1016/j.jpsychires.2008.04.009. [DOI] [PubMed] [Google Scholar]
- 88.Benedetti F, Calabrese G, Bernasconi A, Cadioli M, Colombo C, Dallaspezia S, et al. Spectroscopic correlates of antidepressant response to sleep deprivation and light therapy: a 3.0 Tesla study of bipolar depression. Psychiatry Res. 2009;173:238–242. doi: 10.1016/j.pscychresns.2008.08.004. [DOI] [PubMed] [Google Scholar]
- 89.Benedetti F, Serretti A, Colombo C, Campori E, Barbini B, di Bella D, et al. Influence of a functional polymorphism within the promoter of the serotonin transporter gene on the effects of total sleep deprivation in bipolar depression. Am J Psychiatry. 1999;156:1450–1452. doi: 10.1176/ajp.156.9.1450. [DOI] [PubMed] [Google Scholar]
- 90.Baghai TC, Schule C, Zwanzger P, Zill P, Ella R, Eser D, et al. No Influence of a functional polymorphism within the serotonin transporter gene on partial sleep deprivation in major depression. World J Biol Psychiatry. 2003;4:111–114. doi: 10.1080/15622970310029903. [DOI] [PubMed] [Google Scholar]
- 91.Benedetti F, Colombo C, Serretti A, Lorenzi C, Pontiggia A, Barbini B, et al. Antidepressant effects of light therapy combined with sleep deprivation are influenced by a functional polymorphism within the promoter of the serotonin transporter gene. Biol Psychiatry. 2003;54:687–692. doi: 10.1016/s0006-3223(02)01894-2. [DOI] [PubMed] [Google Scholar]
- 92.Benedetti F, Dallaspezia S, Lorenzi C, Pirovano A, Radaelli D, Locatelli C, et al. Gene-gene interaction of glycogen synthase kinase 3-beta and serotonin transporter on human antidepressant response to sleep deprivation. J Affect Disord. 2012;136:514–519. doi: 10.1016/j.jad.2011.10.039. [DOI] [PubMed] [Google Scholar]
- 93.Benedetti F, Barbini B, Bernasconi A, Fulgosi MC, Dallaspezia S, Gavinelli C, et al. Acute antidepressant response to sleep deprivation combined with light therapy is influenced by the catechol-O-methyltransferase Val(108/158)Met polymorphism. J Affect Disord. 2010;121:68–72. doi: 10.1016/j.jad.2009.05.017. [DOI] [PubMed] [Google Scholar]
- 94.Benedetti F, Lucca A, Brambilla F, Colombo C, Smeraldi E. Interleukine-6 serum levels correlate with response to antidepressant sleep deprivation and sleep phase advance. Prog Neuropsychopharmacol Biol Psychiatry. 2002;26:1167–1170. doi: 10.1016/s0278-5846(02)00255-5. [DOI] [PubMed] [Google Scholar]
- 95.Schule C, Di Michele F, Baghai T, Romeo E, Bernardi G, Zwanzger P, et al. Neuroactive steroids in responders and nonresponders to sleep deprivation. Ann N Y Acad Sci. 2004;1032:216–223. doi: 10.1196/annals.1314.024. [DOI] [PubMed] [Google Scholar]
- 96.Murck H, Uhr M, Ziegenbein M, Kunzel H, Held K, Antonijevic IA, et al. Renin-angiotensin-aldosterone system, HPA-axis and sleep-EEG changes in unmedicated patients with depression after total sleep deprivation. Pharmacopsychiatry. 2006;39:23–29. doi: 10.1055/s-2006-931476. [DOI] [PubMed] [Google Scholar]
- 97.Cornwell BR, Salvadore G, Furey M, Marquardt CA, Brutsche N, Grillon C, et al. Synaptic potentiation is critical for rapid antidepressant response to ketamine in treatment-resistant major depression. Biol Psychiatry. 2012;72:555–561. doi: 10.1016/j.biopsych.2012.03.029. [DOI] [PMC free article] [PubMed] [Google Scholar]
- 98.Duncan WCJ, Sarasso S, Ferrarelli F, Selter J, Riedner BA, Hejazi NS. Concomitant BDNF and sleep slow wave changes indicate ketamine-induced plasticity in major depressive disorder. Int J Neuropsychopharmacology. 2012;7:1–11. doi: 10.1017/S1461145712000545. [DOI] [PMC free article] [PubMed] [Google Scholar]
- 99.Zarate CAJ, Brutsche N, Laje G, Luckenbaugh DA, Venkata SL, Ramamoorthy A, et al. Relationship of ketamine’s plasma metabolites with response, diagnosis, and side effects in major depression. Biol Psychiatry. 2012;72:331–338. doi: 10.1016/j.biopsych.2012.03.004. [DOI] [PMC free article] [PubMed] [Google Scholar]
- 100.Machado-Vieira R, Yuan P, Brutsche N, DiazGranados N, Luckenbaugh DA, Zarate CA. Brain-derived neurotrophic factor and initial antidepressant response to an N-methyl-D-aspartate antagonist. J Clin Psychiatry. 2009;70:1662–1666. doi: 10.4088/JCP.08m04659. [DOI] [PMC free article] [PubMed] [Google Scholar]
Associated Data
This section collects any data citations, data availability statements, or supplementary materials included in this article.