

Abstract
To identify early populations of committed progenitors derived from human embryonic stem cells (hESCs), we screened self-renewing, BMP4-treated and retinoic acid–treated cultures with >400 antibodies recognizing cell-surface antigens. Sorting of >30 subpopulations followed by transcriptional analysis of developmental genes identified four distinct candidate progenitor groups. Subsets detected in self-renewing cultures, including CXCR4+ cells, expressed primitive endoderm genes. Expression of Cxcr4 in primitive endoderm was confirmed in visceral endoderm of mouse embryos. BMP4-induced progenitors exhibited gene signatures of mesoderm, trophoblast and vascular endothelium, suggesting correspondence to gastrulation-stage primitive streak, chorion and allantois precursors, respectively. Functional studies in vitro and in vivo confirmed that ROR2+ cells produce mesoderm progeny, APA+ cells generate syncytiotrophoblasts and CD87+ cells give rise to vasculature. The same progenitor classes emerged during the differentiation of human induced pluripotent stem cells (hiPSCs). These markers and progenitors provide tools for purifying human tissue-regenerating progenitors and for studying the commitment of pluripotent stem cells to lineage progenitors.
Introduction
Schemes for purifying human embryonic progenitors should be useful for studying the mechanisms underlying human embryogenesis and for developing cell therapies. As the retrieval of gastrulation-stage human embryos is prohibited on ethical grounds, the only practical source of early developmental progenitors is human pluripotent stem cells (hPSCs). Classifying differentiated progeny of hPSCs can rely on evolutionary conservation of gene expression patterns and similarities to mouse embryonic precursors1. However, the identification of differentiated hPSCs is confounded by the pleiotropic expression patterns of embryonic genes and the heterogeneity of the cultures, which may lead to alternative interpretations. For example, evidence for bone morphogenetic protein 4 (BMP4)-induced emergence of trophoblasts from hESCs2 was recently challenged by a report suggesting that BMP4-treated hESCs are mesoderm cells expressing trophoblast genes3. Alternatively, expression of trophoblast genes may reflect the presence of trophoblasts mixed with mesoderm progenitors. Similar doubts appear with respect to meso-endoderm lineages. As early endoderm and mesoderm genes are commonly detected in differentiating cultures of hESCs4, mouse ESCs (mESCs)5 and epiblast stem cells6, it is not clear whether endoderm cells emerge in whole or in part from mesendoderm progenitors. Moreover, as mouse primitive and definitive endoderm tissues are specified by a common set of transcriptional regulators7, including Sox17, Gata4, Gata6 and Foxa2, it is difficult to determine which endoderm lineage develops during differentiation in culture. Distinguishing human progenitors therefore requires purification schemes based on additional information.
Self-renewing cultures of ESCs include small fractions of differentiated cells8, which confound the analysis of pluripotency. Without purifying true pluripotent cells and differentiating cells, it is difficult to determine, for example, whether low mRNA levels of differentiation genes detected in cultures of mESCs reflect priming of lineage specification programs in undifferentiated cells9 or the presence of small populations of differentiating cells. Isolation of pure undifferentiated cells and progenitor populations from hESCs should provide the cellular resolution required to address such questions in a human model. We and others have shown that cell purification followed by functional assays to determine progenitor-progeny relationships is fundamental for lineage classification. Using fluorescence-activated cell sorting (FACS) in conjunction with monoclonal antibodies (mAbs) that recognize surface antigens, we purified the blood-forming hematopoietic stem cells10, their downstream common progenitors (myeloid11 and lymphoid12), skeletal muscle stem cells13, human neural stem cells14, mouse osteochondral progenitors15, cancer stem cells16 and more. Here we use a large panel of surface markers to resolve progenitor heterogeneities that develop during early stages of hESC differentiation. We refer to progenitors and precursors as committed cells producing differentiated progeny in vitro and giving rise to organs in vivo, respectively. We focus on identifying committed progenitors that exist in self-renewing cultures or that emerge in response to 3-day treatments with BMP4 or retinoic acid. BMP4 promotes development of posterior epiblast precursors, which give rise to primitive streak mesoderm, extra embryonic mesoderm tissues (e.g., the allantois) and primordial germ cells17,18. Retinoic acid is involved in the emergence of precursors that give rise to neuroectoderm and neural crest19. Based on gene expression signatures in sorted putative progenitor populations, comparison to mouse development, and functional assays, we discovered surface markers specific for four types of progenitors, exhibiting primitive endoderm, mesoderm, vascular endothelial and trophoblast characteristics. We show that these four progenitor groups also emerge from hiPSCs, indicating the applicability of the markers for isolation of progenitors from any source of hPSCs.
RESULTS
Identifying surface markers of putative progenitors
We used flow cytometry in conjunction with 408 mAbs (Supplementary Table 1) to identify subpopulations of candidate progenitors that were present in undifferentiated, conditioned media (CM)-treated cultures of hESCs or that emerged in response to treatment with 100 ng/ml BMP4 or 0.5 μM retinoic acid in serum-based media (Fig. 1a). We conducted the screen after 3 d of treatment, a period required for a noticeable reduction in the mRNA of pluripotency genes and upregulation of genes characteristic of gastrulation (data not shown). We dissociated the cells nonenzymatically and subsequently identified 115 mAbs, each of which labeled at least 1% of the cells after one or more treatments. Many of the markers that were downregulated after treatment with retinoic acid or BMP4 (e.g., CD44, CD50, CD100, CD138, TRA-1–60, TRA-1–81 and SSEA-4; Supplementary Table 2) were also absent or expressed at low levels on small subpopulations of cells (1–10%) present in self-renewing CM-treated cultures (Fig. 1b and Supplementary Table 3). As we expect only a small percentage of cells to differentiate in self-renewing cultures, we hypothesized that these subpopulations consisted of spontaneously emerging progenitors. The majority of cells (90–99%) exhibited uniformly high levels of these markers (denoted as pluripotency surface markers or PSMs), and are therefore likely enriched in true pluripotent hESCs. Using the same rationale, we propose that markers expressed by only small subsets of cells (1–10%) in CM-treated cultures (e.g., CXCR4, SSEA-1 and CD173) define candidate progenitors, whereas the populations negative for these markers are enriched in pluripotent hESCs (Fig.1c and Supplementary Table 3). Changes in cell surface marker expression after differentiation treatments (Supplementary Table 2) either were restricted to small (~1–20%) subsets of cells (e.g., those expressing APA, ROR2; Fig. 1d), or were common to most of the cells, thus reflecting a baseline differentiation response (e.g., upregulation of CD173 and downregulation of CD133; Fig. 1e). In subsequent experiments, we focused on sub-populations that were present in undifferentiated cultures and those that emerged in response to differentiation treatments.
Figure 1.

Identification of cell surface markers expressed by candidate progenitor populations. (a) A scheme of the approach for systematic identification of hESC-derived progenitors, including: (i) flow cytometry-based screen of candidate progenitor populations in self-renewing and differentiating (BMP4- or retinoic acid–treated) cultures, and (ii) lineage analysis based on expression of ~100 early embryonic genes and genome-wide transcriptional profiling. (b–e) Representative FACS plots for few of the markers (Percentages of subpopulations are shown). (b) Labeling of CM-treated cells with novel and established markers of undifferentiated cells (CD100 and Tra-1–81, respectively) revealed negative subpopulations of putative progenitors. (c) CXCR4+ and SSEA-1+ subpopulations within CM-treated cultures. (d) APA and ROR2 are expressed by emerging progenitor populations in BMP4-treated cultures. (e) CD173 and CD133 expression profiles reveal large population shifts in response to treatments with BMP4 and retinoic acid. Red, green and blue lines correspond to CM, retinoic acid and BMP4 treatments, respectively. Gray dotted lines are isotype controls.
To evaluate the developmental lineages of these cell subsets, we sorted >30 candidate progenitor populations and the respective nonprogenitor populations (exhibiting the opposite expression pattern of the cell surface marker, denoted here as ‘inverse populations’). In each subset we analyzed mRNA expression of >100 marker genes, chosen because they regulate the specification of early lineages or are expressed in specific regions of early embryos (Supplementary Table 4). For each candidate progenitor population, we calculated for all genes the expression fold-change compared to the inverse population. Hierarchical analysis of these fold changes revealed a relatively small number of signatures (Fig. 2), indicating that the number of distinct progenitor types (as determined by the set of reference genes) is considerably smaller than the number of identified cell subsets.
Figure 2.

Analysis of gene expression profiles in sorted hESC-derived populations. Each column represents an individual sort and each row corresponds to a developmental gene. Red and green values represent, respectively, higher and lower level of gene expression in the progenitor population versus cells exhibiting the opposite pattern of staining (inverse population). Cell surface marker and treatment of each sort are indicated at the top. +/− denotes analysis of gene expression in a progenitor population positive for the marker versus the respective non-progenitor negative cells, and −/+ denotes analysis of a progenitor population negative for the marker versus the respective non-progenitor positive cells. CM, BMP4 and retinoic acid (RA) indicate the culture treatment that preceded isolation. Most sorts were performed three times using cells at different passages. Biological repeat number is indicated in parenthesis. Four primary progenitor groups were identified based on similarities in gene expression cohorts measured in each population. Numbers in the top bars denote association of the sorted populations with the four progenitor groups indicated in Supplementary Figure 2. Bottom lists summarize genes that exhibited higher (red) or lower (green) expression in the main four progenitor groups versus the inverse populations. Red labeled genes also exhibited high absolute expression (within 6 qRT-PCR cycles from GAPDH).
To estimate the number of progenitor types, we computed all pairwise correlations between expression fold-change signatures that were measured for each candidate progenitor population. Clustering this matrix revealed four main diagonal blocks, each corresponding to a group of distinct putative-progenitor populations exhibiting similar fold-change signatures (Supplementary Fig. 1). All the candidate progenitor populations sorted from CM-treated cultures were clustered in group no. 1, indicating that one, or few, highly similar progenitor types are spontaneously generated in self-renewing cultures. The candidate progenitors of group no. 2 were isolated only from BMP4-treated cultures, and the remaining two groups, no. 3 and no. 4, consisted of candidate progenitors isolated from either BMP4- or retinoic acid–treated cultures. Biological repeats of cell sorting with the same choice of surface marker and treatment were always clustered within the same progenitor group.
Markers of endoderm progenitors in CM-treated cultures
Expression fold-change signatures of populations from putative progenitor group no. 1 (isolated exclusively from CM-treated cultures) (Supplementary Figs. 1 and 2) revealed strong induction of genes characteristic of epiblast-stage mouse embryonic visceral endoderm (for example, SOX17, FOXA2, GATA4, GATA6, IHH, GSC, MIXL1 and CER1, ref. 7) (Fig. 2). The endoderm specification of these putative progenitors (designated by PSM−, CXCR4+, CD173+ and SSEA-1+ expression) was even more apparent after analysis of genes expressed at high absolute levels (Fig. 2, bottom panel, right column). To evaluate the resemblance of these cells to early primitive endoderm and later-stage definitive endoderm, we analyzed the expression of pluripotency genes, many of which are downregulated in primitive streak cells20,21. Although endoderm genes were differentially upregulated several hundred–fold, the expression of genes that regulate or are associated with pluripotency (e.g., OCT4, NANOG, SOX2, TDGF1, REX1 (ZFP42) and DNMT3b) was only mildly reduced (1.5- to 3-fold) (Fig. 2). To verify that induction of endoderm genes coexisted with high expression of pluripotency genes in individual cells (as opposed to contamination of progenitor populations with residual undifferentiated cells), we analyzed the expression of OCT4 and seven differentiation-associated genes (FOXA2, SOX17, MIXL1, PRDM1, EOMES, T and MESP1) in single cells sorted using CXCR4 as a representative marker for group no. 1 (Fig. 3a). Approximately 50% of the CXCR4+ cells expressed OCT4 together with five or more of the seven differentiation genes (Fig. 3b, left and right). Expression of pluripotency genes was high even in cells that expressed the highest levels of CXCR4 (Fig. 3c). The majority of the CXCR4+ cells expressed genes typical of (but not exclusive to) visceral endoderm, including FOXA2, SOX17, MIXL1, PRDM1 and EOMES22. Notably, the early primitive-streak gene T (ref. 23) was not expressed in most of the CXCR4+ cells and was expressed at very low levels in the remaining CXCR4+ cells, suggesting that these cells are not mesendoderm progenitors. All CXCR4− cells, on the other hand, expressed OCT4 (about fivefold higher compared with CXCR4+ cells) and expressed only very low levels of differentiation genes in a few of the cells (Fig. 3b, right). OCT4 immunohistochemistry confirmed the slightly higher levels (about threefold) in CXCR4− compared to CXCR4+ cells (Fig. 3d).
Figure 3.

Primitive endoderm characteristics of CXCR4+ cells representing progenitor group no. 1. (a) Gates for sorting CXCR4+ and CXCR4− cells from CM-treated 3-day cultures. (b) Representative analysis of differentiation and pluripotency genes in ten single CXCR4+ (left) and CXCR4− cells (right) sorted from CM-treated cultures. Transcript copy numbers of GAPDH and OCT4 in single CXCR4− cells were determined by “Digital PCR”. Copy numbers of the remaining genes (displayed as red color-coded sectors) were estimated based on the respective difference in qRT-PCR cycles between each gene and GAPDH (used as a reference gene). Genes were said to be “expressed” if their estimated transcript number exceeded 2 copies per cell. “N.D.” denotes undetectable levels. (c) Analysis of endoderm (SOX17, FOXA2, GATA4) and pluripotency (NANOG) genes in single cells fractionated by six sorting gates along the intensity axis of CXCR4 (averaged across 4–7 cells in each group, CM-treated cells). Inset displays the histogram of CXCR4 levels with the respective sorting gates (1 through 6). (d) Immunohistochemistry of OCT4 protein in CXCR4− (top) and CXCR4+ cells (bottom) sorted from CM-treated cultures. Quantitative analysis of staining intensity across 10 fields of single cells revealed ~2.7-fold higher OCT4 levels in CXCR4− relative to CXCR4+ cells (right), confirming moderate reduction in the level of pluripotency factors in single CXCR4+ cells. (e) Immunohistochemistry of Cxcr4 (green) and E-cadherin (red) in E6.5 mouse embryos. Note the staining of cells within primitive endoderm tissues, including the parietal endoderm (arrows), and the extra embryonic and embryonic portions of the visceral endoderm (arrowheads and asterisks, respectively). E-cadherin staining was confined to the epiblast. Inset diagram shows the locations of anterior primitive endoderm and epiblast in E6.5 mouse embryos. (f) Whole mount immunohistochemical analysis of Cxcr4 (green) in E6.5 mouse epiblast revealed membrane staining at the extra embryonic proximal region. DAPI staining is shown in blue. Scale bars = 25 μm. (g) Left: GFP+ E6.5 mouse embryos produced by mating C57BL6/Ka GFP males with C57BL6/Ka Wt females. Right: Relative expression of pluripotency and endoderm genes measured by qRT-PCR in single sorted (inset) GFP+Cxcr4+ and GFP+Cxcr4− cells (averaged across 2–8 cells). Error bars represent s.e.m.
Next, we tested whether CXCR4, which is commonly associated with definitive endoderm in mouse embryos23, is also expressed in primitive endoderm tissues. Immunohistochemistry of whole mount and tissue sections of embryonic day 6.5 (E6.5) mouse embryos revealed membrane staining of Cxcr4 in primitive endoderm tissues. Positive staining was observed in cells of the parietal and visceral endoderm, in both the embryonic and extra-embryonic compartments (Fig. 3e,f, green). Cxcr4 staining did not co-localize with that of E-cadherin (Fig. 3e, red), a pan-epiblast marker that is downregulated in primitive endoderm cells24. To further verify that Cxcr4 is expressed in mouse primitive endoderm, we tested whether individual Cxcr4+ cells express canonical endoderm genes at E6.5, an early streak stage25 preceding the development of the definitive endoderm26. To exclude maternal cells from analysis, we crossed GFP+ males to wild-type females and separated by cell cytometry the purely embryonic GFP+Cxcr4+ and GFP+Cxcr4− fractions (Fig. 3e, left and inset). Transcriptional profiling revealed that only the Cxcr4+ cells expressed the canonical endoderm genes Gata4, Sox17, Gata6, Villin and high levels of Foxa2 (Fig. 3g, right). In addition, both Cxcr4+ and Cxcr4− fractions expressed Oct4 and Nanog. Together, the localization of Cxcr4 to primitive endoderm tissues of E6.5 embryos and expression of canonical endoderm genes at this stage in Cxcr4+ cells indicate that this marker is not restricted to definitive endoderm.
Markers of mesoderm progenitors in BMP4-treated cultures
Subpopulations isolated after 3 d of treatment with BMP4 exhibited three distinct signatures of gene fold-change, each shared by multiple populations that were sorted with different mAbs. The expression signature of ROR2+, CD13+, CD44− and FGFFR3− cell subsets belonging to group no. 2 (Supplementary Figs. 1 and 2) was characterized by moderate to high expression levels (>1:100 of GAPDH levels, Fig. 2 bottom panel) of 10 out of 12 genes known to be involved in mesoderm and primitive streak formation22. These include the mesoderm regulator T, the posterior mesoderm genes MESP1 and EVX1, and additional genes such as MIXL1, SMAD1, WNT3A and FGF8. Besides their mesoderm signature, these populations exhibited induction, and moderate to high levels of 9 out of 18 genes (Fig. 2, bottom panel) expressed in progenitor group no. 1 but at levels that were almost always lower compared with the CXCR4+ population. In contrast, expression of the primitive streak markers T and MESP1 in populations of group no. 2 was considerably higher than in sorted CXCR4+ progenitors (Fig. 4a). To determine whether these mesoderm characteristics reflected the properties of single cells, we analyzed the expression of representative mesoderm and endoderm genes in single ROR2+ cells isolated from 3-day BMP4-treated embryoid bodies. The majority of these cells exhibited very low transcription of SOX17 (not more than 1 mRNA transcript per cell) but moderate to high of MESP2 (Fig. 4b). Because the levels of T and MESP1 in these experiments seemed low (<10 mRNA transcripts per cell on average) we remeasured their copy number by “digital PCR”27 and found that they were expressed at 30 and 22 mRNA transcripts per cells, respectively (Fig. 4b). Conversely to the differentiation genes, the levels of pluripotency genes were generally ~50-fold lower in ROR2+ cells compared with undifferentiated cells (Fig. 4b, left versus right panel).
Figure 4.
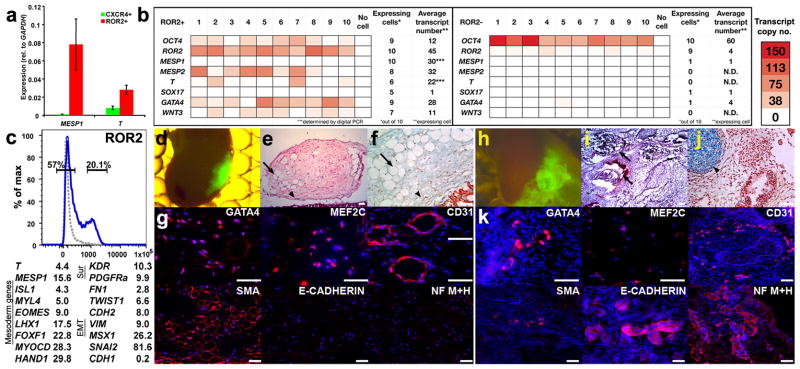
ROR2+ progenitors (representing group no. 2) exhibit characteristics of embryonic mesoderm and generate mesoderm tissues in vivo. (a) Levels of the mesoderm genes, MESP1 and T, in ROR2+ versus CXCR4+ progenitors sorted, respectively, from BMP4-treated and CM-treated cultures. Error bars represent s.e.m. (b) Representative analysis of differentiation and pluripotency genes in ten single ROR2+ (left) and ROR2− cells (right) sorted from 3-day BMP4-treated embryoid bodies. Transcript copy number of GAPDH was determined by Digital PCR. Copy numbers of the remaining genes (displayed as red color-coded sectors) were estimated based on the respective difference in qRT-PCR cycles between each gene and GAPDH. Genes were said to be “expressed” if their estimated transcript number exceeded 2 per cell. (***) Average copy numbers of T and MESP1 in ROR2+ cells were determined based on single cell measurements using Digital PCR. “N.D.” denotes undetectable levels. (c, top) Gating strategy for sorting ROR2+ and ROR2− cells from 3-day BMP4-treated cultures (isotype control shown as gray dotted line). (c, bottom) Expression fold-difference of representative mesoderm, lateral mesoderm, and epithelial-to-mesenchymal transition (EMT) genes in ROR2+ versus ROR2− populations that were cultured for 7 more days in the presence of FBS (based on an average of two genome-wide profiling experiments conducted with cultures at different passages). (d,h) Ectopic cell masses formed by sorted GFP-labeled ROR2+ (d) and ROR2− cells (h) 8 weeks following sub-capsular renal transplantation. (e,i) Low-power microphotographs of Hematoxylin and Eosin (H&E) stained ROR2+ (e) and ROR2− graft sections (i). (f,j) High magnification microphotographs of pentachrome-stained sections from ROR2+ (f) and ROR2− grafts (j). Light blue denotes heparan sulfate–rich region. Intense blue corresponds to cartilage. (e,f) ROR2+ grafts contained numerous vascular (arrows) and mesenchyme structures (arrowheads) with no evidence of epithelium, cartilage, or ossification. (h–j) ROR2− grafts were substantially larger (h) and contained epithelial structures (arrows, i) and cartilage (arrowheads, j). (g) Positive immunostaining of large portions of ROR2+ grafts with a panel of antibodies recognizing the mesoderm markers, GATA4, myocyte-specific enhancer factor 2C (MEF2C), platelet endothelial cell adhesion molecule (PECAM1, CD31) and smooth muscle actin (SMA). In contrast, the neuronal markers (medium and heavy neurofilament chains; NF M+H) and the epithelial marker, E-cadherin, were not detected in these grafts. (k) Similar analysis in ROR2− grafts revealed GATA4 and MEF2C staining only in a small number of cells. Likewise, CD31 and SMA were expressed in localized regions in the ROR2− graft. In contrast, NF M+H and E-cadherin were widely expressed. DAPI staining of DNA is show in blue. Scale bars, 25 μm.
ROR2+ progenitors generate differentiated mesoderm tissue
To functionally test the putative identification of ROR2+ cells with mesoderm progenitors, we analyzed their differentiated outcomes in vivo and in vitro (Fig. 4c–k). We sorted 5 × 10⁵ ROR2+ and ROR2− cells after 3 days of BMP4 treatment (Fig. 4c, top), and cultured them individually on Matrigel-coated dishes in the presence of serum-containing medium (FBS) without additional factors. One week later, we transplanted ~1 × 10⁵ cells of each population into the subcapsular kidney compartment of Rag−/−γc−/− immunodeficient mice, a site permitting autonomous growth of engrafted tissues15. In parallel, we analyzed the global gene–expression profiles of the cells that were cultured for 1 week. Cultures of ROR2+ but not ROR2− cells underwent epithelial-to-mesenchymal transition as determined by strong downregulation of E-cadherin (CDH1) and upregulation of N-cadherin (CDH2), FN1, TWIST1, VIM, MSX1 and SNAI2 (Fig. 4c, bottom). This transition was accompanied by upregulation of the mesoderm, muscle and cardiac genes T, MESP1, ISL1, MYL4, EOMES, LHX1, FOXF1, MYOCD and HAND1, as well as upregulation of the lateral mesoderm surface markers KDR and PDGFRA28–30 (Fig. 4c, bottom). These changes are characteristic of early primitive-streak precursors undergoing epithelial-to-mesenchymal transition and lateral mesoderm induction during migration31.
The changes observed in culture were consistent with the outcomes of growth and differentiation in vivo; 8 weeks after subcapsular renal transplantation, ROR2+ cells formed much smaller grafts compared with ROR2− cells (Fig. 4d,h, respectively). Histological analysis of the grafts showed that ROR2− cells formed teratomas consisting of epithelial structures (Fig. 4i), cartilage (pentachrome staining in Fig. 4j) and neurons (Fig. 4k). ROR2+ grafts, on the other hand, did not form teratomas, but rather generated relatively uniform tissues containing vascular structures lacking epithelial, cartilaginous and neuronal characteristics (Fig. 4e,f). Immunohistochemistry of the ROR2+ grafts revealed strong expression of the mesoderm and endoderm transcription factor GATA4, the muscle and cardiac proteins MEF2C and smooth muscle actin (SMA), and the endothelial marker CD31) (Fig. 4g). Notably, some of these markers, for example SMA and GATA4, were broadly expressed in the ROR2+ grafts, indicating that the original population was highly enriched for mesoderm progenitors. Conversely, the proportions of cells positive for GATA4, MEF2C, CD31 and SMA within the ROR2− grafts were substantially lower and typically confined to small regions (Fig. 4k). The propensity of ROR2+ (but not ROR2−) cells to differentiate toward mesenchymal mesoderm tissues was further supported by the complete absence of the epithelial protein, E-cadherin (Fig. 4g) and placental markers that were detected within grafts derived from APA+ cells (Supplementary Fig. 3)
Markers of endothelial progenitors in BMP4-treated cultures
Transcriptional analysis of candidate progenitor group no. 3 (consisting mainly of CD87+ and CD60+ subpopulations; Supplementary Figs. 1 and 2) revealed lower levels of pluripotency genes and higher levels of a relatively small set of genes, including PRRX1, SNAI2, VEGFC, NCAM2, LMO2 and DKK1 (Fig. 2, lower panel). Because these features were not informative enough to allow lineage classification, we analyzed the genome-wide transcriptional profile of CD87+ cells representing this group (Fig. 5a). Gene ontology analysis of differentially expressed transcripts in CD87+ versus CD87− cells revealed clear signatures of vasculogenesis and angiogenesis (Fig. 5b). Notably, the set of differentially expressed genes exhibited a very significant overlap (P = 5.8e–18) with genes expressed in a human microvascular endothelial cell line32; 20 out of 55 genes that were differentially expressed in this line (compared with a tubular epithelial cell line) were also differentially expressed in CD87+ cells (Fig. 5c). In contrast, only 1 of the 55 genes was considerably lower in the CD87+ population (Fig. 5c bottom).
Figure 5.

CD87+ progenitors (representing group no. 3) exhibit characteristics of endothelial microvasculature. (a) Gates for sorting CD87+ and CD87− cells from 5-day BMP4-treated cultures (isotype control shown as gray dotted line). (b) Gene ontology analysis indicating enrichment of gene categories in CD87+ relative to CD87− populations, based on 726 genes that were differentially expressed over threefold in CD87+ cells. (c) Partial list of vascular- and angiogenesis-related genes expressed at higher levels in CD87+ versus CD87− populations (top). Red asterisks denote genes that are also expressed at higher levels in the microvascular dermal endothelial cell line HMEK-1, compared with the tubular epithelial cell line HK-2 (ref. 33). Partial list of vasculogenesis-related genes that are expressed at medium to high levels in both CD87+ and CD87− populations is shown at the bottom. Analyses in (b,c) are based on an average of two genome-wide profiling experiments with cultures at different passages. (d–g) Developmental potential of sorted, GFP-tagged CD87+ and CD87− populations, analyzed following additional culturing period of 7 d in FBS containing media. (d) Representative phase-contrast photomicrographs show development of microvascular networks in the CD87+ but not in CD87− cultures. (e,f) Immunohistochemistry with von Willebrand factor and CD31 antibodies revealed specific staining (red) only in vesicles (e) and membranes (f) within the CD87+ cultures. Green label corresponds to GFP as detected by immunostaining. DAPI staining is shown in blue. (g) Fluorescence photomicrograph of Ac-LDL uptake (red) revealed positive signal only in CD87+ cells. Scale bars, 25 μm.
To functionally validate the vascular endothelial characteristics of CD87+ cells, we sorted ~1 × 10⁵ CD87+ and CD87− cells from day-5 BMP4-treated cultures and plated them on nondiluted Matrigel-coated dishes in the presence of FBS (an assay for microvascular endothelial cell capillary tubule formation33). The CD87+ cells produced extensive microvascular-like networks, whereas CD87− cells gave rise to heterogeneous monolayer containing mesenchymal cells and undifferentiated regions (Fig. 5d). In addition, CD87+, but not CD87− cells demonstrated intense perinuclear granular immunostaining of von Willebrand factor, a marker typical of microvascular endothelial cells34 (Fig. 5e). Similarly, immunohistochemistry of CD31, a glycoprotein highly expressed by endothelial cells and typically concentrated at endothelial cell borders34, revealed strong membrane staining on a large proportion of CD87+, but not CD87− cells (Fig. 5f). Additionally, uptake of acetylated low-density lipoprotein (Ac-LDL) was specific to CD87+ cells, revealing punctuated labeling pattern characteristic of endothelial cells34 (Fig. 5g).
Markers of trophoblast progenitors in BMP4-treated cultures
The fourth group of putative progenitor populations, defined by cell surface expression of APA, CD117, EGFR, ABCG2 and LIFR (Supplementary Figs. 1 and 2), exhibited reduced expression of most of the tested genes (Fig. 2, bottom panel). As we could not deduce the lineage from this reduction, we performed global analysis of gene expression in APA+ versus APA− populations (representing putative progenitor group no. 4; Fig. 6a). The profile of differential expression revealed strong induction of genes characteristic of villous cytotrophoblasts, including: (i) GCM1 (glial cell missing 1), a master regulator of trophoblast development that governs branching and morphogenesis of the chorion (the embryonic placenta)35, (ii) its downstream syncytiotrophoblast-specific target gene, estrogen–synthesizing enzyme CYP19A1 (Aromatase)36, (iii) the steroid-metabolizing enzyme, steroid sulfatase (STS), which is expressed by human syncytiotrophoblasts37, (iv) the placenta-specific gene 2 (PLAC2) and (v) VTCN1 (B7H4), which mediates suppression of T-cell immunity in the placenta38 (Fig. 6b, left). Comparing the enrichment profile in APA+ cells to first trimester villous and extravillous human trophoblasts39 further supported trophoblast classification of this group of populations; ~70% of the highly enriched genes in APA+ cells were also enriched in villous versus extravillous trophoblasts (data not shown). Many other placental genes, such as HAND1, PGF, CAV1 and CTSC, were expressed at relatively high levels in both APA+ and APA− populations (Fig. 6b, right), consistent with previous reports2.
Figure 6.

APA+ progenitors (representing group no. 4) exhibit trophoblast characteristics and produce syncytiotrophoblasts by cell fusion. (a) Gates for sorting APA+ and APA− cells from 3.5-day BMP-treated cultures (isotype control shown as gray dotted line). (b) Partial list of syncytiotrophoblast- and placenta-related genes expressed at higher levels in APA+ versus APA− cells (left). Right: placental genes expressed at medium to high levels in both APA+ and APA− cells. (c) Expression fold-difference of representative trophoblast and placental genes in APA+ versus APA− populations that were sorted at day 3.5 and cultured for additional 7 d in the presence of FBS. (b,c) Analyses are based on an average of two genome-wide profiling experiments with cultures at different passages. (d–i) Formation of syncytiotrophoblasts by fusion of sorted APA+, but not APA− cells. (d,g) TexRed-conjugated phalloidin (red) and DAPI staining (blue) of APA+ (d) and APA− cells (g) that were cultured in the presence of FBS for 5 d. Multinucleated cells were almost exclusive to the APA+ culture (arrows). (e,h) Mixture of GFP-labeled and mCherry-labeled APA+ (e) and APA− cells (h) that were cultured for 7 d. Multinucleated cells that are positive for both GFP and mCherry were enriched in the APA+ (e) compared with APA− culture (h). (f,i) Immunohistochemistry of GFP-labeled APA+ and APA− cells with the pan-trophoblast marker Cytokeratin 7 after culturing for 7 d with FBS revealed multinucleated Cytokeratin 7 positive cells only in the APA+ culture (f vs. i); GFP was detected by immunostaining. (j,m) Ectopic cell masses formed from sorted GFP-labeled APA+ (j) and APA− (m) hESC-derived populations 8 weeks following sub-capsular renal transplantation. Low (k,n) and high (l,o) magnification microphotographs of pentachrome-stained sections from APA+ (k,l) and APA− (n,o) grafts (light blue, heparan sulfate–rich region; intense blue, cartilage; greenish blue calcified cartilage; yellow, bone). APA+ grafts (k,l) consisted primarily of mesenchyme (light blue) and epithelial structures (arrows in k) with no evidence of cartilage, ossification, or fibroblasts. Host kidney structure is shown at the bottom (k). In contrast, APA− grafts were substantially larger (m) and contained epithelial structures (n) including gut epithelium-like structures (arrow), cartilage (arrowhead), and calcified cartilage (evidence of bone formation in o, arrow). (p,q) Immunohistochemistry of APA+ (p) and APA− grafts (q) with a panel of antibodies recognizing placental markers, including: steroid sulfatase (STS), hydroxy-delta-5-steroid dehydrogenase, 3 beta- and steroid delta-isomerase 1 (HSD3B1), Aminopeptidase A (APA, CD249), human chorionic somatomammotropin hormone 1 (Human placental lactogen, HPL), and placental alkaline phosphatase (PLAP). (p) APA+ grafts contained numerous cells expressing STS, HSD3B1, APA, HPL and PLAP but were negative for NF M+H. (q) The placental markers STS, HSD3B1, and PLAP were limited to small regions of the APA− grafts and HPL signal was marginal. On the other hand, NF M+H chains were detected in large regions of APA− grafts. DAPI staining is shown in blue. Scale bars, 25 μm.
APA+ cells generate syncytiotrophoblasts and placental tissue
The trophoblast characteristics of APA+ cells were confirmed by functional assays (Fig. 6d–q). We sorted ~1 × 10⁶ APA+ and APA− cells from 3.5-day BMP4-treated cultures and plated them separately on gelatin-coated dishes in the presence of FBS. After 5–10 d, we measured the global gene-expression patterns and the tendency of the cells to undergo fusion to produce chorionic-like syncytiotrophoblasts40. Unlike cultured ROR2+ progenitors (Fig. 4c, bottom), cultured APA+ cells did not show signs of an epithelial-to-mesenchymal transition, nor did they upregulate mesoderm and muscle genes (data not shown). Instead, they upregulated the placental cadherin CDH3 and various additional placental genes, including STS, ABCG2, PLAC2 and HSD3B1 (Fig. 6c). Staining with fluorescent phalloidin conjugate (which binds actin filaments) revealed numerous multinucleated cells in the APA+ cultures but only few in APA− cultures (Fig. 6d,g, respectively). To verify that the increase in the number of nuclei per cell reflects a higher fusion propensity of APA+ cells, we sorted APA+ cells from enhanced GFP-tagged and mCherry-tagged hESCs, and co-cultured differentially tagged cells. As a control, we repeated this procedure for APA− cells. After 5–10 d we observed GFP+/mCherry+ double-positive cells in APA+ but not in APA− cultures (Fig. 6e,h, respectively, and Supplementary Fig. 4), demonstrating a fusion preference of APA+ cells. Furthermore, staining of these cultures for the pan trophoblast marker, cytokeratin 7 (CK-7), revealed strong expression in the APA+ population but not in the APA− population (Fig. 6f,i, respectively).
Additionally, we tested the propensity of APA+ cells to develop into placental structures in vivo. We engrafted ~1 × 10⁵ 7-day-cultured APA+ and APA− cells into the subcapsular kidney compartment of immunodeficient mice and analyzed the grafts 8 weeks later. APA+ progenitors generated smaller grafts (Fig. 6j versus 6m), comprising mesenchymal extracellular matrix–rich tissues and epithelial structures that were devoid of teratomas (Fig. 6k,l). Pentachrome staining (Fig. 6l) revealed proteoglycan-rich regions41 that are abundant in the placental mesenchyme42. Immunohistochemistry of the APA+ grafts revealed that the epithelial structures were positive for placental-specific proteins, including 3-β-hydroxysteroid dehydrogenase/Δ-5–4 isomerase (HSD3B1)43 and the STS enzyme37. The nonepithelial tissues were immunopositive for APA44, human placental lactogen (HPL) and the placental alkaline phosphatase (PLAP) (Fig. 6p). In addition, APA+ grafts were largely negative for mesoderm and endothelial markers (Supplementary Fig. 5) and did not contain neurons, as shown by lack of NF M+H staining (Fig. 6p). In contrast, grafts derived from APA− cells generated large teratomas (Fig. 6m) containing cartilage, bone and numerous epithelial structures (Fig. 6n,o). The APA− grafts also included tissues expressing NF M+H, but were largely devoid of STS, HS3DB1, APA, HPL and PLAP immunopositive cells (Fig. 6q).
Markers of progenitor groups are common to hESCs and hiPSCs
To evaluate the generality of markers and progenitors derived from hESCs, we analyzed the differentiation of the four progenitor groups in cultures of hiPSCs generated from fetal lung fibroblasts (IMR90, ref. 45). Similar to our results with hESCs, self-renewing cultures of hiPSCs contained a small population of CXCR4+ cells, and 3-day BMP4-treated cultures of hiPSCs included ROR2+, CD87+ and APA+ populations (Fig. 7a, top). We sorted these populations and found that they are enriched with genes characteristic of the progenitors derived from hESCs (Fig. 7a, bottom). Analysis of the sequence of emergence of cells expressing the identified markers showed that the CXCR4+ population peaked after 1 day (Supplementary Fig. 6a), whereas the populations of ROR2+, CD87+ and APA+ cells began to appear after 2 d of differentiation (Supplementary Fig. 6b–d). Notably, variations in population frequencies of ROR2+, APA+ and CD87+ cells that emerged after treatment with different lots of FBS (3–9 different batches from several vendors) were comparable to differences between replicate experiments using the same batch of serum (Supplementary Fig. 6e,f, respectively).
Figure 7.

Similarities between hESC- and hiPSC-derived progenitors and their suggested correspondence to pre- and gastrulation-stage mouse embryonic precursors. (a) Flow cytometry analyses of CXCR4, ROR2, CD87 and APA expression in dissociated hESCs (red) and hiPSCs (green) revealed similar-sized populations in both sources (top). Gray lines represent isotype controls. Bottom: mRNA expression fold-change profiles in CXCR4+, ROR2+, CD87+ and APA+ populations versus the respective negative populations sorted from hESCs (red) and hiPSCs (green). CXCR4+ cells were isolated from CM-treated cultures, while ROR2, CD87, and APA cells were isolated from BMP4-treated cultures. Analysis is based on two experiments conduced with cells at different passages. (b) Proposed correspondence of progenitor groups no. 1–4 to E5.5 (left) and E7.5 (right) mouse embryos. The human cell surface markers of each progenitor group are listed.
DISCUSSION
We used a large library of mAbs to identify dozens of cell surface markers and progenitor groups (Supplementary Figs. 1 and 2) exhibiting characteristics of endoderm/primitive endoderm, mesoderm, vascular endothelial and trophectoderm lineages (Figs. 2–6). The fact that multiple markers recognized each progenitor class suggests that we approached screen saturation for the major progenitor types. Nevertheless, it is possible that the panels of mAbs and gene probes with which we analyzed the sorted populations did not fully resolve all the progenitors that emerge under these differentiation conditions. Additionally, the relations between markers and lineages were established only for progenitors of group no. 1 in self-renewing cultures, and for progenitor groups no. 2–4 after 3–5 d of differentiation (BMP4, retinoic acid).
We found a striking overlap between the transcriptional profile of PSM−, SSEA-1+, CD173+ and CXCR4+ cells in self-renewing cultures of hESCs (Fig. 2) and the expression profiles of genes in the anterior visceral endoderm regions of the mouse embryo at the pregastrulation stage. Sorted CXCR4+ cells exhibited the strongest signature of this kind; in addition to canonical endoderm genes (e.g., SOX17, FOXA2, GATA4 and GATA6), the cells expressed high levels of genes required for the formation of the distal visceral endoderm in response to Nodal signaling31. These include the Nodal antagonists CER1 and LEFTY1 and the Wnt antagonist DKK1. The expression of Wnt and Nodal antagonists in the mouse embryo is governed by FOXA2, LHX1 and SMAD2, all of which were highly expressed in the CXCR4+ cells. OTX2, another downstream target of FOXA2 and SMAD2 in visceral endoderm cells, was also highly expressed in this population. In addition, we verified that these early emerging CXCR4+ cells co-express endoderm and pluripotency genes (Fig. 3b,c), consistent with the co-existence of pluripotency and endoderm genes in early migrating primitive endoderm cells of the mouse embryo46.
Previous work identified CXCR4+ cells in cultures of hESCs treated with Activin-A and very low concentrations of serum4. Lack of Sox7 transcription in these cultures was taken as an indication of definitive rather than primitive endoderm commitment. This conclusion was primarily based on the expression of Sox7 in the extra-embryonic portion of the visceral endoderm of mouse embryos and the lack of expression in the nascent definitive endoderm. However, the embryonic portion of the visceral endoderm does not express Sox7 either26. Hence, lack of Sox7 transcription cannot be regarded as evidence of definitive endoderm commitment. Cxcr4 is also regarded as a marker of definitive endoderm based on its transcription in mouse definitive endoderm but not in the yolk sac, which descends from primitive endoderm5. Here we found, however, that early mouse embryos express Cxcr4 in parietal and visceral primitive endoderm tissues (Fig. 3e) and that mouse Cxcr4+ cells express endoderm genes before the development of the definitive endoderm (Fig. 3g, right). Additionally, it has been shown that the hypoblast region (visceral endoderm equivalent) of presomite-stage chick embryo broadly expresses Cxcr4 along with expression in the primitive streak47. Taken together, these findings strongly suggest that CXCR4 is an evolutionarily conserved pan-endoderm marker rather than a definitive endoderm–exclusive marker. We therefore employed additional evidence that led us to classify the cells of group no. 1 as primitive endoderm progenitors (although we cannot completely rule out correspondence to definitive endoderm). This includes wide transcriptional resemblance to anterior visceral endoderm, high expression levels of pluripotency genes, and emergence of these cells before the gastrulation-like progenitor groups no. 2–3 (Supplementary Fig. 6a–c, respectively). Another study recently isolated hESC-derived SOX17+ endoderm progenitors exhibiting low expression of pluripotency genes and surface expression of CD49e, CD141 and CD238 (ref. 48). Conversely, the progenitors of group no. 1 exhibited relatively high expression of pluripotency genes (Fig. 2) and did not exhibit elevated levels of CD49e, CD141 and CD238, indicating that they are different from the SOX17+ progenitors48. These differences in the characteristics and timing of emergence are consistent with respective correspondence to primitive and definitive endoderm.
Emergence of mesoderm progenitors in response to BMP4 is consistent with the influence of BMP4 on the specification of the primitive streak17. Indeed, ROR2+ cells representing progenitor group no. 2, exhibited a striking transcriptional signature of regulators that orchestrate early primitive-streak formation. Additionally, these cells underwent epithelial-to-mesenchymal transition in culture similarly to early migrating primitive-streak cells49. Associating this group with mesoderm progenitors is also supported by the involvement of Ror2 in early mesoderm development. Transcription of Ror2+ is restricted to the nascent primitive steak and migrating lateral mesoderm cells of E7.5 mouse embryos50. Its absence in mice leads to defects in somitogenesis and cardiogenesis51, and ROR2 mutations in humans lead to Robinow syndrome, characterized by skeletal and heart defects52.
The later induction of cardiovascular genes and the markers KDR and PDGFRA in cultured ROR2+ cells indicates that ROR2 marks a more primitive stage of mesoderm progenitors compared with KDR and PDGFRα28,30. Although ROR2+ cells showed a preference for generating mesoderm (especially cardiac) tissues in vivo (Fig. 4d–k), the expression of endoderm genes in ROR2+ cells suggests that bi-potent meso-endoderm progenitors exist, perhaps as a rare population. It is plausible that mesoderm progenitor subtypes may be resolved by combining ROR2 with the other markers of group no. 2, and possibly with CD56, which was shown to be expressed by early mesoderm cells53.
Vascular endothelium develops in several mesoderm compartments during early embryogenesis (e.g., from lateral and extraembryonic mesoderm54). In this study, we discovered that CD87+ cells of group no. 3 exhibit transcriptional properties of microvascular endothelial progenitors, and their further culturing yields cells with endothelial characteristics. These progenitors also exhibited enrichment and high levels of VCAM1 and VEGFC genes. Vcam1 is vital for the fusion of the allantois bud (the precursor of umbilical cord endothelium55) with the chorion and for morphogenesis of the placental labyrinth56. Vegfc is also highly expressed by the early mouse allantois57. Similarly to the early allantois18, formation of CD87+ cells was promoted by BMP4. The association of the CD87+ progenitors with allantois precursors is further supported by the function and expression pattern of CD87, encoded by PLAUR. PLAUR is a receptor and a master activator of the plasmin system, which promotes cleavage of the extracellular matrix surrounding endothelial cells, acting to increase their motility58. This pathway is involved in tissue remodeling and morphogenesis of the placenta49, and CD87 is known to be expressed by endothelial cells59 and in the placenta60. Additional components of the plasmin system, including matrix metalloproteinases (MMP1) and collagenases58, were also highly enriched in the CD87+ population (Fig. 5c).
Endothelial cells were previously isolated from hESCs after differentiation for 7 d or more using pan-endothelial somatic markers34,61. Because CD87 can be used to isolate earlier-stage progenitors, we propose that it provides an earlier window for studying specification of endothelial fates. Owing to the early stage of these progenitors, further work is required to determine their full lineage potential and degree of maturation (e.g., by analyzing co-localization of markers such as VE-cadherin, VEGFR2, CD34 and CD31, as well as by evaluating VEGFR2 autophosphorylation in response to VEGF). Likewise, clonal analysis and transplantation of these progenitors is required to reveal their long-term functional and proliferative capacities.
Substantial evidence indicate that pluripotent stem cells have the potential to contribute to the trophectoderm lineage both in vitro and in vivo2,6,62,63. This view, however, has been recently challenged by a study proposing that BMP4-treated hESCs are mesoderm cells3. Evidence in favor of this interpretation includes dependency of trophoblast gene expression on BRACHYURY, and characteristics of BMP4-treated hESCs that may distinguish them from placental trophoblasts3. The influence of BRACHYURY on the expression of trophoblast genes is, however, not sufficient to establish a mesoderm fate. BRACHYURY64 and BMPs65 are also involved in the development of the allantois and the chorion, and Brachyury is expressed in the precursor tissue of the chorionic ectoderm at the early streak stage66. It is therefore plausible that a mixture of trophoblast- and mesoderm-committed cells emerge in response to BMP4. In line with this suggestion, we show that BMP4 promotes emergence of distinct, hESC-derived mesoderm and trophoblast progenitors. The classification of the trophoblast progenitors is supported by the induction of a broad set of trophoblast genes in APA+ cells, production of multinucleated fused cells expressing placental markers and generation of tissues expressing placental proteins in vivo. Additional line of evidence is provided by the expression patterns and functions of the respective cell surface markers. APA (CD249, Ly-51, 6C3 encoded by the ENPEP gene) is a glutamyl aminopeptidase (Aminopeptidase A) expressed on the surface of syncytiotrophoblasts44, where it participates in the regulation of maternal blood pressure through cleavage of angiotensin II67. EGFR and LIFR are expressed in the chorion and are vital for branching morphogenesis of the placental labyrinth40. Finally, ABCG2 (ATP-binding cassette efflux transporter BCRP) is expressed at high levels in placental syncytiotrophoblasts and was proposed to play an important role in fetal protection from toxic substances of maternal origin68. Taken together, the distinct sets of markers specific for mesoderm and trophoblast progenitors provide purification tools to resolve the heterogeneity of BMP4-treated hESC cultures and to study the formation of these lineages. Nonetheless, this does not rule out the possibility that a portion of trophoblasts is generated from mesoderm progenitors3. In summary, we have begun dissecting the earliest progenitor progeny of hESCs and hiPSCs by cell surface markers. Together, the gene expression profiles, differentiation outcomes and surface markers of these progenitors are consistent with specification of embryonic organs, including the (i) visceral endoderm, (ii) primitive streak, (iii) allantois and (iv) chorion (Fig. 7b). We also provide an extensive panel of PSMs (Supplementary Table 3) that may be used to remove residual undifferentiated teratoma-initiating cells from cellular transplants69. These findings should greatly facilitate the use of surface marker combinations for purifying finer populations of hPSC-derived progenitors, for isolating therapeutic tissue progenitors, and for investigating human embryonic specification programs.
Supplementary Material
Acknowledgments
This work was supported by funds provided by the California Institute of Regenerative Medicine (CIRM) (Comprehensive grants RC1–00354–1, RT2–02060). Y.S. was supported by a CDA award from the Human Frontier Science Organization (HFSPO, CDA0063/2007-C). C.T. and A.S.L. are supported by the Howard Hughes Medical Institute Medical Fellows and the Stanford Medical Scholars Program. Y.R. is supported by a Human Frontier Science Program (HFSP) Long Term Fellowship. M.D., C.T. and R.A. are supported by CIRM (Comprehensive grants RC1–00354–1, RT2–02060). We would like to thank C. Chan for pentachrome stainings.
Footnotes
AUTHOR CONTRIBUTIONS
M.D., I.L.W. and Y.S. designed the experiments and wrote the manuscript. M.D., Y.S., C.T., R.A., Y.R., J.S., A.S.L. and A.R.M. performed experiments and analyzed data. All authors endorse the full content of this work.
COMPETINGFINANCIAL INTERESTS
The authors declare no competing financial interests
References
- 1.Murry CE, Keller G. Differentiation of embryonic stem cells to clinically relevant populations: lessons from embryonic development. Cell. 2008;132:661–680. doi: 10.1016/j.cell.2008.02.008. [DOI] [PubMed] [Google Scholar]
- 2.Xu RH, et al. BMP4 initiates human embryonic stem cell differentiation to trophoblast. Nat Biotechnol. 2002;20:1261–1264. doi: 10.1038/nbt761. [DOI] [PubMed] [Google Scholar]
- 3.Bernardo AS, et al. BRACHYURY and CDX2 mediate BMP-induced differentiation of human and mouse pluripotent stem cells into embryonic and extraembryonic lineages. Cell Stem Cell. 2011;9:144–155. doi: 10.1016/j.stem.2011.06.015. [DOI] [PMC free article] [PubMed] [Google Scholar]
- 4.D’Amour KA, et al. Efficient differentiation of human embryonic stem cells to definitive endoderm. Nat Biotechnol. 2005;23:1534–1541. doi: 10.1038/nbt1163. [DOI] [PubMed] [Google Scholar]
- 5.Yasunaga M, et al. Induction and monitoring of definitive and visceral endoderm differentiation of mouse ES cells. Nat Biotechnol. 2005;23:1542–1550. doi: 10.1038/nbt1167. [DOI] [PubMed] [Google Scholar]
- 6.Brons IG, et al. Derivation of pluripotent epiblast stem cells from mammalian embryos. Nature. 2007;448:191–195. doi: 10.1038/nature05950. [DOI] [PubMed] [Google Scholar]
- 7.Zorn AM, Wells JM. Vertebrate endoderm development and organ formation. Annu Rev Cell Dev Biol. 2009;25:221–251. doi: 10.1146/annurev.cellbio.042308.113344. [DOI] [PMC free article] [PubMed] [Google Scholar]
- 8.Pera MF, et al. Regulation of human embryonic stem cell differentiation by BMP-2 and its antagonist noggin. J Cell Sci. 2004;117:1269–1280. doi: 10.1242/jcs.00970. [DOI] [PubMed] [Google Scholar]
- 9.Efroni S, et al. Global transcription in pluripotent embryonic stem cells. Cell Stem Cell. 2008;2:437–447. doi: 10.1016/j.stem.2008.03.021. [DOI] [PMC free article] [PubMed] [Google Scholar]
- 10.Spangrude GJ, Heimfeld S, Weissman IL. Purification and characterization of mouse hematopoietic stem cells. Science. 1988;241:58–62. doi: 10.1126/science.2898810. [DOI] [PubMed] [Google Scholar]
- 11.Akashi K, Traver D, Miyamoto T, Weissman IL. A clonogenic common myeloid progenitor that gives rise to all myeloid lineages. Nature. 2000;404:193–197. doi: 10.1038/35004599. [DOI] [PubMed] [Google Scholar]
- 12.Kondo M, Weissman IL, Akashi K. Identification of clonogenic common lymphoid progenitors in mouse bone marrow. Cell. 1997;91:661–672. doi: 10.1016/s0092-8674(00)80453-5. [DOI] [PubMed] [Google Scholar]
- 13.Sherwood RI, et al. Isolation of adult mouse myogenic progenitors: functional heterogeneity of cells within and engrafting skeletal muscle. Cell. 2004;119:543–554. doi: 10.1016/j.cell.2004.10.021. [DOI] [PubMed] [Google Scholar]
- 14.Uchida N, et al. Direct isolation of human central nervous system stem cells. Proc Natl Acad Sci USA. 2000;97:14720–14725. doi: 10.1073/pnas.97.26.14720. [DOI] [PMC free article] [PubMed] [Google Scholar]
- 15.Chan CK, et al. Endochondral ossification is required for haematopoietic stem-cell niche formation. Nature. 2009;457:490–494. doi: 10.1038/nature07547. [DOI] [PMC free article] [PubMed] [Google Scholar]
- 16.Chan KS, et al. Identification, molecular characterization, clinical prognosis, and therapeutic targeting of human bladder tumor-initiating cells. Proc Natl Acad Sci U S A. 2009;106:14016–14021. doi: 10.1073/pnas.0906549106. [DOI] [PMC free article] [PubMed] [Google Scholar]
- 17.Winnier G, Blessing M, Labosky PA, Hogan BL. Bone morphogenetic protein-4 is required for mesoderm formation and patterning in the mouse. Genes Dev. 1995;9:2105–2116. doi: 10.1101/gad.9.17.2105. [DOI] [PubMed] [Google Scholar]
- 18.Fujiwara T, Dunn NR, Hogan BL. Bone morphogenetic protein 4 in the extraembryonic mesoderm is required for allantois development and the localization and survival of primordial germ cells in the mouse. Proc Natl Acad Sci USA. 2001;98:13739–13744. doi: 10.1073/pnas.241508898. [DOI] [PMC free article] [PubMed] [Google Scholar]
- 19.Sirbu IO, Duester G. Retinoic-acid signalling in node ectoderm and posterior neural plate directs left-right patterning of somitic mesoderm. Nat Cell Biol. 2006;8:271–277. doi: 10.1038/ncb1374. [DOI] [PMC free article] [PubMed] [Google Scholar]
- 20.Avilion AA, et al. Multipotent cell lineages in early mouse development depend on SOX2 function. Genes Dev. 2003;17:126–140. doi: 10.1101/gad.224503. [DOI] [PMC free article] [PubMed] [Google Scholar]
- 21.Hart AH, Hartley L, Ibrahim M, Robb L. Identification, cloning and expression analysis of the pluripotency promoting Nanog genes in mouse and human. Dev Dyn. 2004;230:187–198. doi: 10.1002/dvdy.20034. [DOI] [PubMed] [Google Scholar]
- 22.Pfister S, Steiner KA, Tam PP. Gene expression pattern and progression of embryogenesis in the immediate post-implantation period of mouse development. Gene Expr Patterns. 2007;7:558–573. doi: 10.1016/j.modgep.2007.01.005. [DOI] [PubMed] [Google Scholar]
- 23.Inman KE, Downs KM. Localization of Brachyury (T) in embryonic and extraembryonic tissues during mouse gastrulation. Gene Expr Patterns. 2006;6:783–793. doi: 10.1016/j.modgep.2006.01.010. [DOI] [PubMed] [Google Scholar]
- 24.McGrath KE, Koniski AD, Maltby KM, McGann JK, Palis J. Embryonic expression and function of the chemokine SDF-1 and its receptor, CXCR4. Dev Biol. 1999;213:442–456. doi: 10.1006/dbio.1999.9405. [DOI] [PubMed] [Google Scholar]
- 25.Rivera-Perez JA, Mager J, Magnuson T. Dynamic morphogenetic events characterize the mouse visceral endoderm. Dev Biol. 2003;261:470–487. doi: 10.1016/s0012-1606(03)00302-6. [DOI] [PubMed] [Google Scholar]
- 26.Lu CC, Brennan J, Robertson EJ. From fertilization to gastrulation: axis formation in the mouse embryo. Curr Opin Genet Dev. 2001;11:384–392. doi: 10.1016/s0959-437x(00)00208-2. [DOI] [PubMed] [Google Scholar]
- 27.Kanai-Azuma M, et al. Depletion of definitive gut endoderm in Sox17-null mutant mice. Development. 2002;129:2367–2379. doi: 10.1242/dev.129.10.2367. [DOI] [PubMed] [Google Scholar]
- 28.Warren L, Bryder D, Weissman IL, Quake SR. Transcription factor profiling in individual hematopoietic progenitors by digital RT-PCR. Proc Natl Acad Sci USA. 2006;103:17807–17812. doi: 10.1073/pnas.0608512103. [DOI] [PMC free article] [PubMed] [Google Scholar]
- 29.Tada S, et al. Characterization of mesendoderm: a diverging point of the definitive endoderm and mesoderm in embryonic stem cell differentiation culture. Development. 2005;132:4363–4374. doi: 10.1242/dev.02005. [DOI] [PubMed] [Google Scholar]
- 30.Bondue A, et al. Mesp1 acts as a master regulator of multipotent cardiovascular progenitor specification. Cell Stem Cell. 2008;3:69–84. doi: 10.1016/j.stem.2008.06.009. [DOI] [PubMed] [Google Scholar]
- 31.Yang L, et al. Human cardiovascular progenitor cells develop from a KDR+ embryonic-stem-cell-derived population. Nature. 2008;453:524–528. doi: 10.1038/nature06894. [DOI] [PubMed] [Google Scholar]
- 32.Arnold SJ, Robertson EJ. Making a commitment: cell lineage allocation and axis patterning in the early mouse embryo. Nat Rev Mol Cell Biol. 2009;10:91–103. doi: 10.1038/nrm2618. [DOI] [PubMed] [Google Scholar]
- 33.Aydin S, et al. Influence of microvascular endothelial cells on transcriptional regulation of proximal tubular epithelial cells. Am J Physiol Cell Physiol. 2008;294:C543–554. doi: 10.1152/ajpcell.00307.2007. [DOI] [PubMed] [Google Scholar]
- 34.Akeson AL, Brooks SK, Thompson FY, Greenberg JM. In vitro model for developmental progression from vasculogenesis to angiogenesis with a murine endothelial precursor cell line, MFLM-4. Microvasc Res. 2001;61:75–86. doi: 10.1006/mvre.2000.2257. [DOI] [PubMed] [Google Scholar]
- 35.Levenberg S, Golub JS, Amit M, Itskovitz-Eldor J, Langer R. Endothelial cells derived from human embryonic stem cells. Proc Natl Acad Sci U S A. 2002;99:4391–4396. doi: 10.1073/pnas.032074999. [DOI] [PMC free article] [PubMed] [Google Scholar]
- 36.Anson-Cartwright L, et al. The glial cells missing-1 protein is essential for branching morphogenesis in the chorioallantoic placenta. Nat Genet. 2000;25:311–314. doi: 10.1038/77076. [DOI] [PubMed] [Google Scholar]
- 37.Yamada K, Ogawa H, Honda S, Harada N, Okazaki T. A GCM motif protein is involved in placenta-specific expression of human aromatase gene. J Biol Chem. 1999;274:32279–32286. doi: 10.1074/jbc.274.45.32279. [DOI] [PubMed] [Google Scholar]
- 38.Salido EC, Yen PH, Barajas L, Shapiro LJ. Steroid sulfatase expression in human placenta: immunocytochemistry and in situ hybridization study. J Clin Endocrinol Metab. 1990;70:1564–1567. doi: 10.1210/jcem-70-6-1564. [DOI] [PubMed] [Google Scholar]
- 39.Sica GL, et al. B7-H4, a molecule of the B7 family, negatively regulates T cell immunity. Immunity. 2003;18:849–861. doi: 10.1016/s1074-7613(03)00152-3. [DOI] [PubMed] [Google Scholar]
- 40.Apps R, et al. Genome-wide expression profile of first trimester villous and extravillous human trophoblast cells. Placenta. 2011;32:33–43. doi: 10.1016/j.placenta.2010.10.010. [DOI] [PMC free article] [PubMed] [Google Scholar]
- 41.Rossant J, Cross JC. Placental development: lessons from mouse mutants. Nat Rev Genet. 2001;2:538–548. doi: 10.1038/35080570. [DOI] [PubMed] [Google Scholar]
- 42.Garvey W, Fathi A, Bigelow F, Carpenter B, Jimenez C. Improved Movat pentachrome stain. Stain Technol. 1986;61:60–62. doi: 10.3109/10520298609110708. [DOI] [PubMed] [Google Scholar]
- 43.Chen CP, Liu SH, Lee MY, Chen YY. Heparan sulfate proteoglycans in the basement membranes of the human placenta and decidua. Placenta. 2008;29:309–316. doi: 10.1016/j.placenta.2008.01.002. [DOI] [PubMed] [Google Scholar]
- 44.Peng L, Huang Y, Jin F, Jiang SW, Payne AH. Transcription enhancer factor-5 and a GATA-like protein determine placental-specific expression of the Type I human 3beta-hydroxysteroid dehydrogenase gene, HSD3B1. Mol Endocrinol. 2004;18:2049–2060. doi: 10.1210/me.2004-0028. [DOI] [PMC free article] [PubMed] [Google Scholar]
- 45.Ito N, et al. Ultrastructural localization of aminopeptidase A/angiotensinase and placental leucine aminopeptidase/oxytocinase in chorionic villi of human placenta. Early Hum Dev. 2003;71:29–37. doi: 10.1016/s0378-3782(02)00112-3. [DOI] [PubMed] [Google Scholar]
- 46.Yu J, et al. Induced pluripotent stem cell lines derived from human somatic cells. Science. 2007;318:1917–1920. doi: 10.1126/science.1151526. [DOI] [PubMed] [Google Scholar]
- 47.Palmieri SL, Peter W, Hess H, Scholer HR. Oct-4 transcription factor is differentially expressed in the mouse embryo during establishment of the first two extraembryonic cell lineages involved in implantation. Dev Biol. 1994;166:259–267. doi: 10.1006/dbio.1994.1312. [DOI] [PubMed] [Google Scholar]
- 48.Yusuf F, Rehimi R, Dai F, Brand-Saberi B. Expression of chemokine receptor CXCR4 during chick embryo development. Anat Embryol (Berl) 2005;210:35–41. doi: 10.1007/s00429-005-0013-9. [DOI] [PubMed] [Google Scholar]
- 49.Wang P, Rodriguez RT, Wang J, Ghodasara A, Kim SK. Targeting SOX17 in human embryonic stem cells creates unique strategies for isolating and analyzing developing endoderm. Cell Stem Cell. 2011;8:335–346. doi: 10.1016/j.stem.2011.01.017. [DOI] [PMC free article] [PubMed] [Google Scholar]
- 50.Matsuda T, et al. Expression of the receptor tyrosine kinase genes, Ror1 and Ror2, during mouse development. Mech Dev. 2001;105:153–156. doi: 10.1016/s0925-4773(01)00383-5. [DOI] [PubMed] [Google Scholar]
- 51.Schwabe GC, et al. Ror2 knockout mouse as a model for the developmental pathology of autosomal recessive Robinow syndrome. Dev Dyn. 2004;229:400–410. doi: 10.1002/dvdy.10466. [DOI] [PubMed] [Google Scholar]
- 52.Afzal AR, et al. Recessive Robinow syndrome, allelic to dominant brachydactyly type B, is caused by mutation of ROR2. Nat Genet. 2000;25:419–422. doi: 10.1038/78107. [DOI] [PubMed] [Google Scholar]
- 53.Evseenko D, et al. Mapping the first stages of mesoderm commitment during differentiation of human embryonic stem cells. Proc Natl Acad Sci U S A. 2010;107:13742–13747. doi: 10.1073/pnas.1002077107. [DOI] [PMC free article] [PubMed] [Google Scholar]
- 54.Baldwin HS. Early embryonic vascular development. Cardiovasc Res. 1996;31(Spec No):E34–45. [PubMed] [Google Scholar]
- 55.Inman KE, Downs KM. The murine allantois: emerging paradigms in development of the mammalian umbilical cord and its relation to the fetus. Genesis. 2007;45:237–258. doi: 10.1002/dvg.20281. [DOI] [PubMed] [Google Scholar]
- 56.Gurtner GC, et al. Targeted disruption of the murine VCAM1 gene: essential role of VCAM-1 in chorioallantoic fusion and placentation. Genes Dev. 1995;9:1–14. doi: 10.1101/gad.9.1.1. [DOI] [PubMed] [Google Scholar]
- 57.Kukk E, et al. VEGF-C receptor binding and pattern of expression with VEGFR-3 suggests a role in lymphatic vascular development. Development. 1996;122:3829–3837. doi: 10.1242/dev.122.12.3829. [DOI] [PubMed] [Google Scholar]
- 58.Blasi F, Carmeliet P. uPAR: a versatile signalling orchestrator. Nat Rev Mol Cell Biol. 2002;3:932–943. doi: 10.1038/nrm977. [DOI] [PubMed] [Google Scholar]
- 59.Solberg H, Rinkenberger J, Dano K, Werb Z, Lund LR. A functional overlap of plasminogen and MMPs regulates vascularization during placental development. Development. 2003;130:4439–4450. doi: 10.1242/dev.00642. [DOI] [PMC free article] [PubMed] [Google Scholar]
- 60.Leksa V, et al. TGF-beta-induced apoptosis in endothelial cells mediated by M6P/IGFII-R and mini-plasminogen. J Cell Sci. 2005;118:4577–4586. doi: 10.1242/jcs.02587. [DOI] [PubMed] [Google Scholar]
- 61.Pierleoni C, Castellucci M, Kaufmann P, Lund LR, Schnack Nielsen B. Urokinase receptor is up-regulated in endothelial cells and macrophages associated with fibrinoid deposits in the human placenta. Placenta. 2003;24:677–685. doi: 10.1016/s0143-4004(03)00082-1. [DOI] [PubMed] [Google Scholar]
- 62.Wang ZZ, et al. Endothelial cells derived from human embryonic stem cells form durable blood vessels in vivo. Nat Biotechnol. 2007;25:317–318. doi: 10.1038/nbt1287. [DOI] [PubMed] [Google Scholar]
- 63.Rossant J, Lis WT. Potential of isolated mouse inner cell masses to form trophectoderm derivatives in vivo. Dev Biol. 1979;70:255–261. doi: 10.1016/0012-1606(79)90022-8. [DOI] [PubMed] [Google Scholar]
- 64.Beddington RS, Robertson EJ. An assessment of the developmental potential of embryonic stem cells in the midgestation mouse embryo. Development. 1989;105:733–737. doi: 10.1242/dev.105.4.733. [DOI] [PubMed] [Google Scholar]
- 65.Wilson V, Rashbass P, Beddington RS. Chimeric analysis of T (Brachyury) gene function. Development. 1993;117:1321–1331. doi: 10.1242/dev.117.4.1321. [DOI] [PubMed] [Google Scholar]
- 66.Zhang H, Bradley A. Mice deficient for BMP2 are nonviable and have defects in amnion/chorion and cardiac development. Development. 1996;122:2977–2986. doi: 10.1242/dev.122.10.2977. [DOI] [PubMed] [Google Scholar]
- 67.Mitsui T, et al. Hypertension and angiotensin II hypersensitivity in aminopeptidase A-deficient mice. Mol Med. 2003;9:57–62. [PMC free article] [PubMed] [Google Scholar]
- 68.Mao Q. BCRP/ABCG2 in the placenta: expression, function and regulation. Pharm Res. 2008;25:1244–1255. doi: 10.1007/s11095-008-9537-z. [DOI] [PMC free article] [PubMed] [Google Scholar]
- 69.Tang C, et al. Identification of SSEA-5, a novel surface glycan on human pluripotent stem cells and its application to remove teratoma-forming cells as part of a surface antibody panel. Nat Biotechnol. 2011 doi: 10.1038/nbt.1947. [DOI] [PMC free article] [PubMed] [Google Scholar]
- 70.Thomson JA, et al. Embryonic stem cell lines derived from human blastocysts. Science. 1998;282:1145–1147. doi: 10.1126/science.282.5391.1145. [DOI] [PubMed] [Google Scholar]
Associated Data
This section collects any data citations, data availability statements, or supplementary materials included in this article.