

Abstract
Pulmonary LPS exposure plays a key role in exacerbation of lung diseases such as chronic obstructive pulmonary disease and asthma. However, little is known about the effects of repeated LPS exposure in the lung microenvironment. We have developed a novel murine model of pulmonary LPS tolerance induced by intratracheal (i.t.) administration of LPS. First, we show that pulmonary LPS exposure does not induce whole-body refractoriness to systemic LPS, because i.t. administration followed by i.p. administration did not decrease plasma TNF-α. However, a local refractory state can be induced with two i.t. LPS exposures. Pulmonary LPS tolerance was induced by i.t. administration of 100 ng LPS at time 0 and 48 h. Nontolerant mice received PBS at time 0 and LPS at 48 h. Bronchoalveolar lavage levels of TNF-α were significantly attenuated in tolerant mice vs nontolerant mice (1597 pg/ml vs 7261 pg/ml). TNF-α mRNA was significantly reduced in bronchoalveolar lavage cells (5-fold) and lung tissue (10-fold). No reduction was seen in neutrophil numbers in the bronchoalveolar lavage fluid, myeloperoxidase activity, or expression of neutrophil chemoattractants CXCL1 and CXCL2, reflecting the specificity of the response. The reduction in TNF-α was accompanied by a significant increase in soluble receptors, TNF-SRI (159 pg/ml vs 206 pg/ml) and TNF-SRII (1366 pg/m vs 2695 pg/ml). In conclusion, pulmonary LPS tolerance results in a specific reduction in TNF-α expression, while the neutrophilic response is unaffected. This response may be a mechanism to limit tissue damage by reducing TNF-α levels, while still maintaining the antimicrobial capacity of the lung.
LPS is the glycolipid component of the cell membrane of Gram-negative bacteria. It is a potent inducer of the innate immune response and signals through the pattern recognition receptor TLR-4 (1). Recognition of LPS by various cell types results in the production of proinflammatory cytokines such as TNF-α and IL-6, as well as the neutrophil chemoattractants KC (CXCL1) and MIP-2 (CXCL2) (2). Although quick recognition of pathogens is indispensable to the host, excessive inflammation in response to prolonged exposure can prove detrimental (3, 4). As such, compensatory mechanisms to avoid excessive inflammation and organ damage have developed. LPS tolerance represents one such method (5).
LPS tolerance is characterized by a refractoriness to LPS induced by prior LPS exposure. Previous sublethal LPS exposure can confer protection against lethal doses of LPS, as well as protection from septic shock and systemic bacterial infections (6–8). This phenomenon has been shown to be largely mediated by monocytes and macrophages, however the involvement of other cell types has not been excluded (9–11). Restimulation of peritoneal exudate macrophages pre-exposed to LPS shows significant reductions in production of TNF-α protein and mRNA (12, 13). Impairment of cytokine production has also been demonstrated in ex vivo-stimulated blood of septic patients (14).
Although its relevance to systemic infection and the involvement of monocytes is clear, little is known about the role LPS tolerance plays in local microenvironment contact with low dose LPS, such as in the lung. This is especially important given the lung’s constant exposure to various potentially pathogenic materials, which results in tight regulation of pulmonary immune responses (15, 16). Pulmonary LPS exposure has been linked to various adverse conditions, including persistent inflammation, wheezing, and shortness of breath, and has also been linked to asthma severity. Interestingly, LPS inhalation has been shown to both protect and exacerbate allergic asthma (17–19). To date, LPS tolerance has been characterized mainly as it pertains to septic shock, focusing on individual cell populations, mainly monocytes and macrophages. Characterization of the manner in which LPS tolerance modulates to local immune environment is crucial to determine how the host limits organ injury to LPS exposure without inducing immunosuppression.
Materials and Methods
Animals
Female BALB/c mice, 9–12 wk old were purchased from The Jackson Laboratory and maintained under standard laboratory conditions. The mice were housed in a temperature and humidity controlled room with 12 h light/dark cycles and allowed food and water ad libitum. All experiments were performed according to the National Institutes of Health guidelines and were approved by the Boston University Institutional Animal Care and Use Committee.
Induction of acute LPS tolerance
Mice were given PBS or 100 ng Escherichia coli LPS O5:B111 (Sigma-Aldrich, cat. no. 62325) in a total volume of 50 μl by direct intratracheal challenge under isofluorane anesthesia (20). In brief, mice were lightly anesthetized and suspended by their front incisors on a vertical board. Their tails were taped down to support the body weight. The tongue was gently extended and the liquid was placed at the base of the oropharynx so that it was inhaled. Mice received the second challenge of either PBS or 100 ng LPS 48 h later. Animals were sacrificed at various timepoints thereafter as indicated in the figure legends. To determine whether systemic tolerance was induced, mice received an intratracheal challenge of PBS or 100 ng LPS at time 0. They were then injected i.p. with 100 ng LPS in 100 μL PBS at 48 h. Blood was collected from the facial vein at the times indicated in the figure legend. EDTA plasma was collected and assayed by ELISA for TNF-α and IL-6.
Bronchoalveolar lavage and lung homogenate preparation
Mice were euthanized by cervical dislocation. For bronchoalveolar lavage (BAL),3 the trachea was cannulated and the lung was lavaged with 2, 1 ml aliquots of warm HBSS (Invitrogen). Both aliquots were centrifuged. The supernatant of the first wash was removed and frozen at −20°C for later cytokine analysis. The supernatant from the second wash was discarded and the cell pellets from both aliquots were resuspended and combined. Total cell counts were obtained using a Beckman-Coulter particle counter model ZF (Coulter Electronics). Cytospin preparations were stained with Diff-Quick and 300 cell differential counts were performed to determine the absolute numbers of neutrophils. The right lung was removed, placed in ice cold protease inhibitor mixture (Roche) containing Triton X in PBS, and homogenized with three, 10 s passes in a Brinkmann Polytron PT3000 homogenizer. An aliquot was removed and sonicated in hexadecyltrimethylammonium bromide buffer for myeloperoxidase assay. The homogenized and sonicated mixtures were centrifuged at 15,000g for 15 min. The homogenate supernatant was removed and stored at −20°C for cytokine analysis and the supernatant from the sonicated fraction was used immediately for myeloperoxidase assay.
ELISA
Cytokines, chemokines, and TNF soluble receptors were measured by sandwich ELISA as previously described (21). All matched Ab pairs were purchased from R&D Systems. Lung homogenate samples were assayed with the addition of 20% normal lung homogenate to the standards to adjust for the increased background caused by nonspecific matrix effects.
mRNA isolation and RT-PCR
mRNA was extracted using TRIzol Reagent (Invitrogen). PCR were conducted using iScript One-Step PCR kit with Sybr Green (Bio-Rad) using the following primer pairs: TNF-α: Sense 5′-ACTCCCAGACCCGGTATCTT –3′; Antisense 5′- CTGCAATTGACCGTCTTCT–3′, IL-6: Sense 5′- ACGGCCTTCCCTACTTCACA–3′; Antisense 5′- TCCAGAAGACCAGAGGAAATTTT–3′, KC: Sense 5′- TCAAGAACATCCAGAGCTTGAAG–3′; Antisense 5′- GGACACCTTTTAGCATCTTTTGG–3′, MIP-2: Sense 5′- CACCAACCACCAGGCTACAG–3′; Antisense 5′- CAGTTAGCCTTGCCTTTGTTCA-3′, GAPDH: Sense 5′- AACGACCCCTTCATTGAC–3′; Antisense 5′- TCCACGACATACTCAGCAC–3′. Real-time PCR were performed on a Bio-Rad iQ5 light cycler. Data was normalized to the housekeeping gene and expressed as fold increase above PBS/PBS group using the 2 −ΔΔCt) method (22).
Determination of TNF-α and TNF-soluble receptor interactions
In brief, 3000 pg/ml or 300 pg/ml recombinant TNF-α were mixed with increasing concentrations of either TNF-SRI or TNF-SRII, as indicated in the figure legend, in PBS + 2% FCS and incubated at room temperature for 1 h. TNF-α was then assayed by standard ELSIA.
LPS assay
LPS was assayed in BAL fluid at a 1:2 dilution in pyrogen-free water using the Limulus amoebocyte lysate (LAL) assay (Lonza). Ninety-six-well microplates and substrate solutions were warmed to 37°C. Fifty microliters of sample and standard were added to the plate in duplicate followed by 50 μl LAL regent. The plate was incubated at 37°C for 10 min. One hundred microliters of substrate solution was then added to each well and the plate was incubated at 37°C for 6 min. The reaction was stopped with 50 μl 25% glacial acetic acid. The absorbance was read at 405 nm.
Myeloperoxidase assay
The myeloperoxidase assay was performed as previously described (23). In brief, 20 μl of the sonicated mixture was pipetted in duplicate into wells of a 96-well plate. Two hundred microliters of assay buffer containing o-dianisidine HCl (Sigma-Aldrich, D-3252), 87.8 mM monobasic potassium phosphate, 12.3 mM dibasic potassium phosphate, and 0.005% hydrogen peroxide was added to each well and kinetic measurements were taken at 465 nm every 10 s. Six total readings were taken and myeloperoxidase activity is expressed as the slope of the linear plot of these data.
Statistical analysis
All data are presented as mean ± SEM. Statistical analysis was performed using one-way ANOVA. Turkey’s post test for pairwise comparison was performed when the F value was significant. Statistical significance was achieved when p < 0.05 at 95% confidence interval.
Results
Compartmentalization of pulmonary LPS tolerance
To determine whether i.t. administration of LPS induced systemic LPS tolerance, mice received an i.t. challenge of PBS or 100 ng LPS at time 0, and received an i.p. injection of LPS at 48 h. Blood was collected by facial vein bleed at the indicated timepoints, plasma was recovered and assayed for TNF-α and IL-6. Blood was sampled from each mouse repeatedly rather than sacrificing the mice at each time point, to reduce the number of animals used in the experiment. Plasma TNF-α levels peaked in both groups at 1 h post final challenge and begin to drop thereafter, while IL-6 levels peak 2 h post final challenge (Fig. 1). Animals receiving i.t. LPS challenge and those receiving PBS produced equivalent concentrations of both TNF-α and IL-6, indicating that i.t. LPS administration does not result in systemic tolerance to LPS. In fact, the total cytokine production over the 6 h time course as calculated by the area under the curve, was similar for TNF-α (tolerant vs nontolerant; (mean ± SEM) 2037 ± 298 vs 1974 ± 302) and IL-6 (23982 ± 7122 vs 20687 ± 4397). Due to limited sample volumes, additional cytokines and chemokines could not be assayed.
FIGURE 1.
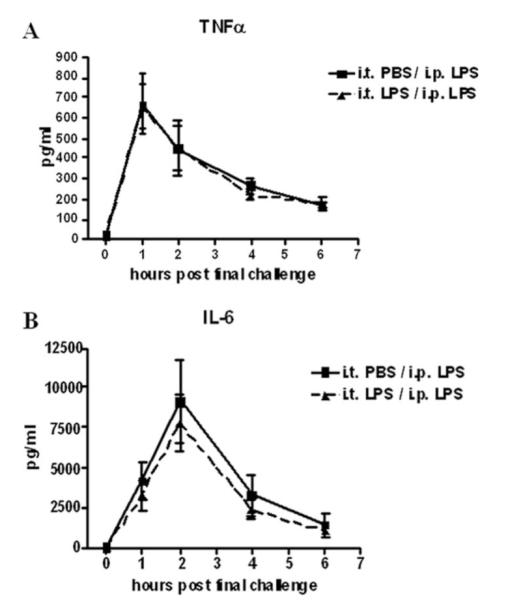
Compartmentalization of pulmonary LPS tolerance. Mice were given either PBS or 100 ng LPS on day 0 by direct intratracheal installation. After 48 h, mice were injected i.p. with 100 ng LPS. Blood was collected by facial vein bleed at the indicated timepoints post final challenge and plasma TNF-α (A) and IL-6 (B) levels were measured. Values are expressed as mean ± SEM. n = 6 mice per group.
Acute phase cytokine expression in the lung after LPS tolerance induction
Attenuation of acute phase cytokines, especially TNF-α protein and mRNA production are hallmark features of LPS tolerance (12, 13). As such, we sought to first verify that LPS tolerance can be induced by isolated i.t. LPS exposure. For these experiments, tolerant mice received two i.t. exposures of LPS, one at time 0 and again at 48 h. Nontolerant mice received PBS for the time 0 challenge and LPS at 48 h. Two additional control groups, one receiving PBS for both challenges (PBS/PBS) as well as one receiving LPS for the first and PBS for the second challenge (LPS/PBS) were also included. The LPS/PBS group was included to determine whether the first LPS exposure had any residual effects lasting until the 48h challenge.
TNF-α protein was reduced ~78% in the BAL fluid of LPS-tolerant mice compared with nontolerant animals at 4 h post final challenge (Fig. 2A). In addition, TNF-α mRNA was significantly reduced in cells isolated from the BAL fluid at 30 min post final challenge (Fig. 2B). At this early time point (30 min), the cells recovered in the BAL fluid of nontolerant mice contained roughly 2.2 × 10⁴ neutrophils, while BAL fluid from the tolerant group showed a significant contribution of neutrophils (~9.8 × 10⁴). This also represents the time point of maximal TNF-α mRNA production (24). TNF-α protein in the lung tissue of tolerant mice at 4 h was reduced, but not significantly (Fig. 2C), while mRNA was significantly reduced at 1 h (Fig. 2D).
FIGURE 2.

TNF-α expression after induction of LPS tolerance. A, BAL TNF-α protein levels 4 h post final challenge and mRNA expression (B) from cells recovered from the BAL 30 min post final challenge. C, Lung homogenate protein levels 4 h post final challenge and kinetics of mRNA expression in lung tissue (D). mRNA results are expressed as fold increase above PBS/PBS group and all data are expressed as mean ± SEM. n = 8–10 mice per group. *, p < 0.05 compared with PBS/PBS group. #, p < 0.05 compared with nontolerant group.
Production of IL-6 protein at 4 h in the alveolar compartment was significantly reduced in the LPS tolerant animals (~25%), although the reduction was not nearly as dramatic as TNF-α. IL-6 mRNA measured in the tissue, however was reduced by 400-fold compared with nontolerant mice (Fig. 3). We suspect that although this reduction is significant, the 100-fold increase in IL-6 mRNA seen in the tolerant mice approaches the maximal capacity of the cells to translate the protein. Further mRNA induction would not induce much more protein expression, accounting for the fact that a similar dramatic reduction in IL-6 protein was not observed (25). Additionally, the antiinflammatory mediator IL-10 has been shown to play a role in various models of LPS tolerance (26, 27). However, we found no detectable IL-10 in the BAL fluid of nontolerant or tolerant mice, further highlighting the specificity of pulmonary LPS tolerance (data not shown).
FIGURE 3.
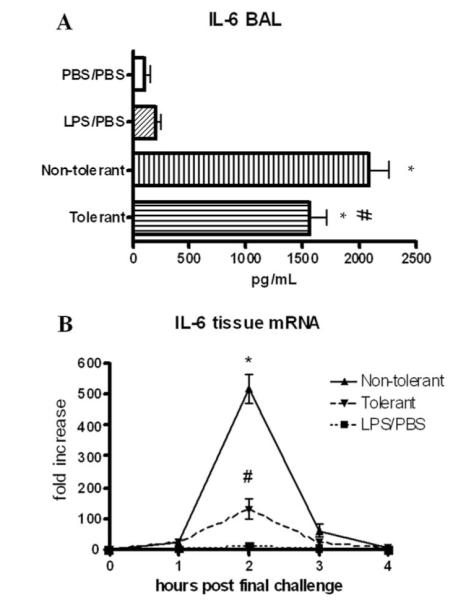
IL-6 expression upon induction of LPS tolerance. A, IL-6 protein levels in BAL and lung homogenate 4 h post final challenge. B, Lung tissue IL-6 mRNA at various timepoints post final challenge. mRNA was expressed as fold increase above PBS/PBS group. Data are expressed as mean ± SEM. n = 8–10 mice per group. For protein, *, p < 0.05 compared with PBS/PBS group. For mRNA, *, p < 0.05 compared with LPS/PBS group. #, p < 0.05 compared with nontolerant group for both protein and mRNA.
TNF soluble receptor production
We also assessed production of the TNF soluble receptors TNF-SRI and TNF-SRII for their contribution to the altered immune environment that develops in response to LPS tolerance. Both TNF-SRI and TNF-SRII were significantly increased in LPS-tolerant mice in the BAL fluid 4 h post final challenge (Fig. 4), indicating that a compensatory anti-inflammatory response is induced upon repeated LPS stimulation that is independent of the reduction in TNF-α levels. Additionally, TNF-SRII likely plays a greater physiological role as it is expressed at 10-fold higher concentrations than TNF-SRI.
FIGURE 4.
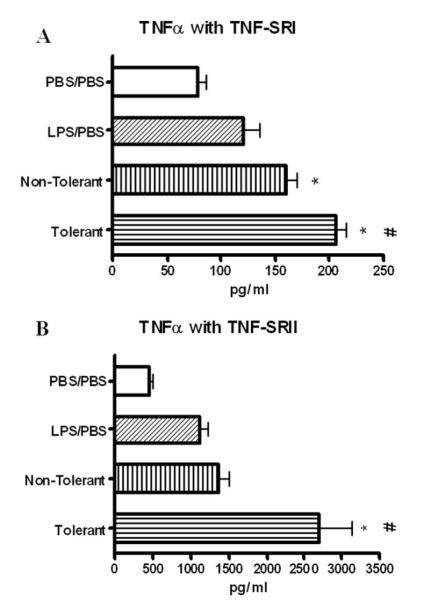
Expression of TNF-SRI (A) and TNF-SRII (B) in BAL fluid at 4 h post final challenge. Data expressed as mean ± SEM. n = 8–10 mice per group. *, p < 0.05 compared with PBS/PBS group. #, p < 0.05 compared with nontolerant group.
TNF-α ELISA validation
Reduced TNF-α protein, combined with increased soluble receptor expression, called into question the ability of our ELISA to measure TNF-α complexed with soluble receptors. To address this issue, high (3000pg/ml) and low (300 pg/ml) concentrations of TNF-α were mixed with various concentrations of either TNF-SRI or TNF-SRII, allowed to incubate at room temperature and then assayed by sandwich ELISA for TNF-α. These concentrations of soluble receptors spanned the range observed in our experimental results. As shown in Fig. 5, our assay is able to measure both free and complexed TNF-α. Comparison by one-way ANOVA showed no significant difference in TNF-α for all soluble receptor concentrations, showing that soluble receptors do not inhibit measurement of TNF-α. This indicates that the observed reduction in TNF-α is a relevant physiologic observation and not a false observation due to assay limitations.
FIGURE 5.
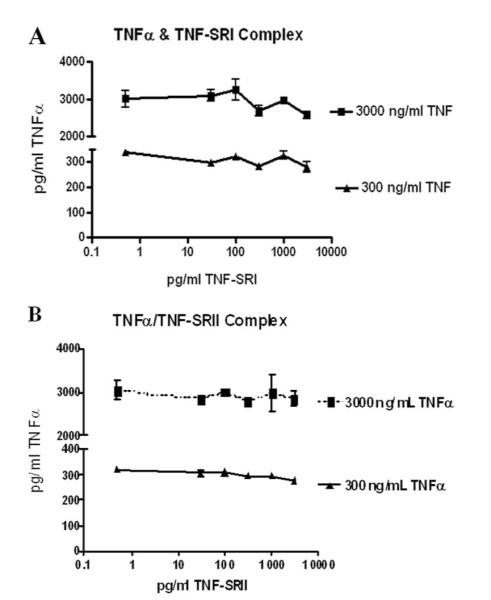
Validation of TNF-α ELISA: Measurement of TNF-α in complex with TNF-SRI (A) and TNF-SRII (B). High (3000pg/ml) and low (300pg/ml) concentrations of recombinant TNF-α were mixed with various concentrations of TNF-SRI and TNF-SRII and assayed by standard ELISA. Data shown are a combination of two experiments. Soluble receptor concentrations are represented on a log scale.
LPS clearance from the lung microenvironment
We determined LPS levels in the lung to assess whether or not LPS was still present and able to signal several hours post final challenge, and to determine whether or not LPS tolerance modulates the ability of mice to clear LPS. LPS tolerant animals have a slight, but not significant reduction in LPS concentrations in the lung as determined by limulus assay (Fig. 6), indicating that the reduction in TNF-α levels was not the result of increased LPS clearance.
FIGURE 6.
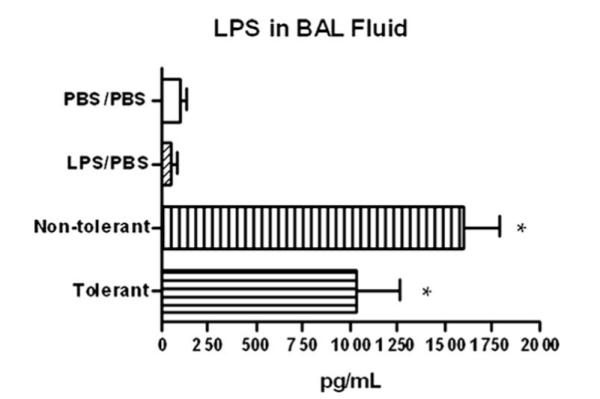
LPS clearance from the lung microenvironment. LPS levels were measured in the BAL fluid 4 h post final challenge by endpoint LAL assay. *, p < 0.05 compared with PBS/PBS group.
CXC chemokine expression and neutrophil influx
We next assayed whether LPS tolerance affected the expression of CXC chemokines and the ability of LPS tolerant animals to recruit neutrophils to the lung. Fig. 7, A and B show no attenuation in the production of CXCL1 or CXCL2 in LPS tolerant animals in the alveolar compartment. However, slight reductions in both CXCL1 and CXCL2 were observed in the organ homogenates (Fig. 7, C and D). CXCL1 mRNA peaked at 2 h post final challenge, while CXCL 2 mRNA peaked at 1 h, and LPS tolerance induction had no effect on the mRNA production of either of these chemokines (Fig. 7, E and F).
FIGURE 7.

Neutrophil chemoattractant protein expression after induction of LPS tolerance. KC (CXCL1) (A) and MIP-2 (CXCL2) (B) expression in BAL fluid at 4 h post final challenge. KC (C) and D) MIP-2 (D) expression in lung homogenate (46) 4 h. KC (E) and MIP-2 (F) lung tissue mRNA expression at various time-points post final challenge. mRNA was expressed as fold increase above PBS/PBS group. Data are expressed as mean ± SEM. n = 8–10 mice per group. For protein, *, p < 0.05 compared with PBS/PBS group. For mRNA, *, p < 0.05 compared with LPS/PBS group. #, p < 0.05 compared with nontolerant group for both protein and mRNA.
Cytospin preparations and 300 cell differential counts were performed to assess the ability of LPS-tolerant animals to recruit neutrophils to the lung in response to LPS challenge. LPS-tolerant animals are able to recruit comparable numbers of neutrophils at 4 h compared with nontolerant animals (Fig. 8A). No statistically significant difference was observed for tissue myeloperoxidase activity in LPS tolerant mice, indicating that similar numbers of neutrophils were present in the lung tissue (Fig. 8B). Cytospin preparations demonstrate the neutrophils recovered from the lavage fluid in both tolerant and nontolerant mice (Fig. 8, C and D). Taken together, these data suggest that the prolonged presence of significant amounts of LPS in both nontolerant and tolerant mice (Fig. 6) may provide the signaling required for the continued production of CXC chemokines and subsequent neutrophil infiltration.
FIGURE 8.

Neutrophil recruitment and myeloperoxidase activity 4 h post final challenge. A, BAL fluid was collected and cytospins prepared from collected cells. Data are expressed as absolute cell number per mouse. B, After BAL, the right lung was collected and homogenized for myeloperoxidase assay. Data are expressed as mean ± SEM. n = 8–10 mice per group. *, p < 0.05 compared with PBS/PBS group. Cytospin preparations of cells recovered for BAL fluid at 4 h from nontolerant (C) and tolerant (D) mice and represented at ×1000.
Discussion
LPS tolerance has long been defined as refractoriness to LPS following an initial LPS challenge. Previous exposure to LPS offers protection against subsequent lethal LPS challenge in mice and this tolerance has been shown to be principally mediated by macrophages (28, 29). LPS tolerance induction has been well studied in models of systemic bacterial infection and has been shown to enhance bacterial clearance in mice (8). Additionally, previous efforts have characterized LPS tolerance in various organs, including findings that TLR4 expression is decreased in the livers of LPS-tolerant mice (30). Most of these studies involve i.p. or i.v. administration of LPS, or ex vivo stimulation of isolated primary cells. Little data documents in vivo LPS tolerance and even less evaluates LPS tolerance specific to the lung microenvironment. Inhalational LPS exposure has been shown to cause various respiratory conditions, including wheezing and inflammation, and has been shown to modulate asthma severity. Given that the lung is a unique route of pathogen exposure, we have developed a novel model of in vivo pulmonary LPS tolerance (31, 32).
Previous in vivo studies induce LPS tolerance by pre-exposure to sublethal doses of LPS, followed by rechallenge with a lethal dose. We chose to develop a dosing regimen that more closely resembled inhalational exposure in the context of lung disease. In particular, 100 ng was chosen to recapitulate low-dose LPS exposure in several models of murine asthma (33, 34). We also chose the 48-h interval between pre-exposure and rechallenge based on studies demonstrating that the potential to induce LPS tolerance is exhausted by 72-h post pre-exposure (35). Therefore, the 48-h interval was one that was likely to induce tolerance.
Intratracheal LPS exposure followed by i.p. exposure 48 h later does not result in systemic tolerance induction, highlighting the fact that this model is specific for pulmonary LPS tolerance (Fig. 1). Other studies have indirectly studied pulmonary LPS tolerance by systemic LPS administration followed by ex vivo stimulation of alveolar cells (35, 36). This experimental approach requires relatively high LPS doses (up to 100 μg/mouse) to cause vascular permeability and LPS leakage into the airways, where it can be taken up by alveolar macrophages. These models are clinically relevant in the cases of systemic bacterial infection and sepsis, but do not model day-to-day pulmonary LPS inhalation, and are therefore appropriate for the study of LPS-mediated lung diseases. Our model of direct pulmonary exposure closely mimics environmental LPS exposure by inhalation (37, 38).
We have also shown that LPS-tolerant mice are not impaired in their ability to clear LPS, as there is no significant difference in the concentration of LPS remaining in the lung 4 h post final challenge (Fig. 6). The prolonged presence of LPS may be responsible for CXC chemokine production, as well as the unimpaired neutrophil recruitment. As shown in Fig. 8A, the BAL compartment of LPS tolerant mice is composed of roughly 8.9 × 10⁴ neutrophils at the time of the second LPS challenge. The increased number of neutrophils in comparison to the nontolerant group (2.2 × 10⁴) is a key immune modulation that results from pre-exposure to LPS, and likely has a role in further chemokine production seen in the tolerant group. Lung histopathology of H&E stained lungs, which were not subjected to BAL, showed no significant presence of neutrophils in the tissue and alveolar space of both tolerant and nontolerant mice 4 h after the second LPS challenge (data not shown).
The production of compensatory anti-inflammatory mediators TNF-SRI and TNF-SRII were significantly increased in tolerant mice (Fig. 4). We have validated that our ELISA for measuring TNF-α detects free, as well as soluble receptor bound TNF-α, showing that the observed decrease in TNF-α protein is not merely the result of an assay limitation (Fig. 5). Still, this does not rule out the possibility that increased soluble receptor production may be responsible for increased binding and clearance of secreted TNF-α (39).
Several studies have implicated the IL receptor-associated kinase (IRAK)-M as a principle mediator of LPS tolerance in macrophages (40, 41). However, because IRAK signaling takes place upstream of NF-κB activation, which is responsible for regulating TNF-α, IL-6, and the CXC chemokines, it was not expected that IRAK-M plays a major role in the differential regulation of cytokines and chemokines seen in this model. Further, whole lung nuclear extracts in this model showed no difference in NF-κB activation between nontolerant and tolerant mice (data not shown).
Inhibition of TNF-α is an emerging therapeutic target for inflammatory diseases such as asthma and chronic obstructive pulmonary disease. Although controversial, serious side effects such as increased incidence of infection and pneumonia have been reported to result from use of these therapies (42, 43). The specific immune modulation induced by our model of LPS tolerance suggests a mechanism by which anti-TNF-α treatments have resulted in increased incidences of pneumonia and have been shown to inhibit treatment of pneumonia (44, 45). Pharmacological TNF-α inhibition has been shown to induce a local state of immunosuppression which includes reduced numbers of neutrophils (46, 47). This may render the lung more susceptible to infection by inhibiting the influx of neutrophils in response to bacterial challenge. Our data show that with LPS tolerance, TNF-α is suppressed, but neutrophils are still present, which may offer protection against bacterial infection. Further, we have shown that the mechanism of continued neutrophil recruitment is the sustained production of CXC chemokines in LPS tolerant mice.
LPS tolerance may also offer protection in the case of allergic asthma. In an OVA model, TLR4 deficient mice show significant attenuation of the hallmark features of asthma such as IgE production and eosinophil recruitment. These were restored by intratracheal administration of recombinant TNF-α 1 h after OVA sensitization (33). In the LPS tolerant state, TNF-α levels are low, which may offer protection against allergic sensitization. Indeed, much epidemiological data exist correlating repeated LPS exposure with reduced incidence of asthma, such as that seen in children raised on farms (48, 49). Further studies need to be conducted to determine whether or not those who do not develop asthma are tolerized to LPS and more importantly, whether they respond poorly to LPS challenge in terms of TNF-α production.
The selective immune modulation following induction of LPS tolerance suggests a novel mechanism by which immune regulation is achieved in the lung. The selective suppression of TNF-α may be a mechanism by which the lung prevents excess inflammation and injury caused by TNF α-induced cytokines, while the sustained ability to recruit neutrophils may offer protection against bacterial challenge. However, further studies are required to understand LPS-induced lung injury in the context of LPS tolerance. Additionally, further studies aimed at understanding the local immune modulation induced by pulmonary LPS tolerance are crucial to understanding how this can affect the onset and progression of various diseases such as asthma, pneumonia, and chronic obstructive pulmonary disease.
Footnotes
This work was supported by National Institutes of Health Grant R01 ES013528.
Abbreviations used in this paper: BAL, bronchoalveolar lavage; LAL, Limulus amoebocyte lysate; MPO, myeloperoxidase; IRAK, IL receptor-associated kinase.
Disclosures The authors have no financial conflict of interest.
References
- 1.Miller SI, Ernst RK, Bader MW. LPS, TLR4 and infectious disease diversity. Nat. Rev. Microbiol. 2005;3:36–46. doi: 10.1038/nrmicro1068. [DOI] [PubMed] [Google Scholar]
- 2.Bosshart H, Heinzelmann M. Targeting bacterial endotoxin: two sides of a coin. Ann. NY Acad. Sci. 2007;1096:1–17. doi: 10.1196/annals.1397.064. [DOI] [PubMed] [Google Scholar]
- 3.Yamada H, Mizuno S, Ross AC, Sugawara I. Retinoic acid therapy attenuates the severity of tuberculosis while altering lymphocyte and macrophage numbers and cytokine expression in rats infected with Mycobacterium tuberculosis. J. Nutr. 2007;137:2696–2700. doi: 10.1093/jn/137.12.2696. [DOI] [PMC free article] [PubMed] [Google Scholar]
- 4.Tracey KJ, Wei H, Manogue KR, Fong Y, Hesse DG, Nguyen HT, Kuo GC, Beutler B, Cotran RS, Cerami A, et al. Cachectin/tumor necrosis factor induces cachexia, anemia, and inflammation. J. Exp. Med. 1988;167:1211–1227. doi: 10.1084/jem.167.3.1211. [DOI] [PMC free article] [PubMed] [Google Scholar]
- 5.Foster SL, Hargreaves DC, Medzhitov R. Gene-specific control of inflammation by TLR-induced chromatin modifications. Nature. 2007;447:972–978. doi: 10.1038/nature05836. [DOI] [PubMed] [Google Scholar]
- 6.Fraker DL, Stovroff MC, Merino MJ, Norton JA. Tolerance to tumor necrosis factor in rats and the relationship to endotoxin tolerance and toxicity. J. Exp. Med. 1988;168:95–105. doi: 10.1084/jem.168.1.95. [DOI] [PMC free article] [PubMed] [Google Scholar]
- 7.Zeisberger E, Roth J. Tolerance to pyrogens. Ann. NY Acad. Sci. 1998;856:116–131. doi: 10.1111/j.1749-6632.1998.tb08320.x. [DOI] [PubMed] [Google Scholar]
- 8.Wheeler DS, Lahni PM, Denenberg AG, Poynter SE, Wong HR, Cook JA, Zingarelli B. Induction of endotoxin tolerance enhances bacterial clearance and survival in murine polymicrobial sepsis. Shock. 2008;30:267–273. doi: 10.1097/shk.0b013e318162c190. [DOI] [PMC free article] [PubMed] [Google Scholar]
- 9.Medvedev AE, Sabroe I, Hasday JD, Vogel SN. Tolerance to microbial TLR ligands: molecular mechanisms and relevance to disease. J. Endotoxin Res. 2006;12:133–150. doi: 10.1179/096805106X102255. [DOI] [PubMed] [Google Scholar]
- 10.Sinistro A, Ciaprini C, Natoli S, Sussarello E, Carducci FC, Almerighi C, Capozzi M, Bolacchi F, Rocchi G, Bergamini A. Lipopolysaccharide desensitizes monocytes-macrophages to CD40 ligand stimulation. Immunology. 2007;122:362–370. doi: 10.1111/j.1365-2567.2007.02648.x. [DOI] [PMC free article] [PubMed] [Google Scholar]
- 11.Mathison JC, Virca GD, Wolfson E, Tobias PS, Glaser K, Ulevitch RJ. Adaptation to bacterial lipopolysaccharide controls lipopolysaccharide-induced tumor necrosis factor production in rabbit macrophages. J. Clin. Invest. 1990;85:1108–1118. doi: 10.1172/JCI114542. [DOI] [PMC free article] [PubMed] [Google Scholar]
- 12.Mathison J, Wolfson E, Steinemann S, Tobias P, Ulevitch R. Lipopolysaccharide (LPS) recognition in macrophages: participation of LPS-binding protein and CD14 in LPS-induced adaptation in rabbit peritoneal exudate macrophages. J. Clin. Invest. 1993;92:2053–2059. doi: 10.1172/JCI116801. [DOI] [PMC free article] [PubMed] [Google Scholar]
- 13.Ellaban E, Bolgos G, Remick D. Selective macrophage suppression during sepsis. Cell Immunol. 2004;231:103–111. doi: 10.1016/j.cellimm.2004.12.010. [DOI] [PubMed] [Google Scholar]
- 14.Heagy W, Hansen C, Nieman K, Cohen M, Richardson C, Rodriguez JL, West MA. Impaired ex vivo lipopolysaccharide-stimulated whole blood tumor necrosis factor production may identify “septic” intensive care unit patients. Shock. 2000;14:271–276. doi: 10.1097/00024382-200014030-00005. [DOI] [PubMed] [Google Scholar]
- 15.Thepen T, Hoeben K, Breve J, Kraal G. Alveolar macrophages down-regulate local pulmonary immune responses against intratracheally administered T-cell-dependent, but not T-cell-independent antigens. Immunology. 1992;76:60–64. [PMC free article] [PubMed] [Google Scholar]
- 16.Holt PG, Oliver J, Bilyk N, McMenamin C, McMenamin PG, Kraal G, Thepen T. Downregulation of the antigen presenting cell function(s) of pulmonary dendritic cells in vivo by resident alveolar macrophages. J. Exp. Med. 1993;177:397–407. doi: 10.1084/jem.177.2.397. [DOI] [PMC free article] [PubMed] [Google Scholar]
- 17.Bush RK, Peden DB. Advances in environmental and occupational disorders. J. Allergy Clin. Immunol. 2006;117:1367–1373. doi: 10.1016/j.jaci.2006.04.009. [DOI] [PubMed] [Google Scholar]
- 18.Schwartz DA, Thorne PS, Yagla SJ, Burmeister LF, Olenchock SA, Watt JL, Quinn TJ. The role of endotoxin in grain dust-induced lung disease. Am. J. Respir. Crit. Care Med. 1995;152:603–608. doi: 10.1164/ajrccm.152.2.7633714. [DOI] [PubMed] [Google Scholar]
- 19.Michel O, Ginanni R, Duchateau J, Vertongen F, Le Bon B, Sergysels R. Domestic endotoxin exposure and clinical severity of asthma. Clin. Exp. Allergy. 1991;21:441–448. doi: 10.1111/j.1365-2222.1991.tb01684.x. [DOI] [PubMed] [Google Scholar]
- 20.Gavett SH, O’Hearn DJ, Li X, Huang SK, Finkelman FD, Wills-Karp M. Interleukin 12 inhibits antigen-induced airway hyperresponsiveness, inflammation, and Th2 cytokine expression in mice. J. Exp. Med. 1995;182:1527–1536. doi: 10.1084/jem.182.5.1527. [DOI] [PMC free article] [PubMed] [Google Scholar]
- 21.Nemzek JA, Siddiqui J, Remick DG. Development and optimization of cytokine ELISAs using commercial antibody pairs. J. Immunol. Methods. 2001;255:149–157. doi: 10.1016/s0022-1759(01)00419-7. [DOI] [PubMed] [Google Scholar]
- 22.Giulietti A, Overbergh L, Valckx D, Decallonne B, Bouillon R, Mathieu C. An overview of real-time quantitative PCR: applications to quantify cytokine gene expression. Methods. 2001;25:386–401. doi: 10.1006/meth.2001.1261. [DOI] [PubMed] [Google Scholar]
- 23.Nemzek JA, Ebong SJ, Kim J, Bolgos GL, Remick DG. Keratinocyte growth factor pretreatment is associated with decreased macrophage inflammatory protein-2α concentrations and reduced neutrophil recruitment in acid aspiration lung injury. Shock. 2002;18:501–506. doi: 10.1097/00024382-200212000-00003. [DOI] [PubMed] [Google Scholar]
- 24.Wollenberg GK, DeForge LE, Bolgos G, Remick DG. Differential expression of tumor necrosis factor and interleukin-6 by peritoneal macrophages in vivo and in culture. Am. J. Pathol. 1993;143:1121–1130. [PMC free article] [PubMed] [Google Scholar]
- 25.Huey KA, McCusker RH, Kelley KW. Exaggerated expression of skeletal muscle-derived interleukin-6, but not TNFα, in mice lacking interleukin-10. J. Neuroimmunol. 2008;199:56–62. doi: 10.1016/j.jneuroim.2008.05.004. [DOI] [PMC free article] [PubMed] [Google Scholar]
- 26.Uhrig A, Banafsche R, Kremer M, Hegenbarth S, Hamann A, Neurath M, Gerken G, Limmer A, Knolle PA. Development and functional consequences of LPS tolerance in sinusoidal endothelial cells of the liver. J. Leukocyte Biol. 2005;77:626–633. doi: 10.1189/jlb.0604332. [DOI] [PubMed] [Google Scholar]
- 27.Murphey ED, Fang G, Varma TK, Sherwood ER. Improved bacterial clearance and decreased mortality can be induced by LPS tolerance and is not dependent upon IFN-γ. Shock. 2007;27:289–295. doi: 10.1097/01.shk.0000245024.93740.28. [DOI] [PubMed] [Google Scholar]
- 28.Zuckerman SH, Qureshi N. In vivo inhibition of lipopolysaccharide-induced lethality and tumor necrosis factor synthesis by Rhodobacter sphaeroides diphosphoryl lipid A is dependent on corticosterone induction. Infect. Immun. 1992;60:2581–2587. doi: 10.1128/iai.60.7.2581-2587.1992. [DOI] [PMC free article] [PubMed] [Google Scholar]
- 29.Freudenberg MA, Galanos C. Induction of tolerance to lipopolysaccharide (LPS)-D-galactosamine lethality by pretreatment with LPS is mediated by macrophages. Infect. Immun. 1988;56:1352–1357. doi: 10.1128/iai.56.5.1352-1357.1988. [DOI] [PMC free article] [PubMed] [Google Scholar]
- 30.De Creus A, Abe M, Lau AH, Hackstein H, Raimondi G, Thomson AW. Low TLR4 expression by liver dendritic cells correlates with reduced capacity to activate allogeneic T cells in response to endotoxin. J. Immunol. 2005;174:2037–2045. doi: 10.4049/jimmunol.174.4.2037. [DOI] [PubMed] [Google Scholar]
- 31.Khan AJ, Nanchal R. Cotton dust lung diseases. Curr. Opin. Pulm. Med. 2007;13:137–141. doi: 10.1097/MCP.0b013e32802c7ceb. [DOI] [PubMed] [Google Scholar]
- 32.Castellan RM, Olenchock SA, Kinsley KB, Hankinson JL. Inhaled endotoxin and decreased spirometric values: an exposure-response relation for cotton dust. N. Engl. J. Med. 1987;317:605–610. doi: 10.1056/NEJM198709033171005. [DOI] [PubMed] [Google Scholar]
- 33.Eisenbarth SC, Piggott DA, Huleatt JW, Visintin I, Herrick CA, Bottomly K. Lipopolysaccharide-enhanced, toll-like receptor 4-dependent T helper cell type 2 responses to inhaled antigen. J. Exp. Med. 2002;196:1645–1651. doi: 10.1084/jem.20021340. [DOI] [PMC free article] [PubMed] [Google Scholar]
- 34.Kim YK, Oh SY, Jeon SG, Park HW, Lee SY, Chun EY, Bang B, Lee HS, Oh MH, Kim YS, et al. Airway exposure levels of lipopolysaccharide determine type 1 versus type 2 experimental asthma. J. Immunol. 2007;178:5375–5382. doi: 10.4049/jimmunol.178.8.5375. [DOI] [PubMed] [Google Scholar]
- 35.Fitting C, Dhawan S, Cavaillon JM. Compartmentalization of tolerance to endotoxin. J. Infect. Dis. 2004;189:1295–1303. doi: 10.1086/382657. [DOI] [PubMed] [Google Scholar]
- 36.Kallapur SG, Jobe AH, Ball MK, Nitsos I, Moss TJ, Hillman NH, Newnham JP, Kramer BW. Pulmonary and systemic endotoxin tolerance in preterm fetal sheep exposed to chorioamnionitis. J. Immunol. 2007;179:8491–8499. doi: 10.4049/jimmunol.179.12.8491. [DOI] [PubMed] [Google Scholar]
- 37.Perzanowski MS, Miller RL, Thorne PS, Barr RG, Divjan A, Sheares BJ, Garfinkel RS, Perera FP, Goldstein IF, Chew GL. Endotoxin in inner-city homes: associations with wheeze and eczema in early childhood. J. Allergy Clin. Immunol. 2006;117:1082–1089. doi: 10.1016/j.jaci.2005.12.1348. [DOI] [PMC free article] [PubMed] [Google Scholar]
- 38.McKinley L, Kim J, Bolgos GL, Siddiqui J, Remick DG. Reproducibility of a novel model of murine asthma-like pulmonary inflammation. Clin. Exp. Immunol. 2004;136:224–231. doi: 10.1111/j.1365-2249.2004.02461.x. [DOI] [PMC free article] [PubMed] [Google Scholar]
- 39.Van Zee, J. K, Kohno T, Fischer E, Rock CS, Moldawer LL, Lowry SF. Tumor necrosis factor soluble receptors circulate during experimental and clinical inflammation and can protect against excessive tumor necrosis factor α in vitro and in vivo. Proc. Natl. Acad. Sci. USA. 1992;89:4845–4849. doi: 10.1073/pnas.89.11.4845. [DOI] [PMC free article] [PubMed] [Google Scholar]
- 40.Deng JC, Cheng G, Newstead MW, Zeng X, Kobayashi K, Flavell RA, Standiford TJ. Sepsis-induced suppression of lung innate immunity is mediated by IRAK-M. J. Clin. Invest. 2006;116:2532–2542. doi: 10.1172/JCI28054. [DOI] [PMC free article] [PubMed] [Google Scholar]
- 41.van ’t Veer C, van den Pangaart PS, van Zoelen MA, de Kruif M, Birjmohun RS, Stroes ES, de Vos AF, van der Poll T. Induction of IRAK-M is associated with lipopolysaccharide tolerance in a human endotoxemia model. J. Immunol. 2007;179:7110–7120. doi: 10.4049/jimmunol.179.10.7110. [DOI] [PubMed] [Google Scholar]
- 42.Curtis JR, Patkar N, Xie A, Martin C, Allison JJ, Saag M, Shatin D, Saag KG. Risk of serious bacterial infections among rheumatoid arthritis patients exposed to tumor necrosis factor α antagonists. Arthritis Rheum. 2007;56:1125–1133. doi: 10.1002/art.22504. [DOI] [PubMed] [Google Scholar]
- 43.Rennard SI, Fogarty C, Kelsen S, Long W, Ramsdell J, Allison J, Mahler D, Saadeh C, Siler T, Snell P, et al. The safety and efficacy of infliximab in moderate to severe chronic obstructive pulmonary disease. Am. J. Respir. Crit. Care Med. 2007;175:926–934. doi: 10.1164/rccm.200607-995OC. [DOI] [PubMed] [Google Scholar]
- 44.Zink A, Listing J. Risk of serious bacterial infection: treatment with anti-TNF versus methotrexate. Nat. Clin. Pract. Rheumatol. 2007;3:546–547. doi: 10.1038/ncprheum0594. [DOI] [PubMed] [Google Scholar]
- 45.Rijneveld AW, Florquin S, Hartung T, Speelman P, van der Poll T. Anti-tumor necrosis factor antibody impairs the therapeutic effect of ceftriaxone in murine pneumococcal pneumonia. J. Infect. Dis. 2003;188:282–285. doi: 10.1086/376454. [DOI] [PubMed] [Google Scholar]
- 46.Deveci F, Muz MH, Ilhan N, Kirkil G, Turgut T, Akpolat N. Evaluation of the anti-inflammatory effect of infliximab in a mouse model of acute asthma. Respirology. 2008;13:488–497. doi: 10.1111/j.1440-1843.2008.01278.x. [DOI] [PubMed] [Google Scholar]
- 47.Kim J, McKinley L, Natarajan S, Bolgos GL, Siddiqui J, Copeland S, Remick DG. Anti-tumor necrosis factor-α antibody treatment reduces pulmonary inflammation and methacholine hyper-responsiveness in a murine asthma model induced by house dust. Clin. Exp. Allergy. 2006;36:122–132. doi: 10.1111/j.1365-2222.2005.02407.x. [DOI] [PubMed] [Google Scholar]
- 48.Gehring U, Bischof W, Fahlbusch B, Wichmann HE, Heinrich J. House dust endotoxin and allergic sensitization in children. Am. J. Respir. Crit. Care Med. 2002;166:939–944. doi: 10.1164/rccm.200203-256OC. [DOI] [PubMed] [Google Scholar]
- 49.von Mutius E, Braun-Fahrlander C, Schierl R, Riedler J, Ehlermann S, Maisch S, Waser M, Nowak D. Exposure to endotoxin or other bacterial components might protect against the development of atopy. Clin. Exp. Allergy. 2000;30:1230–1234. doi: 10.1046/j.1365-2222.2000.00959.x. [DOI] [PubMed] [Google Scholar]