

Abstract
Introduction
Data are sparse as to whether obesity influences the risk of death in critically ill patients with septic shock. We sought to examine the possible impact of obesity, as assessed by body mass index (BMI), on hospital mortality in septic shock patients.
Methods
We performed a nested cohort study within a retrospective database of patients with septic shock conducted in 28 medical centers in Canada, United States and Saudi Arabia between 1996 and 2008. Patients were classified according to the World Health Organization criteria for BMI. Multivariate logistic regression analysis was performed to evaluate the association between obesity and hospital mortality.
Results
Of the 8,670 patients with septic shock, 2,882 (33.2%) had height and weight data recorded at ICU admission and constituted the study group. Obese patients were more likely to have skin and soft tissue infections and less likely to have pneumonia with predominantly Gram-positive microorganisms. Crystalloid and colloid resuscitation fluids in the first six hours were given at significantly lower volumes per kg in the obese and very obese patients compared to underweight and normal weight patients (for crystalloids: 55.0 ± 40.1 ml/kg for underweight, 43.2 ± 33.4 for normal BMI, 37.1 ± 30.8 for obese and 27.7 ± 22.0 for very obese). Antimicrobial doses per kg were also different among BMI groups. Crude analysis showed that obese and very obese patients had lower hospital mortality compared to normal weight patients (odds ratio (OR) 0.80, 95% confidence interval (CI) 0.66 to 0.97 for obese and OR 0.61, 95% CI 0.44 to 0.85 for very obese patients). After adjusting for baseline characteristics and sepsis interventions, the association became non-significant (OR 0.80, 95% CI 0.62 to 1.02 for obese and OR 0.69, 95% CI 0.45 to 1.04 for very obese).
Conclusions
The obesity paradox (lower mortality in the obese) documented in other populations is also observed in septic shock. This may be related in part to differences in patient characteristics. However, the true paradox may lie in the variations in the sepsis interventions, such as the administration of resuscitation fluids and antimicrobial therapy. Considering the obesity epidemic and its impact on critical care, further studies are warranted to examine whether a weight-based approach to common therapeutic interventions in septic shock influences outcome.
Introduction
Obesity is a fast growing epidemic worldwide and is closely associated with morbid conditions including diabetes, cardiovascular and respiratory diseases as well as cancer [1]. Approximately 65% of the United States population is overweight and 30% are obese. Obesity is increasingly a major health hazard in many developed and developing nations as well [2-4]. As a result, the proportion of obese patients admitted to hospitals is steadily increasing with an estimated cost that exceeds 5% of the national health expenditure in the US [2,3]. Therefore, obesity became the target for national-level endeavors as evidenced by the most recent release of the Institute of Medicine recommendations to 'Solve the Weight of the Nation' [5].
The prevalence of obese patients admitted to ICUs is also rising rapidly and poses complex challenges [6,7]. However, intriguingly, despite the increased morbidity and the difficulty of administering standard care, data on outcome, although conflicting, are showing predominantly either equal or lower mortality in obese than in normal weight critically ill patients, while only a few reported higher mortality [8,9]. A comparable phenomenon was also observed in obese patients with heart failure and is referred to as the 'obesity paradox' [10]. Although an explanation of this paradox is not immediately clear, most of the studies have included either a heterogeneous population of obese critically ill patients or have failed to adjust for major confounding factors, such as sepsis interventions [11,12]. The influence of obesity on specific ICU populations, such as patients with sepsis, has been the subject of much speculation but very few clinical data exist on this topic.
Sepsis is a major cause of morbidity and mortality worldwide and a leading admission diagnosis to ICUs [13] with substantial cost and considerable long-term health-related consequences [14-16]. Data on the impact of obesity on septic shock are primarily based on experimental and small clinical studies [17,18].
Therefore, we sought to examine the association of obesity, assessed by body mass index (BMI), and hospital mortality in patients admitted with septic shock. We further assessed the differences in clinical and microbiologic features as well as septic shock-related interventions in association with obesity.
Materials and methods
Subjects and setting
This was a retrospective cohort study from a large database of patients admitted with septic shock to the ICUs in 28 medical centers in Canada, United States, and Saudi Arabia by the Cooperative Antimicrobial Therapy of Septic Shock (CATSS) Database Research Group between 1996 and 2008. The study protocol was approved by the Instititutional Review Board of the University of Manitoba, Winnipeg, Canada; the University of Toronto, Toronto, Canada; McGill University, Montreal, Canada; the University of British Columbia, Vancouver, Canada; Rush University, Chicago, IL, USA; Brandon Hospital, Brandon, Canada; St. Agnes Hospital, Baltimore, MD, USA; Harper Hospital, Detroit, MI, USA; Northern Medical School, Laurentian University, Sudbury, Canada; the University of Calgary, Calgary, Canada; the University of Wisconsin, Madison, WI, USA; Cooper Hospital/University Medical Center, Camden, NJ, USA; Vancouver Island Regional Health Authority, Victoria, Canada; Hospital Maissoneuve-Rosemont, Montreal, Canada; and King Saud Bin Abdulaziz University for Health Sciences, Riyadh, Saudi Arabia. Informed consent was waived.
The original study included adult patients with septic shock defined according to the 1992 American College of Chest Physicians/Society of Critical Care Medicine guidelines [19]. The details regarding the full definitions used in the study have already been described [20,21]. Patients with weight and height documented in the medical records on admission were included in this study.
Definition of obesity
Obesity was defined using the World Health Organization (WHO) criteria according to BMI (calculated as weight in kilograms divided by the square of the height in meters (kg/m2)) [22]. Patients were classified as underweight (BMI < 18.50 kg/m2), normal weight (BMI = 18.50 to 24.99 kg/m2), overweight (BMI = 25.0 to 29.99 kg/m2), obese (BMI = 30.0 to 39.99 kg/m2) or very obese (BMI > 40 kg/m2).
Clinical characteristics and sepsis interventions
At baseline the following data were collected: age, gender, use of mechanical ventilation, Acute Physiology and Chronic Health Evaluation (APACHE) II score [23], admission physiologic data and comorbid conditions (immunosuppressive disorders, liver failure, heart failure, chronic obstructive pulmonary disease (COPD), chronic renal failure and medication- and insulin-dependent diabetes, alcohol abuse, elective and emergency surgery), laboratory data, organ failure indicators on admission [see Additional file 1, Appendix A], source of infection (community versus nosocomial infection), the presence of bacteremia, site of infection and microbiological data. We calculated creatinine clearance using the modification of diet in renal disease (MDRD) [24] and Cockcroft-Gault equations [25] [see Additional file 1, Appendix B]; the former was used in the multivariate analysis as it has been shown to perform better than Cockcroft-Gault equation in patients with extreme weights [26]. We calculated ideal and adjusted body weights and dosing weights for antimicrobials as recommended [6,27] [see Additional file 1, Appendix B].
We documented the following data regarding sepsis interventions: the volume of crystalloids, colloids, and blood products administered during the first six hours of septic shock (in ml and in ml/kg of actual body weight). We also recorded the selection and doses of vasopressors, use of activated protein C and low-dose steroids. The following data were collected about antimicrobial therapy: appropriateness, delay in hours from the onset of hypotension and the use of single versus combination antimicrobial therapy. Detailed definitions of these variables have already been described [20,21,28]. We also documented the type and dose (total and dose per kg of dosing body weight) of antimicrobials administered on the first day.
Outcomes
Hospital mortality was the primary outcome. Secondary outcomes were ICU mortality and ICU and hospital length of stay (LOS).
Statistical analysis
Continuous variables are reported as means with standard deviations (SD) and categorical variables as absolute and relative frequencies. Analysis of variance (ANOVA) and chi-square tests for comparison among groups were used as appropriate.
To study the association between obesity and hospital mortality, we carried out multivariate logistic regression analyses with the normal weight group as reference. We assessed the association of different BMI groups and mortality in crude and multivariate models adjusting for covariates that were selected based on clinical relevance or statistical criteria (P value of 0.25 for inclusion and P value of 0.05 for retaining in the model). We first adjusted to baseline characteristics (model 1) including age, gender, mechanical ventilation, APACHE II score, chronic co-morbidities (immunosuppressive disorders, heart failure, COPD, and medication- and insulin-dependent diabetes, elective surgery), nosocomial versus community acquired infection, bacteremia, Gram-negative organisms, fungal organisms, anaerobes (with Gram-positive organisms used as reference), pneumonia, urinary tract infection, primary bloodstream infection, catheter-related bloodstream infection, skin and soft tissue infection, creatinine clearance as calculated by MDRD and country. To adjust for the impact of potential changes in practice over time, we divided the study time period into four quartiles and we included the study period in the multivariate model. In the second model (model 2) we added the following variables related to sepsis interventions: inappropriate antimicrobial therapy, single versus combination antimicrobial therapy, delayed antimicrobial therapy > 3 hours, vasopressor doses (dopamine, norepinephrine, phenylephrine, epinephrine, and dobutamine), the use of a pulmonary artery catheter, activated protein C and the use of low-dose steroids. Among the variables included in the multivariate models, 3% of patients had missing values for APACHE II score and 3.5% of patients had missing data for MDRD, which were replaced by the means. Results were reported as odds ratios (ORs) with 95%CIs.
To study the association between BMI and the amount of fluid and antimicrobial dosage, we carried out multivariate linear regression analyses. We reported P values for the crude analysis and adjusted analysis for creatinine clearance. For the association of fluids and BMI, we also adjusted for pulmonary capillary wedge pressure in patients with a pulmonary artery catheter. A P value of < 0.05 was considered significant. SAS (SAS Institute, Cary, NC, USA) software was used for statistical analyses.
Results
Baseline characteristics
Of the 8,670 patients included during the study period, 2,882 (33.2%) had height and weight documented. When compared to excluded patients who did not have documented values of both weight and height in the medical records, there were no differences in age (P = 0.07), APACHE II score (P = 0.10) and use of mechanical ventilation (P = 0.29). However, excluded patients were more likely to have comorbid conditions (P = 0.007) and had lower hospital mortality compared to the included patients (P = 0.03).
Overall, 35.3% of the study population was in the normal weight group, 6.8% were underweight, 28.3% overweight, 23.6% obese and 5.4% very obese. Table 1 shows their baseline characteristics. Compared with the reference group (normal weight), very obese and underweight patients were younger. Obese and very obese patients were less likely to have immunosuppressive disorders and more likely to have heart failure and diabetes mellitus compared to those with normal BMI. With increasing BMI, admission heart rate, temperature and mean arterial pressure were higher and respiratory rate was lower. Creatinine was higher and platelet count lower with increasing BMI with the corresponding organ failure indicators following the same pattern (Table 1).
Table 1.
Baseline characteristics among different groups of BMI
| Variables | < 18.50 Number = 196 |
18.50 to 24.99 Number = 1,020 |
25.0 to 29.99 Number = 816 |
30.0 to -39.99 Number = 680 |
≥ 40 Number = 170 |
P value |
|---|---|---|---|---|---|---|
| Age (years), mean (SD) | 59.1 (19.2) | 62.2 (16.8) | 63.5 (15.9) | 62.2 (14.6) | 58.4 (13.0) | < 0.001 |
| Gender, female, number (%) | 82 (41.8) | 390 (38.2) | 316 (38.7) | 334 (49.1) | 102 (60.0) | < 0.001 |
| Actual body weight (kg), mean (SD) | 47.3 (7.1) | 63.4 (10.2) | 77.3 (10.1) | 93.4 (14.7) | 128.9 (28.1) | < 0.001 |
| Ideal body weight (kg), mean (SD) | 61.7 (10.9) | 62.9 (11.5) | 62.4 (10.7) | 60.4 (12.0) | 58.3 (13.4) | < 0.001 |
| Dosing body weight (kg), mean (SD) | 58.1 (9.7) | 63.0 (10.9) | 66.1 (10.4) | 68.6 (12.3) | 75.9 (15.8) | < 0.001 |
| Height (cms), mean (SD) | 167.3 (10.6) | 168.8 (11.1) | 167.9 (10.1) | 166.3 (11.5) | 164.5 (13.3) | < 0.001 |
| BMI (kg/m2), mean (SD) | 16.8 (1.3) | 22.2 (1.8) | 27.3 (1.4) | 33.6 (2.7) | 47.4 (7.4) | < 0.001 |
| Mechanical ventilation, number (%) | 146 (74.5) | 777 (76.2) | 605 (74.1) | 491 (72.2) | 128 (75.3) | 0.48 |
| APACHE II, mean (SD) | 25.5 (8.0) | 25.7 (8.1) | 25.6 (8.4) | 25.4 (7.9) | 24.4(7.3) | 0.43 |
| Admission physiologic data, mean (SD) | ||||||
| Heart rate (beats/minute) | 120.9 (30.3) | 119.2 (29.4) | 116.7 (29.9) | 119.1 (29.5) | 112.2 (31.0) | 0.02 |
| Respiratory rate (beats/minute) | 29.0 (8.8) | 27.0 (10.2) | 26.6 (10.4) | 26.0 (10.0) | 25.8 (9.1) | 0.005 |
| Temperature (°C) | 37.2 (1.8) | 37.5 (1.7) | 37.7 (1.7) | 37.8 (1.6) | 37.8 (1.7) | < 0.001 |
| Mean arterial pressure (mmHg) | 53.3 (13.3) | 56.6 (16.5) | 58.0 (19.0) | 60.3 (20.1) | 62.6 (22.2) | < 0.001 |
| Co-morbidities, number (%) | ||||||
| Immunosuppressive disorder | 56 (28.6) | 300 (29.4) | 213 (26.1) | 188 (27.7) | 32 (18.8) | 0.06 |
| Liver failure | 14 (7.1) | 91 (8.9) | 67 (8.2) | 53 (7.8) | 19 (11.2) | 0.59 |
| New York Heart Association class IV heart failure | 16 (8.2) | 70 (6.9) | 95 (11.6) | 77 (11.3) | 21 (12.4) | 0.002 |
| Severe COPD (requiring medication or oxygen) | 22 (11.2) | 102 (10.0) | 88 (10.8) | 83 (12.2) | 32 (18.8) | 0.02 |
| Chronic renal failurea | 35 (17.9) | 155 (15.2) | 126 (15.4) | 100 (14.7) | 34 (20.0) | 0.43 |
| Chronic renal failure-dialysis dependence | 17 (8.7) | 81 (7.9) | 45 (5.5) | 41 (6.0) | 12 (7.1) | 0.20 |
| Diabetes mellitus (medication dependent) | 10 (5.1) | 127 (12.5) | 141 (17.3) | 159 (23.4) | 45 (26.5) | < 0.001 |
| Diabetes mellitus (insulin-dependent) | 11 (5.6) | 76 (7.5) | 82 (10.1) | 80 (11.8) | 35 (20.6) | < 0.001 |
| Alcohol abuse | 29 (14.8) | 162 (15.9) | 107 (13.1) | 76 (11.2) | 15 (8.8) | 0.02 |
| Elective surgery | 28 (14.3) | 160 (15.7) | 159 (19.5) | 130 (19.1) | 25 (14.7) | 0.09 |
| Emergency surgery/trauma | 17 (8.7) | 97 (9.5) | 73 (9.0) | 49 (7.2) | 8 (4.7) | 0.19 |
| No co-morbidity | 58 (29.6) | 285 (27.9) | 227 (27.8) | 170 (25.0) | 38 (22.4) | 0.33 |
| Any co-morbidity | 138 (70.4) | 735 (72.1) | 589 (72.2) | 510 (75.0) | 132 (77.6) | |
| Laboratory findings on day-1, mean (SD) | ||||||
| White blood count (×109/L) | 16.1 (16.4) | 16.1 (15.3) | 16.5 (16.9) | 17.9 (16.1) | 16.0 (10.6) | 0.20 |
| Creatinine (μmol/L) | 164.3 (148.2) | 195.3 (160.6) | 207.7 (167.9) | 221.7 (165.2) | 242.3 (201.8) | < 0.001 |
| Bicarbonate (mmol/L) | 19.4 (6.7) | 19.1 (6.4) | 18.8 (6.4) | 19.0 (6.7) | 20.1 (6.1) | 0.32 |
| Bilirubin (μmol/L) | 33.2 (54.4) | 41.5 (76.3) | 44.1 (92.5) | 41.5 (68.1) | 31.1 (76.0) | 0.29 |
| Platelets (×109/L) | 206.9 (140.5) | 198.4 (156.6) | 185.6 (133.3) | 210.3 (140.6) | 223.5 (132.2) | 0.004 |
| International normalized ratio | 1.8 (1.2) | 1.7 (1.1) | 1.8 (1.1) | 1.8 (1.4) | 1.7 (1.3) | 0.78 |
| Creatinine clearance (mL/minute), mean (SD) | ||||||
| MDRDb equation | 85.9 (148.2) | 56.5 (49.3) | 48.1 (40.6) | 43.1 (36.0) | 37.1 (27.6) | < 0.001 |
| Cockcroft-Gault equation | 69.6 (98.6) | 49.8 (41.3) | 42.3 (34.3) | 37.9 (29.9) | 33.6 (22.7) | < 0.001 |
| Source of infection, number (%) | ||||||
| Community acquired infection | 102 (52.0) | 555 (54.4) | 410 (50.3) | 350 (51.5) | 105 (61.8) | 0.06 |
| Nosocomial infection | 94 (48.0) | 465 (45.6) | 406 (49.8) | 330 (48.5) | 65 (38.2) | |
| Bacteremia, Number (%) | 68 (34.7) | 361 (35.4) | 289 (35.4) | 266 (39.1) | 48 (28.2) | 0.10 |
| Organ failures on day-1, number (%) | ||||||
| Cardiovascular | 196 (100) | 1020 (100) | 816 (100) | 680 (100) | 170 (100) | * |
| Renal | 80 (40.8) | 550 (53.9) | 501 (61.4) | 447 (65.7) | 112 (65.9) | < 0.001 |
| Respiratory | 146 (74.5) | 777 (76.2) | 605 (74.1) | 491 (72.2) | 128 (75.3) | 0.48 |
| Hematologic | 56 (28.6) | 261 (25.6) | 241 (29.5) | 163 (24.0) | 29 (17.1) | 0.006 |
| Metabolic | 110 (56.1) | 551 (54.0) | 441 (54.0) | 367 (54.0) | 91 (53.5) | 1.00 |
| Central nervous system | 47 (24.0) | 289 (28.3) | 210 (25.7) | 168 (24.7) | 45 (26.5) | 0.44 |
| Hepatic | 32 (16.3) | 195 (19.1) | 157 (19.2) | 144 (21.2) | 31 (18.2) | 0.60 |
| Coagulation | 89 (45.4) | 454 (44.5) | 350 (42.9) | 284 (41.8) | 69 (40.6) | 0.70 |
| Country, number (%) | ||||||
| Canada | 147 (75.0) | 813 (79.7) | 655 (80.3) | 548 (80.6) | 130 (76.5) | 0.15 |
| USA | 28 (14.3) | 101 (9.9) | 90 (11.0) | 75 (11.0) | 28 (16.5) | |
| Saudi Arabia | 21 (10.7) | 106 (10.4) | 71 (8.7) | 57 (8.4) | 12 (7.1) | |
| Period, number (%) | ||||||
| ≤ 1997 | 57 (29.1) | 301 (29.5) | 218 (26.7) | 191 (28.1) | 32 (18.8) | 0.18 |
| 1998 to 2000 | 72 (36.7) | 378 (37.1) | 292 (35.8) | 235 (34.6) | 67 (39.4) | |
| 2001 to 2002 | 57 (29.1) | 296 (29.0) | 265 (32.5) | 207 (30.4) | 62 (36.5) | |
| ≥ 2003 | 10 (5.1) | 45 (4.4) | 41 (5.0) | 47 (6.9) | 9 (5.3) |
APACHE II, Acute Physiology and Chronic Health Evaluation II; BMI, body mass index;aSerum creatinine > 1.5 upper limit of normal,
aSerum creatinine > 1.5 upper limit of normal = Chronic renal failure
bMDRD: Modification of diet in renal disease
Microbiologic data and sites of infections
Obese and very obese patients were more likely to have Gram-positive infections. Very obese patients were more likely to have sepsis from skin and soft tissue infections and less from pneumonia (Table 2). Table 3 shows the sepsis interventions and Table 4 shows the fluid and antibiotic dosage among the five groups of BMI.
Table 2.
Microbiologic and sites of infection among different groups of BMI
| Number (%) | < 18.50 Number = 196 |
18.50 to 24.99 Number = 1,020 |
25.0 to29.99 Number = 816 |
30.0 to 39.99 Number = 680 |
≥ 40 Number = 170 |
P value |
|---|---|---|---|---|---|---|
| Total culture negative | 49 (25.0) | 270 (26.5) | 242 (29.7) | 204 (30.0) | 53 (31.2) | 0.28 |
| Total culture positive | 147 (75.0) | 750 (73.5) | 574 (70.3) | 476 (70.0) | 117 (68.8) | |
| Gram-negative organisms | 72 (36.7) | 384 (37.7) | 281 (34.4) | 230 (33.8) | 45 (26.5) | 0.05 |
| Escherichia coli | 23 (11.7) | 163 (16.0) | 115 (14.1) | 97 (14.3) | 19 (1.2) | 0.32 |
| Klebsiella | 16 (8.2) | 62 (6.1) | 41 (5.0) | 36 (5.3) | 7 (4.1) | 0.38 |
| Pseudomonas aeruginosa | 13 (6.6) | 68 (6.7) | 48 (5.9) | 28 (4.1) | 8 (4.7) | 0.23 |
| Enterobacter species | 5 (2.6) | 27 (2.7) | 21 (2.6) | 25 (3.7) | 1 (0.6) | 0.25 |
| Haemophilus influenzae | 6 (3.1) | 12 (1.2) | 10 (1.2) | 8 (1.2) | 3 (1.8) | 0.29 |
| Acinetobacter species | 4 (2.0) | 10 (1.0) | 6 (0.8) | 11 (1.6) | 2 (1.2) | 0.38 |
| Other Gram-negative bacilli | 5 (2.6) | 42 (4.1) | 40 (4.9) | 25 (3.7) | 5 (2.9) | 0.49 |
| Gram-positive organisms | 41 (20.9) | 247 (24.2) | 183 (22.4) | 168 (24.7) | 60 (35.3) | 0.007 |
| Staphylococcus aureus | 19 (9.7) | 110 (10.8) | 81 (9.9) | 71 (10.4) | 22 (12.9) | 0.81 |
| Streptococcus pneumonia | 9 (4.6) | 60 (5.9) | 37 (4.5) | 37 (5.4) | 8 (4.7) | 0.74 |
| Streptococci faecalis | 4 (2.0) | 19 (1.9) | 17 (2.1) | 17 (2.5) | 6 (3.5) | 0.68 |
| Streptococcus faecium | 2 (1.0) | 11 (1.1) | 8 (1.0) | 4 (0.6) | 3 (1.8) | 0.69 |
| Group A streptococcus species | 2 (1.0) | 18 (1.8) | 17 (2.1) | 14 (2.1) | 10 (5.9) | 0.01 |
| Other β-hemolytic streptococci | 3 (1.5) | 12 (1.2) | 10 (1.2) | 13 (1.9) | 8 (4.7) | 0.01 |
| Other Gram-positive bacilli | 2 (1.0) | 17 (1.7) | 13 (1.6) | 12 (1.8) | 3 (1.8) | 0.97 |
| Fungi/Yeast | 20 (10.2) | 77 (7.6) | 84 (10.3) | 62 (9.1) | 8 (4.7) | 0.08 |
| Candida albicans | 11 (5.6) | 44 (4.3) | 50 (6.1) | 37 (5.4) | 7 (4.1) | 0.46 |
| Other candida/yeast | 9 (4.6) | 33 (3.2) | 34 (4.2) | 25 (3.7) | 1 (0.6) | 0.18 |
| Anaerobes | 10 (5.1) | 26 (2.6) | 17 (2.1) | 14 (2.1) | 4 (2.4) | 0.15 |
| Other organisms | 4 (2.0) | 16 (1.6) | 9 (1.1) | 2 (0.3) | 0 | 0.04 |
| Site of infection | ||||||
| Lung | 95 (48.5) | 445 (43.6) | 301 (36.9) | 226 (33.2) | 53 (31.2) | < 0.001 |
| Pneumonia | 91 (46.4) | 435 (42.7) | 296 (36.3) | 223 (32.8) | 51 (30.0) | 0.45 |
| Empyema | 4 (2.0) | 10 (1.0) | 5 (0.6) | 3 (0.4) | 2 (1.2) | 0.22 |
| Intraabdominal | 53 (27.0) | 299 (29.3) | 268 (32.8) | 228 (33.5) | 53 (31.2) | 0.20 |
| Intraabdominal abscess | 5 (2.6) | 23 (2.3) | 23 (2.8) | 28 (4.1) | 8 (4.7) | 0.15 |
| Ascending Cholangitis | 2 (1.0) | 23 (2.3) | 14 (1.7) | 13 (1.9) | 0 | 0.28 |
| Cholecystitis | 1 (0.5) | 9 (0.9) | 14 (1.7) | 12 (1.8) | 1 (0.6) | 0.26 |
| Ischemic bowel/bowel infarction | 7 (3.6) | 48 (4.7) | 51 (6.3) | 35 (5.2) | 5 (2.9) | 0.27 |
| Viscous bowel perforation | 21 (10.7) | 104 (10.2) | 104 (12.8) | 66 (9.7) | 20 (11.8) | 0.34 |
| Spontaneous bacterial peritonitis | 3 (1.5) | 31 (3.0) | 14 (1.7) | 17 (2.5) | 1 (0.6) | 0.16 |
| Clostridium difficile enterocolitis/toxic megacolon | 7 (3.6) | 25 (2.5) | 18 (2.2) | 12 (1.8) | 2 (1.2) | 0.49 |
| Infected pancreatic necrosis | 0 | 4 (0.4) | 11 (1.4) | 16 (2.4) | 3 (1.8) | 0.002 |
| Others | 7 (3.6) | 32 (3.1) | 19 (2.3) | 29 (4.3) | 13 (7.7) | 0.009 |
| Skin and soft tissue | 14 (7.1) | 69 (6.8) | 72 (8.8) | 79 (11.6) | 37 (21.8) | < 0.001 |
| Cellulitis | 2 (1.0) | 7 (0.7) | 11 (1.4) | 19 (2.8) | 12 (7.1) | < 0.001 |
| Necrotizing soft tissue infections | 5 (2.6) | 20 (2.0) | 16 (2.0) | 23 (3.4) | 12 (7.1) | 0.001 |
| Others | 7 (3.6) | 42 (4.1) | 45 (5.5) | 37 (5.4) | 13 (7.7) | 0.22 |
| Genitourinary | 17 (8.7) | 92 (9.0) | 80 (9.8) | 70 (10.3) | 18 (10.6) | 0.88 |
| Intravascular catheter infection | 8 (4.1) | 38 (3.7) | 29 (3.6) | 36 (5.3) | 6 (3.5) | 0.46 |
| Primary bloodstream infection (bacteremia without identifiable source) | 8 (4.1) | 49 (4.8) | 44 (5.4) | 37 (5.4) | 7 (4.1) | 0.87 |
| Systemically disseminated infection (including yeast and tuberculosis) | 6 (3.1) | 29 (2.8) | 26 (3.2) | 18 (2.7) | 5 (2.9) | 0.98 |
| Septic arthritis | 0 | 5 (0.5) | 7 (0.9) | 7 (1.0) | 6 (3.5) | 0.002 |
BMI, body mass index.
Table 3.
Sepsis interventions related to septic shock among the five groups of BMI
| Variable | < 18.50 Number = 196 |
18.50 to 24.99 Umber = 1,020 |
25.0 to 29.99 Number = 816 |
30.0 to 39.99 Number = 680 |
≥ 40 Number = 170 |
P value |
|---|---|---|---|---|---|---|
| Vasopressors used, Number (%) | ||||||
| Dopamine | 117 (59.7) | 594 (58.2) | 465 (57.0) | 408 (60.0) | 91 (53.5) | 0.54 |
| Norepinephrine | 122 (62.2) | 566 (55.5) | 480 (58.8) | 362 (53.2) | 86 (50.6) | 0.04 |
| Phenylephrine | 58 (29.6) | 336 (32.9) | 255 (31.3) | 219 (32.2) | 48 (28.2) | 0.70 |
| Epinephrine | 12 (6.1) | 45 (4.4) | 41 (5.0) | 31 (4.6) | 15 (8.8) | 0.15 |
| Dobutamine | 16 (8.2) | 98 (9.6) | 84 (10.3) | 75 (11.0) | 18 (10.6) | 0.77 |
| Vasopressor dose - at six hours, mean (SD) | ||||||
| Dopamine (μcg/kg/minute) | 7.7 (7.3) | 6.7 (4.9) | 6.5 (4.7) | 6.4 (4.3) | 6.2 (5.1) | 0.22 |
| Norepinephrine (μcg/kg/minute) | 0.39 (0.41) | 0.37 (0.60) | 0.33 (0.43) | 0.30 (0.47) | 0.18 (0.18) | 0.05 |
| Phenylephrine (μcg/kg/minute) | 3.4 (4.1) | 2.2 (2.1) | 2.1 (2.3) | 2.0 (2.4) | 1.2 (1.4) | 0.003 |
| Epinephrine (μcg/kg/minute) | 0.85 (0.61) | 0.30 (0.26) | 0.33 (0.73) | 0.18 (0.12) | 0.21 (0.18) | 0.04 |
| Dobutamine (μcg/kg/minute) | 5.1 (1.7) | 4.4 (2.5) | 4.7 (2.9) | 4.0 (2.8) | 4.4 (2.5) | 0.82 |
| Sepsis specific therapy | ||||||
| Activated protein C, number (%) | 9 (4.6) | 36 (3.5) | 29 (3.6) | 42 (6.2) | 13 (7.7) | 0.01 |
| Low-dose steroids, number (%) | 73 (37.2) | 305 (29.9) | 256 (31.4) | 222 (32.7) | 46 (27.1) | 0.19 |
| Inappropriate antimicrobials therapy, number (%) | 46 (23.5) | 188 (18.4) | 160 (19.6) | 120 (17.7) | 31 (18.2) | 0.43 |
| Single versus combined antimicrobial therapy, number (%) | 142 (72.5) | 711 (69.7) | 568 (69.6) | 456 (67.1) | 118 (69.4) | 0.62 |
| Delay in antimicrobial therapy, mean (SD) | 17.8 (30.3) | 13.9 (24.0) | 15.1 (26.0) | 12.6 (18.8) | 16.7 (29.9) | 0.12 |
| Others | ||||||
| Pulmonary artery catheter, number (%) | 91 (46.4) | 513 (50.3) | 428 (52.5) | 386 (56.8) | 89 (52.4) | 0.04 |
| Pulmonary capillary wedge pressure, (mmHG), mean (SD) | 15.0 (5.2) | 16.5 (6.1) | 17.6 (6.1) | 18.6 (6.4) | 20.5 (6.7) | < 0.001 |
| Cardiac output (L/minute), mean (SD) | 6.4 (2.8) | 7.1 (3.2) | 7.6 (3.2) | 7.7 (3.4) | 8.7 (3.5) | < 0.001 |
| Cardiac index(L/minute/m2), mean (SD) | 4.1 (1.7) | 4.1 (1.7) | 4.0 (1.6) | 3.8 (1.5) | 3.9 (1.5) | 0.11 |
BMI, body mass index.
Table 4.
Fluid and antibiotic dosage among different groups of BMI
|
Intervention
a
mean (SD) |
< 18.50 Number = 196 |
18.50 to 4.99 Number = 1,020 |
25.0 to 29.99 Number = 816 |
30.0 to 39.99 Number = 680 |
≥ 40 Number = 170 |
P value | Adjusted P value b | Adjusted P value c |
|
|---|---|---|---|---|---|---|---|---|---|
| Crystalloid | Number = 1,506 (52.3%) | Number = 96 (49.0) | Number = 537 (52.6) | Number = 439 (53.8) | Number = 346 (50.9) | Number = 88 (51.8) | |||
| Total (ml) | 2,580.3 (1,874.9) | 2,690.0 (2,050.2) | 2,861.7 (2,445.1) | 2,537.4 (2,032.0) | 2,602.3 (1,919.1) | 0.30 | 0.76 | 0.59 | |
| Dose per kg of actual body weight (ml/kg) | 55.0 (40.1) | 43.2 (33.4) | 37.1 (30.8) | 27.7 (22.0) | 21.4 (16.8) | < 0.001 | < 0.001 | < 0.001 | |
| Colloid | Number = 1,506 (52.3%) | Number = 96 (49.0) | Number = 537 (52.6) | Number = 439 (53.8) | Number = 346 (50.9) | Number = 88 (51.8) | |||
| Total (ml) | 656.8 (864.8) | 509.8 (781.0) | 593.5 (788.7) | 705.5 (2,824.5) | 538.9 (939.8) | 0.44 | 0.79 | 0.31 | |
| Dose per kg of actual body weight (ml/kg) | 14.3 (19.3) | 8.2 (12.7) | 7.7 (10.2) | 8.5 (44.2) | 4.3 (7.2) | 0.06 | 0.02 | < 0.001 | |
| Packed red blood cell | Number = 94 (3.3%) | Number = 5 (2.6) | Number = 29 (2.8) | Number = 31(3.8) | Number = 24 (3.5) | Number = 5 (2.9) | |||
| Total (ml) | 462.0 (180.7) | 601.0 (630.3) | 522.5 (243.2) | 502.0 (250.0) | 961.2 (781.5) | 0.26 | 0.68 | 0.79 | |
| Dose per kg of actual body weight (ml/kg) | 9.6 (4.1) | 9.7 (10.8) | 6.8 (3.1) | 5.4 (3.0) | 7.3 (5.5) | 0.18 | 0.02 | 0.53 | |
| Fresh frozen plasma | Number 70 (2.4%) | Number = 4 (2.0) | Number = 22 (2.2) | Number = 21(2.6) | Number = 18 (2.6) | Number = 5 (2.9) | |||
| Total (ml) | 737.5 (715.7) | 498.7 (224.4) | 600.0 (336.9) | 526.8 (333.1) | 1,260.0 (1,34.9) | 0.01 | 0.005 | 0.02 | |
| Dose per kg of actual body weight (ml/kg) | 18.9 (20.8) | 8.2 (4.4) | 7.8 (4.7) | 5.8 (3.7) | 10.4 (8.4) | 0.01 | 0.77 | 0.62 | |
| Piperacillin/tazo-bactam | Number = 564 (19.6%) | Number = 46 (23.5) | Number = 214 (21.0) | Number = 145 (17.8) | Number = 129 (19.0) | Number = 30 (17.6) | |||
| Total dose (mg) | 10,214.7 (3,216.3) | 10,714.8 (3,155.2) | 11,005.3 (3,074.6) | 10,754.8 (3,264.7) | 10,766.7 (2,699.9) | 0.68 | 0.06 | ||
| Dose per kg of dosing body weight | 183.5 (66.7) | 174.8 (59.9) | 168.3 (56.1) | 161.0 (59.9) | 133.2 (40.2) | 0.001 | < 0.001 | ||
| Cefotaxime | Number = 772 (26.8%) | Number = 51 (26.0) | Number = 297 (29.1) | Number = 212 (26.0) | Number = 173 (25.4) | Number = 39 (22.9) | |||
| Total dose (mg) | 3,549.0 (1,932.0) | 3,477.8 (1,821.8) | 3,787.7 (1,857.4) | 3,359.8 (1,531.0) | 4,256.4 (2,220.9) | 0.02 | 0.006 | ||
| Dose per kg of dosing body weight | 62.1 (38.5) | 56.5 (31.6) | 57.2 (28.7) | 49.7 (24.4) | 53.5 (30.2) | 0.04 | 0.32 | ||
| Imipenem | Number = 242 (8.4%) | Number = 15 (7.7) | Number = 79 (7.7) | Number = 75 (9.2) | Number = 56 (8.2) | Number = 17 (10.0) | |||
| Total dose (mg) | 1,566.7 (457.7) | 1,665.2 (597.5) | 1,693.3 (700.6) | 1,705.4 (796.5) | 1,426.5 (584.7) | 0.60 | 0.36 | ||
| Dose per kg of dosing body weight | 25.9 (9.0) | 27.0 (9.9) | 24.9 (10.3) | 24.2 (13.1) | 7.3 (54.6) | 0.002 | < 0.001 | ||
| Gentamycin | Number = 511 (17.7%) | Number = 33 (16.8) | Number = 184 (18.0) | Number = 149 (18.3) | Number = 122 (17.9) | Number = 23 (13.5) | |||
| Total dose (mg) | 173.3 (82.4) | 219.9 (241.4) | 256.7 (229.4) | 239.4 (118.3) | 262.0 (121.9) | 0.18 | 0.01 | ||
| Dose per kg of dosing body weight | 3.2 (1.5) | 3.6 (4.0) | 3.8 (3.2) | 3.3 (1.7) | 3.2 (1.6) | 0.63 | 0.96 | ||
| Meropenem | Number = 277 (9.6%) | Number = 19 (9.7) | Number = 83 (8.1) | Number = 85 (10.4) | Number = 70 (10.3) | Number = 20 (11.8) | |||
| Total dose (mg) | 2,342.1 (1,179.1) | 1,807.2 (791.8) | 1,865.9 (990.6) | 1,678.6 (920.9) | 2,050.0 (916.2) | 0.07 | 0.75 | ||
| Dose per kg of dosing body weight | 40.7 (19.4) | 29.8 (15.0) | 28.8 (15.7) | 25.0 (15.5) | 26.1 (11.3) | 0.003 | 0.01 | ||
| Levofloxacin | Number = 301 (10.4%) | Number = 28 (14.3) | Number = 110 (10.8) | Number = 81 (9.9) | Number = 62 (9.1) | Number = 20 (11.8) | |||
| Total dose (mg) | 426.8 (118.2) | 489.8 (164.3) | 488.0 (205.8) | 441.5 (251.8) | 462.5 (91.6) | 0.32 | 0.82 | ||
| Dose per kg of dosing body weight | 8.0 (2.5) | 8.0 (3.1) | 7.1 (2.8) | 6.2 (4.4) | 5.3 (1.3) | < 0.001 | < 0.001 | ||
| Vancomycin | Number = 771 (26.8%) | Number = 53 (27.0) | Number = 261(25.6) | Number = 209 (25.6) | Number = 194 (28.5) | Number = 54 (32.1) | |||
| Total dose (mg) | 1,292.5 (521.6) | 1,421.2 (630.3) | 1,380.4 (578.4) | 1,353.1 (623.0) | 1,441.4 (680.6) | 0.54 | 0.20 | ||
| Dose per kg of dosing body weight | 28.5 (13.7) | 22.9 (11.2) | 17.9 (7.6) | 14.8 (7.2) | 11.3 (5.8) | < 0.001 | < 0.001 | ||
| Ciprofloxacin | Number = 634 (22.0%) | Number = 39 (19.9) | Number = 218 (21.4) | Number = 186 (22.8) | Number = 165 (24.3) | Number = 26 (15.3) | |||
| Total dose (mg) | 682.9 (280.3) | 674.4 (237.0) | 671.4 (255.8) | 670.3 (363.1) | 682.7 (210.2) | 1.0 | 0.13 | ||
| Dose per kg of dosing body weight | 13.0 (5.2) | 10.9 (4.4) | 10.1 (4.1) | 9.1 (5.0) | 7.6 (2.6) | < 0.001 | < 0.001 | ||
| Ampicillin | Number = 340 (11.8%) | Number = 19 (9.7) | Number = 122 (12.0) | Number = 115 (14.1) | Number = 70 (10.3) | Number = 14 (8.2) | |||
| Total dose (mg) | 4,106.6 (1,788.6) | 4,002.3 (1,940.8) | 4,326.1 (2,019.7) | 4,072.1 (1,64.0) | 5,071.4 (2,302.7) | 0.31 | 0.01 | ||
| Dose per kg of dosing body weight | 71.8 (38.4) | 64.8 (32.2) | 66.5 (33.0) | 61.3 (31.0) | 67.0 (36.3) | 0.74 | 0.85 | ||
| Amphotericin B | Number = 102 (3.5%) | Number = 5 (2.6) | Number = 34 (3.3) | Number = 36 (0.4) | Number = 25 (3.7) | Number = 2 (1.2) | |||
| Total dose (mg) | 3,897.2 (4,330.8) | 5,531.1 (3,998.5) | 6,866.2 (5,977.6) | 5,079.2 (4,933.2) | 10,520.0 (10,521.7) | 0.35 | 0.53 | ||
| Dose per kg of dosing body weight | 85.4 (91.9) | 84.9 (59.7) | 90.9 (80.2) | 54.3 (52.4) | 83.5 (86.7) | 0.33 | 0.15 | ||
| Ceftazidime | Number = 292 (10.1%) | Number = 25 (1.3) | Number = 106 (10.4) | Number = 89 (10.9) | Number = 58 (8.5) | Number = 14 (8.2) | |||
| Total dose (mg) | 2,710.0 (1,154.0) | 3,547.2 (1,867.7) | 2,995.3 (1,691.5) | 3,025.9 (1,590.6) | 3,285.7 (1,683.8) | 0.08 | 0.10 | ||
| Dose per kg of dosing body weight | 47.2 (18.3) | 57.5 (30.7) | 46.9 (28.0) | 43.9 (23.6) | 42.7 (17.7) | 0.01 | 0.48 | ||
| Ceftriaxone | Number = 232 (8.0%) | Number = 12 (6.1) | Number = 77 (7.5) | Number = 67 (7.6) | Number = 58 (8.5) | Number = 18 (10.6) | |||
| Total dose (mg) | 1,666.7 (492.4) | 1,655.8 (1,052.1) | 1,776.1 (884.6) | 1,672.4 (943.8) | 1,611.1 (607.7) | 0.93 | 0.77 | ||
| Dose per kg of dosing body weight | 31.9 (10.2) | 26.1 (14.4) | 27.5 (12.7) | 24.6 (13.7) | 21.5 (8.7) | 0.20 | 0.02 | ||
| Cefuroxime | Number = 772 (26.8%) | Number = 19 (9.7) | Number = 74 (7.3) | Number = 68 (8.3) | Number = 55 (8.1) | Number = 11(6.5) | |||
| Total dose (mg) | 2,578.9 (920.6) | 2,171.8 (1,063.2) | 2,216.9 (808.0) | 2,386.4 (842.7) | 2,181.8 (975.3) | 0.39 | 0.68 | ||
| Dose per kg of dosing body weight | 45.3 (18.9) | 35.1 (17.0) | 32.7 (12.9) | 34.6 (15.0) | 26.7 (12.1) | 0.01 | 0.02 |
aCrystalloid, colloid, crystalloid equivalent volume, red blood cell and fresh frozen plasma for first six hours. All others for day 1. bAdjusted for creatinine clearance. cAdjusted for creatinine clearance and pulmonary capillary wedge pressure. BMI, body mass index.
Outcomes
Crude hospital mortality, ICU mortality, hospital LOS and ICU LOS differed among the BMI groups (Table 5). Compared with patients with normal BMI, the crude OR for obese patients was 0.80, 95% CI 0.66 to 0.97 and for the morbidly obese was 0.61, 95% CI 0.44 to 0.85. After adjustment for baseline characteristics (model 1) and for baseline characteristics and sepsis interventions (model 2), the OR and CI became non-significant statistically (Figure 1).
Table 5.
Outcomes among different groups of BMI
| < 18.50 Number = 196 |
18.50 to 24.99 Number = 1,020 |
25.0 to 29.99 Number = 816 |
30.0 to 39.99 Number = 680 |
≥ 40 Number = 170 |
P value | |
|---|---|---|---|---|---|---|
| Hospital mortality, number (%) | 121 (61.7) | 580 (56.9) | 444 (54.4) | 349 (51.3) | 76 (44.7) | 0.003 |
| ICU mortality, number (%) | 102 (52.0) | 451 (44.2) | 335 (41.1) | 265 (39.0) | 57 (33.5) | 0.001 |
| ICU length of stay, mean (SD) | 9.9 (9.4) | 10.5 (12.5) | 11.4 (14.7) | 11.2 (14.3) | 12.2 (12.7) | 0.30 |
| Hospital length of stay, mean (SD) | 25.1 (33.6) | 25.1 (31.8) | 27.8 (35.2) | 26.5 (34.8) | 34.3 (44.2) | 0.02 |
BMI, body mass index.
Figure 1.
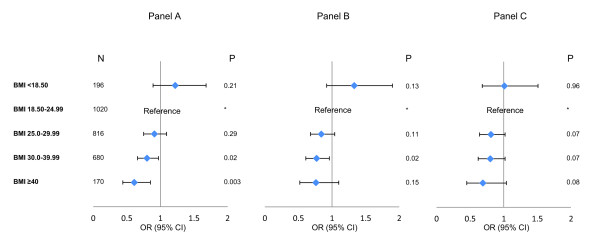
Odds ratios and confidence intervals of hospital mortality among different BMI groups in multivariate logistic regression analysis. Panel A: Crude analysis. Panel B: Adjusted analysis to baseline characteristics (model 1). Panel C: Adjusted analysis to baseline characteristics and sepsis interventions (model 2). BMI, body mass index.
Discussion
Our study found that: 1) the BMI of patients with septic shock varies considerably; 2) septic shock in the obese and very obese differs in the presentation, sites of infection and microbiology compared to non-obese patients; 3) sepsis interventions, especially the volume of resuscitation fluids and doses of antibiotics, do not appear to take into consideration the variations in BMI, leading to considerable differences in weight-adjusted doses; and 4) crude hospital mortality of obese and morbidly obese patients with septic shock was lower than normal weight patients, but this was explained at least in part by differences in baseline characteristics and sepsis interventions.
Our study revealed that obese and morbidly patients with septic shock display some differences in their clinical presentation, site and type of infection. Indeed, underweight and very obese patients with septic shock had fewer hemodynamic disturbances and, thus, required lower doses of vasopressors (expressed as mcg/kg/minute for norepinephrine and epinephrine) than normal weight patients, although with comparable APACHE II scores. Further, the source of infection in obese patients was more likely to be related to skin and soft tissue infections and less likely to be related to pneumonia with predominantly Gram-positive microorganisms.
Our study examined the influence of weight and BMI on sepsis interventions. We observed that similar volumes of resuscitation fluids and similar total doses of antimicrobials were administered regardless of BMI. This translated to lower volume/kg and dose/kg in the obese and very obese patients compared to the normal BMI patients even after adjustment for wedge pressure and creatinine clearance. For example, we found that very obese patients received 27.7 ± 22.0 ml/kg crystalloid volume in the first six hours compared to 55.0 ± 40.1 ml/kg in the underweight group. This probably reflects routine clinical practice which is not weight-based as physicians often administer a standard bolus of 1,000 ml crystalloid or 300 to 500 ml colloid, irrespective of body weight. Unlike pediatricians, physicians caring for adult patients do not routinely take weight and height into consideration in decision-making. The issue is further confounded by the large number of correction formulae for weight adjustment (actual, adjusted, ideal, predicted, antimicrobial dosing body weights) that are mostly not based on clinical outcome studies, leaving the bedside practitioner unclear about the best approach [6,29]. Additionally, it remains unclear whether dosing vasopressors, such as norepinephrine and epinephrine, based on weight (as mcg/kg/minute) is superior to non-weight based dosing (as mcg/minute) as both approaches are seen in practice and in clinical trials [30,31].
Our study shows that crude hospital mortality of obese and very obese patients with septic shock was lower than normal weight patients. Because the effect became insignificant after adjustment, we believe that the observed differences in mortality were explained partially by baseline characteristics and sepsis interventions. The effect of obesity on outcome of critically ill patients has been a subject of considerable debate [32]. Two meta-analyses revealed discordant results, with one showing no difference in mortality between obese and normal-weight critically ill adults [33] and another demonstrating a trend toward decreased risk of mortality in overweight and obese patients compared with those with normal BMI [11]. In septic shock, a retrospective study of 301 patients with septic shock found that overweight and obese patients had lower mortality than those with normal weight [18].
Despite this supportive evidence, how a condition that increases cause-specific mortality, such as ischemic heart disease, diabetes, cancer and respiratory diseases, can be neutral or even provides a survival advantage during critical illness, remains perplexing. Several possible explanations exist. First, epidemiologic and statistical reasons may explain the association. The lower observed mortality might be related to lead-time bias and to the earlier age in the very obese septic patients. Additionally, the obese and morbidly obese patients may be 'healthier' than the normal BMI patients. Obese patients displayed more diabetes and related complications, while the normal weight had more devastating illnesses, including hematologic and solid organ malignancies. Therefore, the observed differences in outcome may be related to worse outcome in the normal weight patients and not to 'better' outcome in the obese. Additionally, septic shock in the obese and very obese may be less severe as shown by the lower vasopressor doses. The calibration of APACHE II in morbidly obese patients has to be validated, because several of its components, such as oxygenation, may be altered due to obesity and not to the acute illness. Finally, although we adjusted for several co-morbidities, residual confounding cannot be ruled out.
Second, our study identified differences in sepsis interventions as one of the potential explanations for this apparent paradox. Several studies have highlighted disparities in care provided to patients in the obese and very obese groups compared with patients in other categories [34,35]. At present, there is no strong evidence to support whether a weight-based approach for fluid resuscitation, antibiotic or vasopressor dosing is superior to the non-weight-based approach. Our study shows clearly that obese patients received a lower amount of resuscitation fluids and dose of antibiotics based on weight. Although one cannot establish a causal relationship with mortality, emerging evidence suggests that over-resuscitation may have detrimental effects [36,37]. Therefore, it is appealing to speculate that this may have contributed to the higher mortality in both lower and normal BMI patients, thus making obesity appear neutral or protective. Further, our study did not examine other important sepsis interventions, such as tidal volume [38,39] and doses of other medications, all of which deserve further study.
Third, the observed association of obesity with lower mortality may be related to true biological reasons. One explanation is an underlying difference in metabolic and immune response to acute illness [40]. Obesity activates many inflammatory pathways that deregulate physiological responses, which maintain metabolic homeostasis including insulin and leptin sensitivity. One can speculate that a superimposed episode of acute inflammation triggered by sepsis on top of the chronic inflammation may induce a different immune response than in naïve patients. A second possible explanation has been variations in vital signs leading to perception of higher severity of illness [8]. However, in our cohort of patients with septic shock, we found that very obese patients had a slightly lower heart rate and respiratory rate and higher blood pressure and temperature, which may be related to a different response but could also be simply related to less severe shock in contrast to what has been suggested by Martino et al. [8].
It is important to note that these findings apply to the individual episode of septic shock only. Once septic shock sets in, our data suggest that patients in the obese and very obese groups may have outcomes that are similar or not worse than those in other groups. We did not capture data about the association between obesity and predisposition to sepsis in the general population. However, considering the younger age of very obese patients in the septic population, one may question whether obesity actually increases the risk for septic shock. This point and the life-long consequences of septic shock on the obese patients need to be studied in a population-based cohort.
Our study should be interpreted in light of its strengths and limitations. To our knowledge, this is the largest study to date specifically addressing the impact of obesity on outcomes among patients with septic shock. The inclusion of patients from 28 ICUs based in three geographic regions lends the study wide generalizability. In terms of limitations, the findings only highlight associations and cause-effect relationships cannot be inferred. We used the weight and height as documented in the medical records, the precision of which could not be verified. The availability of BMI data on only one third of patients may have led to selection bias. However, the comparison between excluded and included patients showed minor differences that are unlikely to explain the magnitude of the observed differences among BMI groups. Furthermore, this lack of data may represent perception bias as healthcare workers are more likely to measure height and weight in extreme groups of BMI. Our study did not address the possibility of measurement bias arising from systematic errors in measuring weight, height and blood pressure across different BMI groups. We adjusted for severity of illness as measured by APACHE II and other possible confounders; we cannot rule out residual confounding especially considering the large number of possible factors that may influence outcome in acutely ill patients. Finally, we do not have data on the sagittal abdominal diameter, which has been shown to be an independent risk factor of death in critically ill patients [41].
Conclusions
In the septic shock population, we observed the obesity paradox (lower mortality in the obese) reported in other populations. This may be related in part to differences in patient characteristics. However, the true paradox may lie in the variations in the sepsis interventions, such as the administration of resuscitation fluids and antimicrobial therapy. Further studies are warranted to examine whether a weight-based approach to common therapeutic interventions in septic shock influences outcome.
Key messages
• The presentation, microbiology and organ failures are different among obese patients compared to the non-obese.
• Very obese patients presented at an early age to the ICU with septic shock and had more underlying chronic co-morbidities compared to non-obese patients.
• There is a considerable variation in the volume of fluid resuscitation per kg and antibiotic dosing among different BMI groups.
• The obesity paradox (lower mortality in the obese) as reported in other populations was observed in septic shock patients as well.
• The true paradox may lie in the variations in the sepsis interventions, such as the administration of resuscitation fluids.
Abbreviations
ANOVA: analysis of variance; APACHE: Acute Physiology and Chronic Health Evaluation; BMI: body mass index; CATSS: Cooperative Antimicrobial Therapy of Septic Shock; COPD: chronic obstructive pulmonary disease; LOS: length of stay; MDRD: modification of diet in renal disease; OR: odds ratio; SAS: statistical analysis software; WHO: World Health Organization.
Competing interests
The authors declare that they have no competing interests.
Authors' contributions
YMA had full access to all of the data in the study and takes responsibility for the integrity and the accuracy of the data analysis YMA participated in conception and design, in analysis and interpretation of data, drafted the manuscript, critically revised the manuscript for important intellectual content and approved the final version to be published. SID participated in analysis and interpretation of data, helped to draft the manuscript, critically revised the manuscript for important intellectual content and approved the final version to be published. HMT performed statistical analysis, critically revised the manuscript for important intellectual content and approved the final version to be published. AHR collected the data for study, participated in statistical analysis, critically revised the manuscript for important intellectual content and approved the final version to be published. ARB, MKK, DF, JEP, KEW, SK, SZ, GM, ASK and AK participated in conception, design and development of the database, helped in analysis and interpretation of data, helped in drafting of the manuscript, critically revised the manuscript for important intellectual content and approved the final version to be published.
Supplementary Material
Appendix A: Definitions of organ failures. Appendix B: Formulas.
Contributor Information
Yaseen M Arabi, Email: yaseenarabi@yahoo.com.
Saqib I Dara, Email: saqibdara@yahoo.com.
Hani M Tamim, Email: Hani_t@hotmail.com.
Asgar H Rishu, Email: Rishua@ngha.med.sa.
Abderrezak Bouchama, Email: bouchamaab@ngha.med.sa.
Mohammad K Khedr, Email: mkhkheder@gmail.com.
Daniel Feinstein, Email: djfeinstein3@gmail.com.
Joseph E Parrillo, Email: JParrillo@HackensackUMC.org.
Kenneth E Wood, Email: kew@medicine.wisc.edu.
Sean P Keenan, Email: sean_keenan@telus.net.
Sergio Zanotti, Email: Zanotti-Sergio@CooperHealth.edu.
Greg Martinka, Email: martinka_g@telus.net.
Aseem Kumar, Email: akumar@laurentian.ca.
Anand Kumar, Email: akumar61@yahoo.com.
Acknowledgements
We thank the additional members of the Cooperative Antimicrobial Therapy of Septic Shock (CATSS) Database Research Group: Phillip Dellinger, MD, Cooper Hospital/University Medical Center, Camden NJ, USA. Sandra Dial, MD, McGill University, Montreal QC, Canada; Peter Dodek, MD, St. Paul's Hospital, Vancouver, BC, Canada; Paul Ellis, MD, University Health Network, Toronto, ON, Canada; Dave Gurka, MD, Rush-Presbyterian-St. Luke's Medical Center, Chicago IL, USA; Jose Guzman, Harper Hospital, Detroit, MI, USA; Andreas Kramer, MD, Brandon General Hospital, Brandon MB, Canada; Stephen Lapinsky, MD, Mount Sinai Hospital, Toronto ON, Canada; Denny Laporta, MD, Jewish General Hospital, Montreal QC, Canada; Kevin Laupland, MD, Foothills Hospital, Calgary AB, Canada; Bruce Light, MD, Winnipeg Regional Health Authority, Winnipeg MB, Canada; Dennis Maki, MD, University of Wisconsin Hospital and Clinics, Madison WI, USA; John Marshall, MD, St. Michael's Hospital, Toronto ON, Canada; Ziad Al Memish, MD, King Abdulaziz Medical City, Riyadh, Saudi Arabia; Yazdan Mirzanejad, MD, Surrey Memorial Hospital, Surrey, BC, Canada; Gourang Patel, PharmD, Rush-Presbyterian St. Luke's Medical Center, Chicago IL, USA; Charles Penner, MD, Brandon General Hospital, Brandon MD, Canada; Dan Roberts, MD, Winnipeg Regional Health Authority, Winnipeg MB, Canada; John Ronald, MD, Nanaimo Regional Hospital, Nanaimo BC, Canada; Dave Simon, MD, Rush-Presbyterian-St. Luke's Medical Center, Chicago IL, USA; Sat Sharma, MD Winnipeg Regional Health Authority, Winnipeg MB, Canada; Nehad Al Shirawi, MD, King Abdulaziz Medical City, Riyadh, Saudi Arabia; Yoanna Skrobik, MD, Hôpital Maisonneuve Rosemont, Montreal QC, Canada; Gordon Wood, MD, Royal Jubilee Hospital/Victoria General Hospital, Victoria BC, Canada.
Associate Members of the CATSS Database Research Group:
Muhammed Wali Ahsan, MD, Winnipeg MB, Canada. Mozdeh Bahrainian, MD, Madison WI. Rob Bohmeier, University of Manitoba, Winnipeg MB, Canada. Lindsey Carter, MD, University of Manitoba, Winnipeg MB, Canada. Harris Chou, BSc, of British Columbia, Vancouver BC, Canada. Sofia Delgra, RN, King Abdulaziz Medical City, Riyadh, Saudi Arabia. Collins Egbujuo, MD, Winnipeg MB, Canada. Winnie Fu, University of British Columbia, Vancouver BC, Canada. Catherine Gonzales, RN, King Abdulaziz Medical City, Riyadh, Saudi Arabia. Harleena Gulati, MD, University of Manitoba, Winnipeg MB, Canada. Erica Halmarson, MD, University of Manitoba, Winnipeg MB, Canada. John Hansen, MD, Winnipeg MB, Canada. Ziaul Haque, MD, Montreal QC, Canada. Johanne Harvey, RN, Hôpital Maisonneuve Rosemont, Montreal QC, Canada. Farah Khan, MD, Toronto ON, Canada. Laura Kolesar, RN, St. Boniface Hospital, Winnipeg MB, Canada. Laura Kravetsky, MD, University of Manitoba, Winnipeg MB, Canada. Runjun Kumar, University of Toronto, Toronto ON, Canada. Nasreen Merali, MD, Winnipeg MB, Canada. Sheri Muggaberg, University of Manitoba, Winnipeg MB, Canada. Heidi Paulin, University of Toronto, Toronto ON, Canada. Cheryl Peters, RN, MD, University of Manitoba, Winnipeg MB, Canada. Jody Richards, Camosun College, Victoria BC, Canada. Christa Schorr, RN, Cooper Hospital/University Medical Center, Camden NJ, USA. Norrie Serrano, RN, King Abdulaziz Medical City, Riyadh, Saudi Arabia. Mustafa Suleman, MD, Concordia Hospital, Winnipeg, MB. Amrinder Singh, MD, Winnipeg MB Canada. Katherine Sullivan, University of Manitoba, Winnipeg MB, Canada. Robert Suppes, MD, University of Manitoba, Winnipeg MB, Canada. Leo Taiberg, MD, Rush Medical College, Chicago IL, USA. Ronny Tchokonte, MD, Wayne State University Medical School, Detroit MI, USA. Omid Ahmadi Torshizi, MD, Montreal QC, Canada. Kym Wiebe, RN, St. Boniface Hospital, Winnipeg MB, Canada.
Financial and material support: This study was supported by unrestricted research grants to Anand Kumar from Eli-Lilly, Pfizer, Bayer, Astellas, Merck, the Manitoba Health Research Council, the Health Sciences Centre (Winnipeg) Foundation, the Innovations and Opportunities Foundation (Winnipeg) and the Deacon Foundation (Winnipeg).
References
- Katzmarzyk PT, Reeder BA, Elliott S, Joffres MR, Pahwa P, Raine KD, Kirkland SA, Paradis G. Body mass index and risk of cardiovascular disease, cancer and all-cause mortality. Can J Public Health. 2012;103:147–151. doi: 10.1007/BF03404221. [DOI] [PMC free article] [PubMed] [Google Scholar]
- Yusuf S, Hawken S, Ounpuu S, Bautista L, Franzosi MG, Commerford P, Lang CC, Rumboldt Z, Onen CL, Lisheng L, Tanomsup S, Wangai P Jr, Razak F, Sharma AM, Anand SS. INTERHEART Study Investigators. Obesity and the risk of myocardial infarction in 27,000 participants from 52 countries: a case-control study. Lancet. 2005;366:1640–1649. doi: 10.1016/S0140-6736(05)67663-5. [DOI] [PubMed] [Google Scholar]
- Hossain P, Kawar B, El Nahas M. Obesity and diabetes in the developing world--a growing challenge. N Engl J Med. 2007;356:213–215. doi: 10.1056/NEJMp068177. [DOI] [PubMed] [Google Scholar]
- Al-Baghli NA, Al-Ghamdi AJ, Al-Turki KA, El-Zubaier AG, Al-Ameer MM, Al-Baghli FA. Overweight and obesity in the eastern province of Saudi Arabia. Saudi Med J. 2008;29:1319–1325. [PubMed] [Google Scholar]
- Institute of Medicine of the National Academics Recommendation on Obseity Prevention. [ http://iom.edu/~/media/Files/Report%20Files/2012/APOP/APOP_rb.pdf] Accessed on 14 May 2009.
- El-Solh AA. Clinical approach to the critically ill, morbidly obese patient. Am J Respir Crit Care Med. 2004;169:557–561. doi: 10.1164/rccm.200309-1256CC. [DOI] [PubMed] [Google Scholar]
- Sakr Y, Madl C, Filipescu D, Moreno R, Groeneveld J, Artigas A, Reinhart K, Vincent JL. Obesity is associated with increased morbidity but not mortality in critically ill patients. Intensive Care Med. 2008;34:1999–2009. doi: 10.1007/s00134-008-1243-0. [DOI] [PubMed] [Google Scholar]
- Martino JL, Stapleton RD, Wang M, Day AG, Cahill NE, Dixon AE, Suratt BT, Heyland DK. Extreme obesity and outcomes in critically ill patients. Chest. 2011;140:1198–1206. doi: 10.1378/chest.10-3023. [DOI] [PMC free article] [PubMed] [Google Scholar]
- Hutagalung R, Marques J, Kobylka K, Zeidan M, Kabisch B, Brunkhorst F, Reinhart K, Sakr Y. The obesity paradox in surgical intensive care unit patients. Intensive Care Med. 2011;37:1793–1799. doi: 10.1007/s00134-011-2321-2. [DOI] [PubMed] [Google Scholar]
- Habbu A, Lakkis NM, Dokainish H. The obesity paradox: fact or fiction? Am J Cardiol. 2006;98:944–948. doi: 10.1016/j.amjcard.2006.04.039. [DOI] [PubMed] [Google Scholar]
- Oliveros H, Villamor E. Obesity and mortality in critically ill adults: a systematic review and meta-analysis. Obesity (Silver Spring) 2008;16:515–521. doi: 10.1038/oby.2007.102. [DOI] [PubMed] [Google Scholar]
- Akinnusi ME, Pineda LA, El Solh AA. Effect of obesity on intensive care morbidity and mortality: a meta-analysis. Crit Care Med. 2008;36:151–158. doi: 10.1097/01.CCM.0000297885.60037.6E. [DOI] [PubMed] [Google Scholar]
- Angus DC, Linde-Zwirble WT, Lidicker J, Clermont G, Carcillo J, Pinsky MR. Epidemiology of severe sepsis in the United States: analysis of incidence, outcome, and associated costs of care. Crit Care Med. 2001;29:1303–1310. doi: 10.1097/00003246-200107000-00002. [DOI] [PubMed] [Google Scholar]
- Dombrovskiy VY, Martin AA, Sunderram J, Paz HL. Rapid increase in hospitalization and mortality rates for severe sepsis in the United States: a trend analysis from 1993 to 2003. Crit Care Med. 2007;35:1244–1250. doi: 10.1097/01.CCM.0000261890.41311.E9. [DOI] [PubMed] [Google Scholar]
- Martin GS, Mannino DM, Eaton S, Moss M. The epidemiology of sepsis in the United States from 1979 through 2000. N Engl J Med. 2003;348:1546–1554. doi: 10.1056/NEJMoa022139. [DOI] [PubMed] [Google Scholar]
- Adrie C, Alberti C, Chaix-Couturier C, Azoulay E, De Lassence A, Cohen Y, Meshaka P, Cheval C, Thuong M, Troche G, Garrouste-Orgeas M, Timsit JF. Epidemiology and economic evaluation of severe sepsis in France: age, severity, infection site, and place of acquisition (community, hospital, or intensive care unit) as determinants of workload and cost. J Crit Care. 2005;20:46–58. doi: 10.1016/j.jcrc.2004.10.005. [DOI] [PubMed] [Google Scholar]
- Vachharajani V, Russell JM, Scott KL, Conrad S, Stokes KY, Tallam L, Hall J, Granger DN. Obesity exacerbates sepsis-induced inflammation and microvascular dysfunction in mouse brain. Microcirculation. 2005;12:183–194. doi: 10.1080/10739680590904982. [DOI] [PubMed] [Google Scholar]
- Wurzinger B, Dunser MW, Wohlmuth C, Deutinger MC, Ulmer H, Torgersen C, Schmittinger CA, Grander W, Hasibeder WR. The association between body-mass index and patient outcome in septic shock: a retrospective cohort study. Wien Klin Wochenschr. 2010;122:31–36. doi: 10.1007/s00508-009-1241-4. [DOI] [PubMed] [Google Scholar]
- Bone RC, Balk RA, Cerra FB, Dellinger RP, Fein AM, Knaus WA, Schein RM, Sibbald WJ. Definitions for sepsis and organ failure and guidelines for the use of innovative therapies in sepsis. The ACCP/SCCM Consensus Conference Committee. American College of Chest Physicians/Society of Critical Care Medicine. Chest. 1992;101:1644–1655. doi: 10.1378/chest.101.6.1644. [DOI] [PubMed] [Google Scholar]
- Kumar A, Ellis P, Arabi Y, Roberts D, Light B, Parrillo JE, Dodek P, Wood G, Simon D, Peters C, Ahsan M, Chateau D. Cooperative Antimicrobial Therapy of Septic Shock Database Research Group. Initiation of inappropriate antimicrobial therapy results in a fivefold reduction of survival in human septic shock. Chest. 2009;136:1237–1248. doi: 10.1378/chest.09-0087. [DOI] [PubMed] [Google Scholar]
- Kumar A, Zarychanski R, Light B, Parrillo J, Maki D, Simon D, Laporta D, Lapinsky S, Ellis P, Mirzanejad Y, Martinka G, Keenan S, Wood G, Arabi Y, Feinstein D, Kumar A, Dodek P, Kravetsky L, Doucette S. Cooperative Antimicrobial Therapy of Septic Shock (CATSS) Database Research Group. Early combination antibiotic therapy yields improved survival compared with monotherapy in septic shock: a propensity-matched analysis. Crit Care Med. 2010;38:1773–1785. doi: 10.1097/CCM.0b013e3181eb3ccd. [DOI] [PubMed] [Google Scholar]
- WHO classification of body mass index (BMI) [ http://apps.who.int/bmi/index.jsp?introPage=intro_3.html] Accessed on 9 April 2012.
- Knaus WA, Draper EA, Wagner DP, Zimmerman JE. APACHE II: a severity of disease classification system. Crit Care Med. 1985;13:818–829. doi: 10.1097/00003246-198510000-00009. [DOI] [PubMed] [Google Scholar]
- Levey AS, Bosch JP, Lewis JB, Greene T, Rogers N, Roth D. A more accurate method to estimate glomerular filtration rate from serum creatinine: a new prediction equation. Modification of Diet in Renal Disease Study Group. Ann Intern Med. 1999;130:461–470. doi: 10.7326/0003-4819-130-6-199903160-00002. [DOI] [PubMed] [Google Scholar]
- Cockcroft DW, Gault MH. Prediction of creatinine clearance from serum creatinine. Nephron. 1976;16:31–41. doi: 10.1159/000180580. [DOI] [PubMed] [Google Scholar]
- Michels WM, Grootendorst DC, Verduijn M, Elliott EG, Dekker FW, Krediet RT. Performance of the Cockcroft-Gault, MDRD, and new CKD-EPI formulas in relation to GFR, age, and body size. Clin J Am Soc Nephrol. 2010;5:1003–1009. doi: 10.2215/CJN.06870909. [DOI] [PMC free article] [PubMed] [Google Scholar]
- Wurtz R, Itokazu G, Rodvold K. Antimicrobial dosing in obese patients. Clin Infect Dis. 1997;25:112–118. doi: 10.1086/514505. [DOI] [PubMed] [Google Scholar]
- Kumar A, Roberts D, Wood KE, Light B, Parrillo JE, Sharma S, Suppes R, Feinstein D, Zanotti S, Taiberg L, Gurka D, Kumar A, Cheang M. Duration of hypotension before initiation of effective antimicrobial therapy is the critical determinant of survival in human septic shock. Crit Care Med. 2006;34:1589–1596. doi: 10.1097/01.CCM.0000217961.75225.E9. [DOI] [PubMed] [Google Scholar]
- Erstad BL. Dosing of medications in morbidly obese patients in the intensive care unit setting. Intensive Care Med. 2004;30:18–32. doi: 10.1007/s00134-003-2059-6. [DOI] [PubMed] [Google Scholar]
- Annane D, Vignon P, Renault A, Bollaert PE, Charpentier C, Martin C, Troche G, Ricard JD, Nitenberg G, Papazian L, Azoulay E, Bellissant E. CATS Study Group. Norepinephrine plus dobutamine versus epinephrine alone for management of septic shock: a randomised trial. Lancet. 2007;370:676–684. doi: 10.1016/S0140-6736(07)61344-0. [DOI] [PubMed] [Google Scholar]
- Russell JA, Walley KR, Singer J, Gordon AC, Hebert PC, Cooper DJ, Holmes CL, Mehta S, Granton JT, Storms MM, Cook DJ, Presneill JJ, Ayers D. VASST Investigators. Vasopressin versus norepinephrine infusion in patients with septic shock. N Engl J Med. 2008;358:877–887. doi: 10.1056/NEJMoa067373. [DOI] [PubMed] [Google Scholar]
- O'Brien JM Jr, Welsh CH, Fish RH, Ancukiewicz M, Kramer AM. Excess body weight is not independently associated with outcome in mechanically ventilated patients with acute lung injury. Ann Intern Med. 2004;140:338–345. doi: 10.7326/0003-4819-140-5-200403020-00009. [DOI] [PubMed] [Google Scholar]
- Hogue CW Jr, Stearns JD, Colantuoni E, Robinson KA, Stierer T, Mitter N, Pronovost PJ, Needham DM. The impact of obesity on outcomes after critical illness: a meta-analysis. Intensive Care Med. 2009;35:1152–1170. doi: 10.1007/s00134-009-1424-5. [DOI] [PubMed] [Google Scholar]
- O'Brien JM Jr, Philips GS, Ali NA, Aberegg SK, Marsh CB, Lemeshow S. The association between body mass index, processes of care, and outcomes from mechanical ventilation: a prospective cohort study. Crit Care Med. 2012;40:1456–1463. doi: 10.1097/CCM.0b013e31823e9a80. [DOI] [PubMed] [Google Scholar]
- O'Brien JM Jr, Phillips GS, Ali NA, Lucarelli M, Marsh CB, Lemeshow S. Body mass index is independently associated with hospital mortality in mechanically ventilated adults with acute lung injury. Crit Care Med. 2006;34:738–744. doi: 10.1097/01.CCM.0000202207.87891.FC. [DOI] [PMC free article] [PubMed] [Google Scholar]
- Wiedemann HP, Wheeler AP, Bernard GR, Thompson BT, Hayden D, deBoisblanc B, Connors AF Jr, Hite RD, Harabin AL. Comparison of two fluid-management strategies in acute lung injury. N Engl J Med. 2006;354:2564–2575. doi: 10.1056/NEJMoa062200. [DOI] [PubMed] [Google Scholar]
- Maitland K, Kiguli S, Opoka RO, Engoru C, Olupot-Olupot P, Akech SO, Nyeko R, Mtove G, Reyburn H, Lang T, Brent B, Evans JA, Tibenderana JK, Crawley J, Russell EC, Levin M, Babiker AG, Gibb DM. FEAST Trial Group. Mortality after fluid bolus in African children with severe infection. N Engl J Med. 2011;364:2483–2495. doi: 10.1056/NEJMoa1101549. [DOI] [PubMed] [Google Scholar]
- Anzueto A, Frutos-Vivar F, Esteban A, Bensalami N, Marks D, Raymondos K, Apezteguia C, Arabi Y, Hurtado J, Gonzalez M, Tomicic V, Abroug F, Elizalde J, Cakar N, Pelosi P, Ferguson ND. Ventila group. Influence of body mass index on outcome of the mechanically ventilated patients. Thorax. 2011;66:66–73. doi: 10.1136/thx.2010.145086. [DOI] [PubMed] [Google Scholar]
- Gong MN, Bajwa EK, Thompson BT, Christiani DC. Body mass index is associated with the development of acute respiratory distress syndrome. Thorax. 2010;65:44–50. doi: 10.1136/thx.2009.117572. [DOI] [PMC free article] [PubMed] [Google Scholar]
- Stapleton RD, Dixon AE, Parsons PE, Ware LB, Suratt BT. The association between BMI and plasma cytokine levels in patients with acute lung injury. Chest. 2010;138:568–577. doi: 10.1378/chest.10-0014. [DOI] [PMC free article] [PubMed] [Google Scholar]
- Paolini JB, Mancini J, Genestal M, Gonzalez H, McKay RE, Samii K, Fourcade OA. Predictive value of abdominal obesity vs. body mass index for determining risk of intensive care unit mortality. Crit Care Med. 2010;38:1308–1314. doi: 10.1097/CCM.0b013e3181d8cd8b. [DOI] [PubMed] [Google Scholar]
Associated Data
This section collects any data citations, data availability statements, or supplementary materials included in this article.
Supplementary Materials
Appendix A: Definitions of organ failures. Appendix B: Formulas.