

Abstract
Background
Motor practice is important component of neurorehabilitation. Imaging studies in healthy subjects show dynamic brain activation changes with practice. Defining patterns of functional brain plasticity associated with motor practice following stroke could guide rehabilitation.
Objective
We aimed to test whether practice-related changes in brain activity differ after stroke and to explore spatial relationships between activity changes and patterns of structural degeneration.
Methods
10 patients at least 6 months after left hemisphere subcortical strokes and 18 healthy controls were studied. Diffusion-weighted magnetic resonance imaging (MRI) was acquired at baseline and functional MRI (fMRI) was acquired during performance of a visuo-motor tracking task, before and after a 15 day period of practice of the same task.
Results
Smaller short-term practice effects at baseline correlated with lower fractional anisotropy in the posterior limbs of the internal capsule bilaterally in patients (t>3; cluster p<0.05). After 15 days of motor practice a significant group-by-time interaction (z>2.3; cluster p<0.05) was found in the basal ganglia, thalamus, inferior frontal gyrus, superior temporal gyrus and insula: healthy controls showed decreases and patients showed increases in activity with practice in these regions, some of which showed loss of white matter connectivity at baseline.
Conclusions
Performance gains with motor practice can be associated with increased activity in regions that have been either directly or indirectly impaired by loss of connectivity. These results suggest that neurorehabilitation methods can be associated not just with compensatory adaptation of intact brain regions, but also with enhanced activity in regions with impaired structural connectivity.
Keywords: Stroke, fmri, diffusion, MRI, motor practice, rehabilitation
Introduction
Repetitive movement practice is an important component of neurorehabilitation after stroke1. Improvements in movement performance with practice provide a model for rehabilitation2 and clinical studies have documented performance gains during practice of a motor skill by patients following stroke3-5,
Imaging studies in healthy subjects have shown that gains in motor performance with practice are mediated by dynamic changes in brain activation in specific cortical and subcortical regions of the motor control network6-9. For example, practice-related improvements in visuo-motor tracking are associated with activity changes in prefrontal cortex and basal ganglia6. The neural correlates of motor performance gains with practice have only recently begun to be explored in patients after stroke, however10. Defining patterns of functional brain plasticity associated with motor practice could help to stratify patients for intensive rehabilitation interventions11 or to guide targeted therapeutic approaches, such as brain stimulation12, that can enhance local plasticity during motor training.
Here we test the hypothesis that practice-related changes in brain activity are different in patients after stroke compared to healthy controls. Further, we explore spatial relationships between the practice-related changes in brain activity and patterns of structural degeneration following stroke.
To do this, we used serial functional magnetic resonance imaging (fMRI) to assess changes in task-related brain activation while subjects performed a complex visuomotor tracking task before and after 15 consecutive days of practice. Practice-related changes in brain activity were contrasted between patients who had suffered a single subcortical left hemisphere stroke more than six months previously and age-matched healthy control subjects. We also acquired diffusion-weighted MRI (shown previously to be sensitive not just to the stroke, but also to secondary degeneration post-stroke13-15) at baseline only to assess white matter structural integrity. We tested for correlations between white matter integrity and task performance and explored the anatomical relationships between practice-related fMRI changes and cortical regions with impaired white matter connectivity at baseline as a consequence of the prior stroke.
Methods
Subjects
Ten right-handed patients who had previously suffered a first stroke (Table 1) and 18 age-matched right-handed controls (mean age, 58 years; range, 30-81 years; 7 women, 11 men) gave written informed consent to participate in accordance with the Declaration of Helsinki and local Research Ethics Committee approval (05/Q1607/63). All patients were at least 6 months post a first ischaemic or haemorrhagic left hemisphere subcortical stroke affecting motor function in the right hand and were without a history or signs and symptoms of any other neurological conditions. Patients had intact sensation to light touch in affected limbs, were able to give informed consent, and did not have aphasia significantly limiting communication (National Institute of Health Stroke Scale rating >2). Patients all demonstrated visual acuity (corrected or uncorrected) sufficient to follow movement of the visual target on the MRI projection screen (during fMRI scanning) or on the laptop computer screen used for home training and could generate sufficient grip force for visuomotor responses to be tracked consistently by the computer.
Table 1.
Patient demographics
| Age | Gender | Fugl-Meyer score† |
Grip strength* (%) |
Time post stroke (month) |
Lesion volume (cm3) |
|
|---|---|---|---|---|---|---|
| 61 | F | 24 | 8 | 7 | 7.0 | |
| 59 | M | 42 | 29 | 22 | 9.1 | |
| 67 | M | 61 | 67 | 36 | 3.5 | |
| 68 | M | 59 | 68 | 43 | 32.4 | |
| 69 | M | 51 | 81 | 21 | 72.9 | |
| 54 | M | 50 | 71 | 23 | 1.3 | |
| 83 | M | 45 | 36 | 18 | 9.0 | |
| 41 | M | 64 | 85 | 8 | 40.73 | |
| 70 | M | 61 | 85 | 37 | 6.6 | |
| 50 | M | 64 | 52 | 34 | 152.1 | |
|
| ||||||
| Median | 64 | 55 | 67.5 | 22.5 | 9.05 | |
upper extremity FM score50 ranges from 0 to 66, higher values reflect better function.
Grip strength for the paretic limb as a percentage of the maximum grip strength for the contralateral, unimpaired hand in each patient.
Visuomotor tracking task
Subjects viewed a computer screen displaying two moving bars: a computer-controlled target bar indicating the required relative force (in green) and an adjacent response bar showing the instantaneous force generated by the subject (in blue if the correct force is generated or red if the force deviates from the target force by more than 40 pixels in the visual display). The task for subjects was to match the height of the response bar to that of the target bar by altering grip force applied to an isometric pressure-sensing device held in their right hand16. The force required to move the bar to its maximum amplitude was calibrated to 80% of the subject’s maximum grip strength.
During fMRI sessions, the task included alternating 38 second blocks of rest and task conditions. In the task condition of interest, blocks consisted of 2 repeats of a specific sequence of sinusoidally varying target bar movements. Subjects were informed that there was a repeating sequence within the block, so this would be learned explicitly. A second task condition required subjects to track random bar movements, but activation during this task is not further considered here. During rest blocks subjects did not move and passively viewed two bars, the relative movements of which were intended to mimic those during the tracking periods (a “target” bar moved to trace a sinusoidal trajectory slightly ahead of the second, “response” bar). Subjects practiced the visuomotor tracking task for four blocks outside the scanner before their first recorded trial.
Performance gains with practice of the visuomotor tracking task were assessed using a 15 day period of daily home practice (10 blocks, each containing 2 repeats of the same sequence used during fMRI, with alternating 5 second rest periods) using a laptop and identical grip device.
Behavioral analysis of practice effects
For task performance during fMRI, the mean error (calculated as the absolute difference in height between the target and response bars) per block was assessed using a repeated measures ANOVA with within-subject factors of Block (1-10) and Condition (Random, Sequence) and the between-subject factor of Group (Patients, Controls). A short-term practice score for each subject was calculated as [ErrorBLOCK 1 / ErrorBLOCKS 7-10]. The mean error per day from the home practice sessions was assessed similarly using a repeated measures ANOVA with within-subject factor of Day (1-15) and between-subject factor of Group (Patients, Controls). A long-term practice score for each subject was calculated as [ErrorDAY 1 / ErrorDAYS 10-15].
MRI data acquisition
Functional magnetic resonance imaging
FMRI data were acquired at baseline and after 15 days of task practice on a 3 Tesla Varian MRI scanner using a multi-slice gradient echo planar imaging (EPI) sequence (echo time = 60 ms, repetition time = 3000 ms, field of view 240 × 240 mm2, matrix 64 × 64; 21 contiguous axial 6mm thick slices). T1-weighted high-resolution MRI scans (1×1×1mm) were acquired for anatomical localisation and lesion volume calculation.
Diffusion-weighted magnetic resonance imaging
High angular resolution diffusion-weighted imaging data were acquired at baseline on a 1.5 Tesla Siemens Sonata MR scanner with maximum gradient strength of 40 mTm−1 using echo planar imaging (TR=8500ms; TE=80ms; 53×2.5mm thick axial slices; voxel size 2.5×2.5×2.5mm3; 60 isotropically distributed diffusion directions; b-value=1000smm−2) and 5 volumes with no diffusion weighting.
MR image analysis
Analysis of MRI data was carried out using tools from the FMRIB Software Library (www.fmrib.ox.ac.uk/fsl)17. The stroke lesion volume was segmented for each patient by manually delineating the region of abnormally hypointense signal on the patient’s T1-weighted scan using FSLview and calculating the volume of this region using fslstats.
Diffusion MRI analysis
FMRIB’s Diffusion Toolbox (FDT) was used to correct for head motion and eddy currents and to fit a diffusion tensor model and calculate fractional anisotropy (FA) at each brain voxel. Voxelwise statistical analysis of FA on a white matter ‘skeleton’ was conducted using TBSS (Tract-Based Spatial Statistics), as described elsewhere18. Randomise was used for permutation-based testing (5000 permutations) and significant clusters defined using a cluster forming threshold of t=3 and a corrected cluster size p<0.05.
A general linear model was used to test for voxel-wise relationships with FA. Age was included as a co-variate of no interest. We constructed within-group (patient or healthy control) design matrices to test for correlations between FA and short-term practice scores for performance of the visuomotor task. We included average tracking error and (for the patient group only) Fugl-Meyer score as co-variates of no interest, so results reflect the practice-related component of the task across the multiple blocks rather than simply overall performance differences.
Probabilistic tractography, based on a multi-fiber probabilistic diffusion model19, 20 fit to each voxel, was run to estimate intra-hemispheric connectivity between 56 brain regions (48 cortical, 8 subcortical), defined using the Harvard-Oxford atlas (available within FSLview), and linearly aligned with each subject’s diffusion data using FLIRT. From every seed voxel, 5000 samples were initiated and the number reaching every other brain region was recorded, giving an estimate of connectivity probability between pairs of brain regions for each subject. For each brain region, the average connectivity probability to all other brain regions was calculated averaged across subjects to calculate the percentage reduction in connectivity probability in patients compared to controls.
fMRI analysis
Pre-statistical processing of fMRI data included motion correction, spatial smoothing using a Gaussian kernel of full-width half-maximum 8 mm, and non-linear high-pass temporal filtering (Gaussian-weighted LSF straight line fitting, with sigma = 80.0). De-noising was performed using independent component analysis in MELODIC21, with the number of output components limited to 50. Artifact components due, for example, to ghosting, slice drop out or head motion, were defined using conservative criteria (http://www.fmrib.ox.ac.uk/analysis/research/melodic/) and removed from the data. Registration of functional images to high resolution and standard (Montreal Neurological Institute) space was carried out using non-linear registration (FNIRT) with manually-defined lesion masks to down-weight the influence of the lesion.
Statistical analysis was carried out using the general linear model with local autocorrelation correction22. A first level analysis modelled individual subject data from each session and included four regressors in total: two regressors modelling sequence and random visuomotor tracking blocks using fixed height box-cars and two confound regressors that modelled these box-cars convolved with a linear trend, to co-vary out time-varying effects in task-related activity. Sequence ‘boxcar’ versus rest was the contrast of interest used for all subsequent analyses.
Higher-level random effects analyses with outlier detection23 combined data across subjects and/or sessions in a series of general linear models. An analysis of baseline data in all subjects included group mean regressors (patients and controls) and specified a contrast to test for differences in task-related (sequence versus rest) activity between groups. Fugl-Meyer scores of motor impairment were included in the model for the patients to covary out effects of impairment on baseline activity. An analysis of both sessions across all subjects included two session regressors to differentiate between baseline and follow-up sessions for each group separately, a regressor for each subject to identify his/her baseline and follow-up sessions and a (demeaned) age regressor. A contrast was specified to test for differences in the effects of session between groups (i.e., a group by session interaction). Z-statistic images were cluster thresholded using an initial cluster-forming threshold of z>2.3, and a corrected cluster extent threshold of p<0.05. Signal change from peak voxels within clusters showing significant interactions was plotted to illustrate patterns of activation differences that were driving significant effects.
Results
Patients had a broad range of disability (median Fugl-Meyer score, 55; range, 24-64) and of stroke lesion volumes (median, 9 cm3; range, 1-73 cm3) (Table 1).
Both the patients and the healthy controls performed a simple visuomotor tracking task with their right hand during the baseline fMRI examination. Patients showed a trend to greater performance error than the healthy controls (main effect of group: F(1,24)=3.98, p<0.058), but both groups showed significant improvements in performance with practice over the multiple task blocks within the session (main effect of block: F (9,216)=6.90, p<0.001). There was a positive correlation between this short-term improvement in performance with practice for patients and FA in clusters localised to the posterior limb of the internal capsule bilaterally for the patients (Figure 1, t>3, corrected p<0.05; r2=0.58). Controls showed no significant correlation between white matter FA and improvement in performance.
Figure 1. Diffusion MRI fractional anisotropy at baseline correlated strongly with improvements in visuomotor tracking performance during task practice.

To the left, bilateral clusters within the posterior limb of the internal capsule showing a positive correlation of short-term practice scores and FA are illustrated (blue, thickened; FA skeleton in green) (t>3, corrected p<0.05). A scatter plot defining the relationship between FA at the peak voxel within the clusters and short-term practice score is shown on the right. FA explained a majority of the variance in performance scores between patients (r2=0.58). (Note that practice ratios are positive but here we plot the demeaned and orthogonalised values entered into the GLM).
FMRI analysis showed that, at baseline, performance of the sequence tracking task versus rest was associated with activation of contralateral sensorimotor and bilateral premotor and parietal cortical areas, basal ganglia, thalamus and cerebellum across all subjects (data not shown). A mask derived from this supra-threshold task-related activity across all subjects defined a region of interest (ROI) for the voxel-wise contrasts between groups. Patients showed significantly reduced activation relative controls at baseline in the left precentral gyrus (including the primary sensorimotor cortex), left superior frontal gyrus (including the dorsal premotor cortex) and in left supplementary and pre-supplementary motor areas, as well as in lobules V and VI of the right cerebellum and bilaterally in the thalamus (Figure 2, Table 2).
Figure 2. Patients showed decreased brain activation relative to healthy controls for the main effect of the visuomotor tracking task at baseline.
Brain regions in which controls have greater activation than patients during performance of the visuomotor tracking task at baseline. Axial slices are shown for MNI z-coordinates provided in the figure. The activation changes are illustrated with a cluster forming threshold of Z>2.3, and a corrected cluster extent threshold of p<0.05 and are superimposed on a background MNI template brain image with the left hand side of the brain (ipsilesional in patients) displayed on the right hand side of each brain slice. See Table 2 for details of local maxima.
Table 2.
Local maxima for significant task-related activation clusters that differ between patients and controls at baseline
| Anatomical localisation | Maximum Z-score |
x | y | z | Cluster size (voxels) |
|---|---|---|---|---|---|
| Left precentral gyrus | 3.62 | −54 | 0 | 36 | 720 |
| Left superior frontal gyrus | 3.58 | −18 | 6 | 50 | |
|
| |||||
| Right cerebellum (lobules V, VI) |
4.16 | 18 | −56 | −26 | 1423 |
|
| |||||
| Right posterior thalamus | 3.55 | 22 | −22 | 12 | 368 |
|
| |||||
| Left thalamus | 2.31 | −16 | −16 | 14 | 646 |
For clusters spanning multiple anatomical regions, more than one local maxima may be provided
Following baseline testing, participants practiced the visuomotor tracking sequence at home for 15 days. Both patients and controls showed a decrease in mean tracking error over this practice period (Figure 3; main effect of day: F(13,299)=11.17, p<=0.001) with a main effect of group (F(1,23)=5.26, p=0.03) reflecting a consistently greater relative performance error in the patients. Separate ANOVA tests for patients and controls confirmed a significant decrease in error over time for both groups (main effect of day; patients: F(13,104)=6.11, p<0.001; controls: F(13,195)=4.34, p<0.001). There was a significant interaction between day and group (F(13,299)=6.28, p<0.005) because of a greater practice effect for the patients (practice score=2.02 ± 0.95) relative to the controls (1.27 ± 0.33) (t=2.3, df=9.1, p=0.048, corrected for unequal variances).
Figure 3. Home practice was associated with improved performance on the visuomotor tracking task for the patients.

The mean error per block or per day for patients (black) and healthy controls (grey) during home practice sessions decreased monotonically over the practice period. The bars reflect standard errors of the mean.
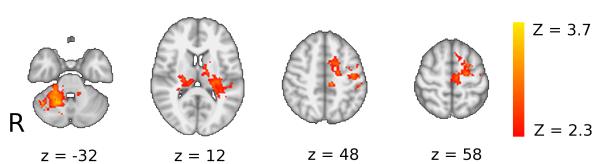
FMRI was repeated during performance of the visuomotor task after the home practice period. The main effects of task were similar to those at baseline (data not shown). We tested for between-group differences in activation changes between the baseline and post-practice, follow-up examinations; significant group-by-time interactions were found in the left inferior frontal gyrus, bilateral insula and right superior temporal gyrus. Subcortically, interactions were found in left ventrolateral and lateral posterior thalamic nuclei, left globus pallidus and left posterior putamen (Figure 4A; Table 3). Post-hoc analyses were performed to characterise these regional activation differences (Figure 4B,C). We found the group differences were a consequence of decreases in activation for the healthy controls after practice and either no change or increases in activation for the patients. A double dissociation in the direction of activation changes with practice for patients relative to controls was found in the thalamus and insula.
Figure 4. Patients showed increased brain activation with motor practice relative to controls and many of these brain regions correspond well with those that had impaired white matter connectivity at baseline.

A. Brain regions showing significant differences between patients and controls for task performance at baseline versus performance following three weeks of task practice. Axial slices at MNI levels indicated were thresholded at an initial cluster forming threshold of Z>2.3, and a corrected cluster extent threshold of p<0.05. The left hand side of the brain (ipsilesional in patients) is displayed on the right hand side of each brain slice. See Table 3 for details of local maxima. B,C: Region of interest analyses to characterise direction of activation change in clusters showing group by time interaction in the thalamus (B) and insula (C). D. Brain atlas regions with reduced white matter connectivity at baseline in patients relative to healthy controls. To identify these, probabilistic diffusion MRI tractography was performed and mean probability of connectivity to other brain regions were measured for each atlas region. The colour scheme indicates % reduction in connectivity probability in patients compared to controls and all regions showing 25% or more reduction are coloured.
Table 3.
Local maxima for significant clusters showing a group-by-time interaction
| Anatomical localisation | Maximum Z-score |
x | y | z | Cluster size (voxels) |
|---|---|---|---|---|---|
| Left lateral thalamus | 3.81 | −14 | −14 | 8 | 552 |
| Left posterior thalamus | 3.8 | −22 | −24 | 12 | |
| Left posterior putamen/globus pallidus |
3.46 | −22 | −6 | −6 | |
|
| |||||
| Left inferior frontal gyrus | 3.23 | −42 | 18 | 6 | 196 |
|
| |||||
| Right superior temporal gyrus | 3.58 | 50 | −18 | −10 | 63 |
| Right posterior insula | 3.27 | 40 | −14 | 2 | |
For clusters spanning multiple anatomical regions, more than one local maxima may be provided
We tested whether the differential activation changes with practice for the patients relative to controls could be found in regions in which connectivity was impaired at baseline by white matter damage from subcortical stroke. To do this, we used probabilistic white matter tractography to estimate mean connection probability between an atlas set of cortical and subcortical brain regions across the whole brain for the patients and for the healthy controls. Many of the regions that showed increased activation with performance gains after practice in the patients (Figure 4A) also had reduced connectivity at baseline in the patients relative to the healthy controls (Figure 4D).
Discussion
As expected, we found differences in brain activation during visuomotor tracking between patients and age-matched healthy controls. At baseline, patients had decreased task-associated activation relative to the healthy controls. After 15 days of motor practice, strikingly different patterns of practice-related brain activation changes were found between the two groups, notably including those regions in which white matter connectivity was reduced. These results highlight a novel anatomical overlap between brain regions showing practice-mediated increases in activation after stroke and those in which direct or indirect injury led to impaired function at baseline with reduced white matter connectivity. They suggest a specific role for motor practice in mediating functional recovery of the injured brain after stroke.
Baseline differences between brain activity in patients and controls while performing the visuomotor tracking task
At baseline, patients had reduced activation relative to the healthy controls in cortical regions (primary sensorimotor, premotor and supplementary motor cortices of the lesioned hemisphere) involved in motor control24, 25 and anatomically interconnected26, 27 subcortical areas (ventrolateral and anterior thalamus bilaterally and contralesional cerebellum, lobules V and VI). This finding is consistent with the patterns of brain injury, characterised by varying degrees of interruption of cortico-thalamic-cerebellar motor pathways.
The relative reduction in motor cortical activity in patients relative to healthy controls that we observed should be contrasted with previous reports that have emphasised increased movement-associated activation in patients after a stroke28, 29. The differences may arise from task differences, as the majority of previous studies have used simpler movement tasks than the one used here; a limited adaptive capacity or ‘reserve’ for compensatory activation in the injured brain may be made apparent only with more difficult or complex tasks30. In addition, with a learning task of the sort used here, there may be inter-individual variation in the effects of a fixed amount of short-term task practise on brain functional responses. While some subjects may have reached a performance plateau, others could continue to improve if allowed to practice for longer (as shown in a previous study of long-term practice effects on brain responses31), and so any associated gains in brain functional responses may not be maximal. Future studies with varied practice schedules, larger groups and a range of motor tasks could test these hypotheses directly.
Dependence of baseline task performance on white matter microstructure
We found that loss of white matter integrity in the posterior limbs of the internal capsule (PLIC) explained a substantial proportion of the variance in performance error reductions with baseline short-term task practice for the patients. The PLIC region implicated includes fibre tracts projecting from frontal cortical regions including the premotor cortex32. Previous work has identified premotor regions as important for hand motor control following damage29, 33, 34 and has emphasised the importance of descending motor outputs in both the lesioned and the contra-lesional hemisphere35.
We believe that the association between the behavioural effects of motor practice and white matter microstructure in the contra-lesional PLIC most likely reflects trans-synaptic changes occurring as a consequence of the strokes36, 37. However, it also could reflect differences in microstructure of white matter prior to the stroke; individual differences in performance are associated with variation in FA in task-relevant pathways even in healthy individuals38. While regional correlations between FA and performance were not found for the healthy controls in the current study, the dependence of performance on the microstructure of undamaged white matter regions may be greater in patients as a consequence of their brain injury. This is consistent with clinical observations of worsening motor impairment in a stroke-affected paretic limb following development of a new lesion in the ipsilateral cortex39.
Effects of motor practice on task-related brain activity
Control of grip force demands integration of sensory input and motor output in brain regions including the motor, somatosensory, premotor and parietal cortices40. Implicit learning of a sequence of grip forces is associated with a shift of activation from cortical to subcortical activation in a thalamic-basal ganglia-premotor network6. While previous studies of the effects of motor practice following stroke have provided useful insights into changes specifically in motor cortical areas41, we assessed changes across the brain more widely and were therefore able to provide novel evidence on changes in polymodal areas and subcortical nuclei. With long-term task practice we found a double dissociation between patterns of practice-related changes in brain activity in patients and healthy controls in cortical regions including inferior frontal gyrus, insular and superior temporal regions, as well as in the basal ganglia and thalamus subcortically. In healthy controls, task performance at follow-up was associated with significantly lower activity in these brain regions than performance of the same task at baseline, consistent with the notion of increasing efficiency of motor activity for performance of highly practiced or over-learned movements42. However, opposite trends were seen in patients, who showed an increase in task-related activity in these regions following practice, analogous to observations of increased recruitment of task-relevant areas with short-term motor learning for healthy subjects6, 43-45. The observation of increased brain activation with practice for patients is consistent with previous studies of rehabilitation interventions which have shown that good treatment outcomes are associated with increased activation in brain regions relevant to the task31, 46, 47.
Earlier studies of brain activation with simple movement have emphasised adaptive changes in secondary motor control regions such as the premotor cortex28, 33, 34, 48. A recent, well-designed study of implicit visuomotor learning with a joystick highlighted increasing prefrontal activation in patients post-stroke with learning, in contrast to decreasing activity in healthy controls10. This difference was interpreted in terms of adaptive increases in attentional control with learning for the stroke patients.
Increased activation of brain regions with impaired connectivity in patients after motor practice
We found evidence for reduced structural connectivity not only local to the stroke but also in more distant regions including the contralesional hemisphere. While diffusion studies of fractional anisotropy (FA) have revealed patterns of anterograde (Wallerian) and retrograde white matter tract degeneration following focal damage13-15, 49, such effects are rarely reported in the contralesional hemisphere. However, observations of transhemispheric diaschisis36 support the concept that widespread interconnected regions, even in the contralesional hemisphere, can be functionally and structurally altered after a focal lesion. Elsewhere we have used a subset of the data reported here to characterise a novel, multivariate approach to the analysis of white matter connectivity that suggests a potential for explicitly “network”-based approaches for detecting this kind of distributed neuropathology37.
However, in the current report we have assessed connectivity simply using averaged pairwise connection probabilities generated from a tractography approach and have compared the results of this analysis to fMRI findings. The regions with reduced anatomical connectivity at baseline showed a striking overlap with regions in which functional activity increased (despite general decreases in activation in healthy controls) with task practice in the stroke patients. The between-group differences in longitudinal change of brain activity suggest that motor practice is playing distinct roles in patients versus healthy individuals. In the healthy controls practice is associated with regionally increased functional efficiency42, but in patients practice enables increased functional recruitment of at least some of the regions that are structurally compromised. While we presume that both rely on mechanisms of practice-related brain plasticity, we infer from the different directions of longitudinal activation change that the local circuit adaptations are distinct.
There is considerable overlap between the structurally impaired thalamic, basal ganglia, and superior temporal regions showing practice-related increases in patients (Fig 4) and areas showing reduced activity at baseline (Fig 3). Taken together, these findings further suggest that chronic, degenerative trans-synaptic changes after a stroke contribute to impaired performance but that a behavioural intervention (e.g., motor practice) can increase functional recruitment of affected areas, presumably reflecting local, activity-dependent plasticity.
We recognise clear limitations to our study. First, the numbers of patients tested was relatively small. While observation of significant effects despite modest patient numbers emphasises the magnitude of the detected relationships, other more subtle associations may have been missed. By selecting a relatively homogeneous patient population we attempted to improve our sensitivity to detect effects, but this may limit generalisation to a wider stroke population. More complete evaluation with a much larger patient group could test the relationship between differences in the anatomical distribution of impaired connectivity with different sizes or localisation of stroke and individual differences in practice-related brain activation. Furthermore, we used only a single visuomotor paradigm, although we took care to ensure that this provided objective and quantitative performance measures. Future work should contrast outcomes with practice of a broader range of activities and compare their effects to appropriate control activities, and explore the influence of differences in practice duration and schedules. While longitudinal changes with practice of a single motor task provides a simple model for recovery2, it cannot capture the range of cognitive processes that contribute to outcomes from a clinical rehabilitation intervention.
Conclusions
We found evidence for differences in the dynamics of motor practice-related brain functional plasticity in patients following stroke relative to healthy controls and related these to patterns of structural degeneration. Our observations provide novel, direct evidence that motor practice – a central component of most approaches to neurorehabilitation - promotes functional recovery of brain regions in which structural integrity is directly or indirectly impaired by stroke.
Acknowledgements
We are grateful for technical assistance from Iain Wilson. PMM became a full time employee of GlaxoSmithKline after the design and initial implementation of this experiment. This work was supported by the Stroke Association [grant number TSA2005/07 to PMM and HJB]; Medical Research Council [grant numbers G9409634 to PMM and G0800578SJ to SJ]; GlaxoSmithKline [to PMM], the Wellcome Trust [grant number WT078204MA to HJB]; and the National Institute for Health Research (NIHR) Biomedical Research Centre, Oxford [to HJB and CJS].
References
- 1.Langhorne P, Coupar F, Pollock A. Motor recovery after stroke: a systematic review. Lancet Neurol. 2009;8:741–754. doi: 10.1016/S1474-4422(09)70150-4. [DOI] [PubMed] [Google Scholar]
- 2.Krakauer JW. Motor learning: its relevance to stroke recovery and neurorehabilitation. Curr Opin Neurol. 2006;19:84–90. doi: 10.1097/01.wco.0000200544.29915.cc. [DOI] [PubMed] [Google Scholar]
- 3.Boyd LA, Winstein CJ. Impact of explicit information on implicit motor-sequence learning following middle cerebral artery stroke. Phys Ther. 2003;83:976–989. [PubMed] [Google Scholar]
- 4.Pohl PS, McDowd JM, Filion DL, Richards LG, Stiers W. Implicit learning of a perceptual-motor skill after stroke. Phys Ther. 2001;81:1780–1789. [PubMed] [Google Scholar]
- 5.Orrell AJ, Eves FF, Masters RS, MacMahon KM. Implicit sequence learning processes after unilateral stroke. Neuropsychol Rehabil. 2007;17:335–354. doi: 10.1080/09602010600832788. [DOI] [PubMed] [Google Scholar]
- 6.Floyer-Lea A, Matthews PM. Changing brain networks for visuomotor control with increased movement automaticity. J Neurophysiol. 2004;92:2405–2412. doi: 10.1152/jn.01092.2003. [DOI] [PubMed] [Google Scholar]
- 7.Jueptner M, Frith CD, Brooks DJ, Frackowiak RS, Passingham RE. Anatomy of motor learning. II. Subcortical structures and learning by trial and error. J Neurophysiol. 1997;77:1325–1337. doi: 10.1152/jn.1997.77.3.1325. [DOI] [PubMed] [Google Scholar]
- 8.Toni I, Krams M, Turner R, Passingham RE. The time course of changes during motor sequence learning: a whole-brain fMRI study. Neuroimage. 1998;8:50–61. doi: 10.1006/nimg.1998.0349. [DOI] [PubMed] [Google Scholar]
- 9.Doyon J, Benali H. Reorganization and plasticity in the adult brain during learning of motor skills. Curr Opin Neurobiol. 2005;15:161–167. doi: 10.1016/j.conb.2005.03.004. [DOI] [PubMed] [Google Scholar]
- 10.Meehan SK, Randhawa B, Wessel B, Boyd LA. Implicit sequence-specific motor learning after subcortical stroke is associated with increased prefrontal brain activations: An fMRI Study. Hum Brain Mapp. 2011;32:290–303. doi: 10.1002/hbm.21019. [DOI] [PMC free article] [PubMed] [Google Scholar]
- 11.Dobkin BH. Strategies for stroke rehabilitation. Lancet Neurol. 2004;3:528–536. doi: 10.1016/S1474-4422(04)00851-8. [DOI] [PMC free article] [PubMed] [Google Scholar]
- 12.Hummel F, Celnik P, Giraux P, et al. Effects of non-invasive cortical stimulation on skilled motor function in chronic stroke. Brain. 2005;128:490–499. doi: 10.1093/brain/awh369. [DOI] [PubMed] [Google Scholar]
- 13.Werring DJ, Toosy AT, Clark CA, et al. Diffusion tensor imaging can detect and quantify corticospinal tract degeneration after stroke. J Neurol Neurosurg Psychiatry. 2000;69:269–272. doi: 10.1136/jnnp.69.2.269. [DOI] [PMC free article] [PubMed] [Google Scholar]
- 14.Pierpaoli C, Barnett A, Pajevic S, et al. Water diffusion changes in Wallerian degeneration and their dependence on white matter architecture. Neuroimage. 2001;13:1174–1185. doi: 10.1006/nimg.2001.0765. [DOI] [PubMed] [Google Scholar]
- 15.Liang Z, Zeng J, Liu S, et al. A prospective study of secondary degeneration following subcortical infarction using diffusion tensor imaging. J Neurol Neurosurg Psychiatry. 2007;78:581–586. doi: 10.1136/jnnp.2006.099077. [DOI] [PMC free article] [PubMed] [Google Scholar]
- 16.Tomassini V, Jbabdi S, Kincses ZT, et al. Structural and functional bases for individual differences in motor learning. Hum Brain Mapp. 2010 doi: 10.1002/hbm.21037. epub ahead of print. [DOI] [PMC free article] [PubMed] [Google Scholar]
- 17.Smith SM, Jenkinson M, Woolrich MW, et al. Advances in functional and structural MR image analysis and implementation as FSL. Neuroimage. 2004;23(Suppl 1):S208–219. doi: 10.1016/j.neuroimage.2004.07.051. [DOI] [PubMed] [Google Scholar]
- 18.Smith SM, Jenkinson M, Johansen-Berg H, et al. Tract-based spatial statistics: voxelwise analysis of multi-subject diffusion data. Neuroimage. 2006;31:1487–1505. doi: 10.1016/j.neuroimage.2006.02.024. [DOI] [PubMed] [Google Scholar]
- 19.Behrens TE, Johansen-Berg H, Jbabdi S, Rushworth MF, Woolrich MW. Probabilistic diffusion tractography with multiple fibre orientations: What can we gain? Neuroimage. 2007;34:144–155. doi: 10.1016/j.neuroimage.2006.09.018. [DOI] [PMC free article] [PubMed] [Google Scholar]
- 20.Behrens TEJ, Woolrich MW, Jenkinson M, et al. Characterization and propagation of uncertainty in diffusion-weighted MR imaging. Magn Reson Med. 2003;50:1077–1088. doi: 10.1002/mrm.10609. [DOI] [PubMed] [Google Scholar]
- 21.Beckmann CF, Smith SM. Probabilistic independent component analysis for functional magnetic resonance imaging. IEEE Trans Med Imaging. 2004;23:137–152. doi: 10.1109/TMI.2003.822821. [DOI] [PubMed] [Google Scholar]
- 22.Woolrich MW, Ripley BD, Brady M, Smith SM. Temporal autocorrelation in univariate linear modeling of FMRI data. Neuroimage. 2001;14:1370–1386. doi: 10.1006/nimg.2001.0931. [DOI] [PubMed] [Google Scholar]
- 23.Woolrich M. Robust group analysis using outlier inference. NeuroImage. 2008;41:286–301. doi: 10.1016/j.neuroimage.2008.02.042. [DOI] [PubMed] [Google Scholar]
- 24.Wise SP. The primate premotor cortex: past, present, and preparatory. Annu Rev Neurosci. 1985;8:1–19. doi: 10.1146/annurev.ne.08.030185.000245. [DOI] [PubMed] [Google Scholar]
- 25.Rizzolatti G, Luppino G, Matelli M. The organization of the cortical motor system: new concepts. Electroencephalogr Clin Neurophysiol. 1998;106:283–296. doi: 10.1016/s0013-4694(98)00022-4. [DOI] [PubMed] [Google Scholar]
- 26.Matelli M, Luppino G. Thalamic input to mesial and superior area 6 in the macaque monkey. J Comp Neurol. 1996;372:59–87. doi: 10.1002/(SICI)1096-9861(19960812)372:1<59::AID-CNE6>3.0.CO;2-L. [DOI] [PubMed] [Google Scholar]
- 27.Asanuma C, Thach WT, Jones EG. Distribution of cerebellar terminations and their relation to other afferent terminations in the ventral lateral thalamic region of the monkey. Brain Res. 1983;286:237–265. doi: 10.1016/0165-0173(83)90015-2. [DOI] [PubMed] [Google Scholar]
- 28.Ward NS, Brown MM, Thompson AJ, Frackowiak RS. Neural correlates of outcome after stroke: a cross-sectional fMRI study. Brain. 2003;126:1430–1448. doi: 10.1093/brain/awg145. [DOI] [PMC free article] [PubMed] [Google Scholar]
- 29.Seitz RJ, Hoflich P, Binkofski F, Tellmann L, Herzog H, Freund HJ. Role of the premotor cortex in recovery from middle cerebral artery infarction. Arch Neurol. 1998;55:1081–1088. doi: 10.1001/archneur.55.8.1081. [DOI] [PubMed] [Google Scholar]
- 30.Cader S, Cifelli A, Abu-Omar Y, Palace J, Matthews PM. Reduced brain functional reserve and altered functional connectivity in patients with multiple sclerosis. Brain. 2006;129:527–537. doi: 10.1093/brain/awh670. [DOI] [PubMed] [Google Scholar]
- 31.Dong Y, Winstein CJ, Albistegui-DuBois R, Dobkin BH. Evolution of FMRI activation in the perilesional primary motor cortex and cerebellum with rehabilitation training-related motor gains after stroke: a pilot study. Neurorehabil Neural Repair. 2007;21:412–428. doi: 10.1177/1545968306298598. [DOI] [PMC free article] [PubMed] [Google Scholar]
- 32.Zarei M, Johansen-Berg H, Jenkinson M, Ciccarelli O, Thompson AJ, Matthews PM. Two-dimensional population map of cortical connections in the human internal capsule. J Magn Reson Imaging. 2007;25:48–54. doi: 10.1002/jmri.20810. [DOI] [PMC free article] [PubMed] [Google Scholar]
- 33.Johansen-Berg H, Rushworth MF, Bogdanovic MD, Kischka U, Wimalaratna S, Matthews PM. The role of ipsilateral premotor cortex in hand movement after stroke. Proc Natl Acad Sci U S A. 2002;99:14518–14523. doi: 10.1073/pnas.222536799. [DOI] [PMC free article] [PubMed] [Google Scholar]
- 34.O’Shea J, Johansen-Berg H, Trief D, Gobel S, Rushworth MF. Functionally specific reorganization in human premotor cortex. Neuron. 2007;54:479–490. doi: 10.1016/j.neuron.2007.04.021. [DOI] [PubMed] [Google Scholar]
- 35.Schaechter JD, Fricker ZP, Perdue KL, et al. Microstructural status of ipsilesional and contralesional corticospinal tract correlates with motor skill in chronic stroke patients. Hum Brain Mapp. 2009;30:3461–3474. doi: 10.1002/hbm.20770. [DOI] [PMC free article] [PubMed] [Google Scholar]
- 36.Andrews RJ. Transhemispheric diaschisis. A review and comment. Stroke. 1991;22:943–949. doi: 10.1161/01.str.22.7.943. [DOI] [PubMed] [Google Scholar]
- 37.Crofts JJ, Higham DJ, Bosnell R, et al. Network analysis detects changes in the contralesional hemisphere following stroke. NeuroImage. 2011;54:161–169. doi: 10.1016/j.neuroimage.2010.08.032. [DOI] [PMC free article] [PubMed] [Google Scholar]
- 38.Johansen-Berg H. Behavioural relevance of variation in white matter microstructure. Curr Opin Neurol. 2010;23:351–358. doi: 10.1097/WCO.0b013e32833b7631. [DOI] [PubMed] [Google Scholar]
- 39.Fisher CM. Concerning the mechanism of recovery in stroke hemiplegia. Can J Neurol Sci. 1992;19:57–63. [PubMed] [Google Scholar]
- 40.Sterr A, Shen S, Kranczioch C, Szameitat AJ, Hou W, Sorger B. fMRI effects of task demand and feedback accuracy on grip force tracking. Neurosci Lett. 2009;457:61–65. doi: 10.1016/j.neulet.2009.04.013. [DOI] [PubMed] [Google Scholar]
- 41.Carey JR, Kimberley TJ, Lewis SM, et al. Analysis of fMRI and finger tracking training in subjects with chronic stroke. Brain. 2002;125:773–788. doi: 10.1093/brain/awf091. [DOI] [PubMed] [Google Scholar]
- 42.Wu T, Kansaku K, Hallett M. How self-initiated memorized movements become automatic: a functional MRI study. J Neurophysiol. 2004;91:1690–1698. doi: 10.1152/jn.01052.2003. [DOI] [PubMed] [Google Scholar]
- 43.Doyon J, Song AW, Karni A, Lalonde F, Adams MM, Ungerleider LG. Experience-dependent changes in cerebellar contributions to motor sequence learning. Proc Natl Acad Sci U S A. 2002;99:1017–1022. doi: 10.1073/pnas.022615199. [DOI] [PMC free article] [PubMed] [Google Scholar]
- 44.Lehericy S, Benali H, Van de Moortele PF, et al. Distinct basal ganglia territories are engaged in early and advanced motor sequence learning. Proc Natl Acad Sci U S A. 2005;102:12566–12571. doi: 10.1073/pnas.0502762102. [DOI] [PMC free article] [PubMed] [Google Scholar]
- 45.Floyer-Lea A, Matthews PM. Distinguishable brain activation networks for short- and long-term motor skill learning. J Neurophysiol. 2005;94:512–518. doi: 10.1152/jn.00717.2004. [DOI] [PubMed] [Google Scholar]
- 46.Johansen-Berg H, Dawes H, Guy C, Smith SM, Wade DT, Matthews PM. Correlation between motor improvements and altered fMRI activity after rehabilitative therapy. Brain. 2002;125:2731–2742. doi: 10.1093/brain/awf282. [DOI] [PubMed] [Google Scholar]
- 47.Liepert J, Bauder H, Wolfgang HR, Miltner WH, Taub E, Weiller C. Treatment-induced cortical reorganization after stroke in humans. Stroke. 2000;31:1210–1216. doi: 10.1161/01.str.31.6.1210. [DOI] [PubMed] [Google Scholar]
- 48.Cramer SC, Nelles G, Benson RR, et al. A functional MRI study of subjects recovered from hemiparetic stroke. Stroke. 1997;28:2518–2527. doi: 10.1161/01.str.28.12.2518. [DOI] [PubMed] [Google Scholar]
- 49.Thomalla G, Glauche V, Koch MA, Beaulieu C, Weiller C, Rother J. Diffusion tensor imaging detects early Wallerian degeneration of the pyramidal tract after ischemic stroke. NeuroImage. 2004;22:1767–1774. doi: 10.1016/j.neuroimage.2004.03.041. [DOI] [PubMed] [Google Scholar]
- 50.Fugl-Meyer AR, Jaasko L, Leyman I, Olsson S, Steglind S. The post-stroke hemiplegic patient. Scand J Rehabil Med. 1975;7:13–31. [PubMed] [Google Scholar]