

Abstract
While the functional correlates of spelling impairment have been rarely investigated, to our knowledge no study exists regarding the structural characteristics of spelling impairment and potential changes with interventions. Using diffusion tensor imaging at 3.0 T, we here therefore sought to investigate (a) differences between children with poor spelling abilities (training group and waiting group) and controls, and (b) the effects of a morpheme- based spelling intervention in children with poor spelling abilities on DTI parameters. A baseline comparison of white matter indices revealed significant differences between controls and spelling-impaired children, mainly located in the right hemisphere (superior corona radiata (SCR), posterior limb of internal capsule, superior longitudinal fasciculus). After 5 weeks of training, spelling ability improved in the training group, along with increases in fractional anisotropy and decreases of radial diffusivity in the right hemisphere compared to controls. In addition, significantly higher decreases of mean diffusivity in the right SCR for the spelling-impaired training group compared to the waiting group were observed. Our results suggest that spelling impairment is associated with differences in white-matter integrity in the right hemisphere. We also provide first indications that white matter changes occur during successful training, but this needs to be more specifically addressed in future research.
Keywords: Spelling impairment, DTI, Intervention, White matter
Introduction
Up to 16% of all children and adolescents may be affected by reading and spelling difficulties, associated with greater risk of school anxiety, unemployment, and multiple emotional and behavioral difficulties (Klicpera et al. 2007; Schulte-Körne and Remschmidt 2003). A severe and well-known form of reading difficulties is dyslexia. Current neuroimaging studies revealed that dyslexia is associated with decreased activation in parieto-temporal and occipito-temporal brain regions of the left hemisphere (Kronbichler et al. 2008; Shaywitz et al. 2004), along with increased activation in frontal or right hemispheric regions (Richlan et al. 2009; Maisog et al. 2008; Shaywitz et al. 2006). Intervention studies suggested that these activation patterns may be “normalized” in regions associated with reading and spelling in individuals with dyslexia or reading impairment (Aylward et al. 2003; Eden et al. 2004; Meyler et al. 2008; Richards et al. 2006; Shaywitz et al. 2004; Simos et al. 2002, 2006; Temple et al. 2003). Previously, we observed a tendency of functional normalization of brain activation patterns after an intense spelling intervention (Gebauer et al. submitted) in children with spelling impairment. As the neural signature of reading and spelling impairment may manifest not only functionally but also at a microstructural level, we used diffusion tensor imaging (DTI) to augment our understanding of neural plasticity related to intervention in this context.
Recent DTI studies reported regional white matter differences between individuals with spelling and reading impairment, and non-impaired controls in tracts related to reading, specifically bilateral in the posterior limb of the internal capsule (PLIC) (e.g., Beaulieu et al. 2005; Klingberg et al. 2000), the superior longitudinal fasciculus (SLF) (e.g., Carter et al. 2009; Hoeft et al. 2011; Rimrodt et al. 2010; Steinbrink et al. 2008), superior corona radiata (SCR) (e.g., Deutsch et al. 2005), inferior longitudinal fasciculus (ILF) (e.g., Rollins et al. 2009; Steinbrink et al. 2008), corpus callosum (Ben-Shachar et al. 2007; Dougherty et al. 2007) and anterior corona radiata (ACR) (e.g., Beaulieu et al. 2005; Niogi and McCandliss 2006).
Several studies found a correlation between white matter integrity (mostly assessed by fractional anisotropy, FA) and reading ability in left parietotemporal areas. Correlations between reading ability and fibers with inferior–superior orientation in the PLIC (Beaulieu et al. 2005) and the SCR (Deutsch et al. 2005; Niogi and McCandliss 2006) were also found. Furthermore, correlations with fibers with anterior-posterior orientation in left parietotemporal regions (related to the external capsule and arcuate fasciculus; Klingberg et al. 2000) were observed. Hoeft et al. (2011) reported that single-word reading improvement in dyslexics over 2.5 years correlated positively with increased white matter integrity in the right SLF and greater activation in the right inferior frontal gyrus (IFG).
To our knowledge, so far only two DTI studies included behavioral measures of spelling. Deutsch et al. (2005) found positive correlations between measurements of reading (r = 0.62) and spelling (r = 0.66) with left parietotemporal white matter in a pre-defined volume of interest (VOI), suggesting more preserved white matter integrity in this region to be related to improved processing efficiency. Steinbrink et al. (2008) investigated German dyslexic adults and found decreased FA in bilateral fronto-temporal and left temporoparietal white matter regions (ILF and SLF), probably indicating less-efficient communication in dyslexics. No significant correlations with spelling were reported, but a significant correlation was found between FA in a pre-defined region of interest (ROI) and speed of pseudo-word reading for dyslexic children (r = 0.85/0.87; fronto-temporal bilateral, left parieto-temporal) and normal controls (r = 0.82; left frontal). No significant correlations with mean diffusivity (MD) were observed.
Learning new skills, be it motor or cognitive in nature, causes changes of brain function (e.g., Poldrack et al. 1998; Raichle et al. 1994; Westerberg and Klingberg 2007) and also entails structural changes in white and grey matter (e.g., Bengtsson et al. 2005; Draganski et al. 2004; Scholz et al. 2009). Neuroimaging techniques provide new possibilities to investigate effects of intervention and therapies of motor or cognitive impairments. The concept of neural plasticity is crucial in various fields ranging from developmental language acquisition to stroke recovery, providing new insight and hope for affected people.
Only few studies investigated changes in white-matter connectivity due to instruction (e.g., Scholz et al. 2009). To date only one study probed white matter changes due to intervention in poor readers (Keller and Just 2009). The authors found that 100 h of reading instruction over 6 months resulted in increased FA and decreased radial diffusivity in the left anterior centrum semiovale in poor readers, a pattern that could be indicative of increased myelination. Furthermore, FA increase correlated with improvement in phonological decoding ability (partial r = 0.23).
Functional correlates of spelling impairment have rarely been investigated (e.g., Richards et al. 2009), and to our knowledge, no study about the structural characteristics of spelling impairment and related interventions exist so far. Therefore, we here aimed to investigate the effects of a morpheme-based spelling intervention on brain structure in children with poor spelling abilities. We hypothesized that (a) children with poor spelling abilities show differences in brain structure prior to the intervention compared to controls, consistent with observations in reading-impaired individuals (e.g., Beaulieu et al. 2005; Klingberg et al. 2000; Rimrodt et al. 2010; Rollins et al. 2009; Steinbrink et al. 2008). Furthermore, we investigated whether (b) a spelling intervention would alter microstructural white matter changes as measured by white matter indices obtained from DTI.
Methods
Participants
As part of a functional MRI study (Gebauer et al. submitted), which was designed to investigate the functional effects of a spelling intervention on spelling impaired children, we also repetitively obtained DTI data that allow addressing the central research question on microstructural changes in such a setting. Diffusion tensor imaging data of 34 German-speaking children aged between 9 and 16 years were acquired. From this cohort, data of six children had to be excluded due to movement or scanner artifacts, rendering a final sample of 28 children (16 males), whose age ranged from 10 to 16 years (M = 11.96, SD = 1.77; see Table 1). All participants were healthy, right-handed and had normal or corrected to normal vision. The Ethics Committee of the Medical University Graz, Austria approved the study. All participants and their parents gave written informed consent.
Table 1.
Descriptive statistics of age, non-verbal intelligence, reading- and spelling skills for training group (TG), waiting group (WG) and control group (CG); means and standard deviations (in brackets)
| TG | WG | CG | p | |
|---|---|---|---|---|
| Sex | 10 (7 males) | 9 (6 males) | 9 (3 males) | |
| Age (years) | 11.5 (0.71) | 12.1 (2.03) | 12.3 (2.35) | 0.58 |
| Intelligence—Raven | 36.7 (7.7) | 38.0 (9.82) | 44.3 (5.29) | 0.10 |
| Pre-intervention | ||||
| Reading speed | 91.4 (14.27) | 99.0 (10.77) | 117.89 (12.71) | 0.000 |
| Reading comprehension | 41.52 (24.57) | 54.19 (21.98) | 60.86 (7.98) | 0.005 |
| Spelling skills—HSP | 20.98 (11.37) | 21.64 (12.34) | 78.1 (15.98) | 0.000 |
| Post-intervention | ||||
| Reading speed | 102.6 (13.88) | 103.22 (10.51) | ||
| Reading comprehension | 57.77 (27.91) | 53.68 (20.80) | ||
| Spelling skills—HSP | 42.33 (23.03) | 23.73 (14.11) | ||
Age (F (2,25) = 0.55; p = 0.58; η p 2 = 0.04), non-verbal intelligence: Raven raw scores (F (2,25) = 2.52; p = 0.10; η p 2 = 0.17)
Pre-intervention, reading skills: SLS reading quotient (F (2,25) = 10.71; p < 0.001; η p 2 = 0.46), reading comprehension: 6.62; p < 0.05; η p 2 = 0.35), spelling skills: (F (2,25) = 55.71; p < 0.001; η p 2 = 0.82) The effect of the intervention was investigated in a pre-/post-test design. We formed and investigated three groups: (1) Ten children with below-average spelling abilities were assigned to the “training-group” (TG), (2) another nine children with poor spelling abilities were assigned to the “waiting-group” (WG, receiving the training after the post-test), and (3) a control group (CG) of nine children with average spelling abilities. Spelling ability was determined by standardized psychometric tests during a pre-experimental screening, as specified below.
The groups did not differ significantly (p > 0.05) with respect to age and non-verbal intelligence, but controls scored considerably higher in reading and spelling (p < 0.05; Table 1). Specific post hoc comparisons by means of the Tukey HSD test revealed that controls had significantly higher test scores than both spelling-impaired groups (p < 0.05), while the TG and WG were not significantly different (Table 1).
Psychometric tests
In the pre-experimental screening, participants underwent standardized tests for the assessment of reading and spelling abilities, along with relevant socio-demographic data such as age, sex, native language, and school year. In the “Hamburger-Schreibprobe” (HSP; May et al. 2000), a standardized spelling test for children from the first to the ninth grade, words and sentences are dictated by the experimenter and have to be written next to corresponding pictures that illustrate them. This test takes about 15 min and we applied the version for fourth/fifth graders and fifth to ninth graders. The HSP provides measures for the number of correctly spelled words and the number of grapheme-related mistakes. The latter was used in this study as it is more precisely. The “Salzburger-Lese-Screening” (SLS; Mayringer and Wimmer 2003, 2005) measures reading speed and basic reading ability (automaticity, accuracy). We used the SLS 1–4 for children up to the fourth grade, and the SLS 5–8 was applied for older children, parallel versions exist for both. In the SLS, children have to decide whether the content of a presented sentence is correct or not. Testing time is limited to 3 min. In addition, we also measured reading comprehension (i.e., comprehension of words, sentences, and text) by means of a standardized German-speaking test (ELFE 1–6; Lenhard and Schneider 2006). Furthermore, non-verbal intelligence was measured using the standard progressive matrices (SPM) by Raven (1960).
Intervention
The intervention was a computer-aided morpheme-based spelling training (Morpheus; Kargl and Purgstaller 2010), which has been approved as an evidence-based intervention for individuals with reading and spelling deficits by the Federal Ministry of Austria (http://www.schulpsychologie.at/lernen-leistung/lese-rechtschreibschwaeche/).
Morpheus consists of computerized tutorials, a book of exercises, and morpheme-based games to facilitate the consolidation of the strategy. The intervention included daily handwritten and computer homework along with instructor-guided courses (once a week, lasting approximately 2 h) over a period of 5 weeks. These tutorials on the computer included 12 different playful exercises dealing with morphemes (e.g., recognizing and matching word families, morphological clozes, and finding suffixes and prefixes). During the tutorials, achieved scores were displayed on the computer screen. Participants could only reach the next difficulty level of the same exercise when they had solved at least 75% of the given problems correctly. The automatically saved score of every tutorial served as basis for assessing training progress. Displaying the achieved performance increased the training motivation of the participants.
In general, the training material of Morpheus consists of the most frequent morphemes of the German language and contains different levels of difficulty. The words used for the training were taken from an empirically based collection of words (German basic vocabulary for fourth graders; Augst 1989). Morpheus has been constructed on the basis of the following principles: simplicity, relief due to morpheme segmentation, rule-governed repetition, playfulness, avoidance of mistakes, individuality, productivity, and practicing handwriting.
Every word is built by different parts, which follow particular spellings (e.g., unfriendly = prefix (un), suffix (ly), root (friend)). Therefore, the spelling of the German verb “verfahren” can be derived by two rules: the prefix (ver) is always written with (v), the root (fahr) always with an “h”. Children do not need to remember the spelling of every single word, but only to memorize the spelling of their component parts. Furthermore, morphosemantic information can support the development of a meaning-oriented decoding strategy, e.g., the correct spelling of the noun “motor-rad” (motor-bike) can be derived by the meaning (May et al. 2000). In addition, this strategy seems to be easy to apply as only “100 of the most frequent morphemes cover 70% of all written material” (Scheerer-Neumann 1979).
Magnetic resonance imaging (MRI) data acquisition
Imaging was performed on a 3.0 T Trio Tim scanner (Siemens Medical Systems, Erlangen, Germany) using a 12-channel head coil. To minimize head movement, subjects’ heads were stabilized with foam cushions. Besides high-resolution 3D-T1 MPRAGE (1 mm isotropic) structural scans (TR = 1,900 ms, TE = 2.2 ms), single shot EPI DTI data including four averages (1.9 mm × 1.9 mm × 2.5 mm acquisition voxel size, TR = 6,700 ms, TE = 95 ms, matrix 128 mm × 128 mm; FOV = 250 mm, flip angle: 90°; b value = 1,000 s mm−2, 4 × B = 0 images, 12 directions) were obtained. Scan time was 10 min for the T1-MPRAGE scan and 7 min for the DTI acquisition. Structural brain scans were reviewed by an MRI expert with more than 10 years of experience in neuroimaging and did not show morphological abnormalities.
Diffusion tensor imaging (DTI) analysis
Diffusion tensor imaging analysis was performed using FDT (fMRIB’s Diffusion Toolbox, Version v 2.0, part of fMRIB’s Software Library) and TBSS (Tract-Based Spatial Statistics, Version v 1.2 part of fMRIB’s Software Library).
Raw images were pre-processed using Eddy Current correction. A brain mask was created using BET (Brain Extraction Tool, Version 2.1). Maps for fractional anisotropy (FA), mean diffusivity (MD), axial diffusivity (λ1, along the axis of the fiber) and radial diffusivity [(λ2 + λ3)/2] were generated, to increase interpretability of our findings.
Subsequently voxel-wise statistical analysis of FA data was carried out using TBSS. As standard templates were not appropriate for the smaller head and brain size of children, we generated a study-specific template by registering the FA images to the mean_FA of the group (created with the FMRIB58_FA image as the target). The FA skeleton was thresholded at 0.20 to include major white matter pathways but avoid peripheral tracts (vulnerable to inter-subject variability). Each subject’s FA map was then projected onto the mean skeleton. Voxel-wise cross-subject statistics (p < 0.05) by threshold-free cluster enhancement (TFCE), avoiding use of an arbitrary threshold for the initial cluster-formation was applied. Threshold-free cluster enhancement represents a recently proposed method to enhance cluster-like structures in an image (e.g., a z-statistic activation image from an FMRI analysis) without having to define an initial cluster-forming threshold or carry out a large amount of data smoothing (Smith and Nichols 2009). We used non-parametric testing as implemented in “randomise” (5,000 permutations), for calculating group contrasts. “Randomise” is a permutation method, which is used for inference (thresholding) on statistic maps when the null distribution is not known (Nichols and Holmes 2002).
The anatomical location of significant clusters was determined by reference to the fibre tract-based atlas of human white matter (JHU ICBM-DTI-81 White-Matter Labels, JHU White-Matter Tractography Atlas, Juelich Histological Atlas), implemented in FSL. Mean diffusivity, radial and axial diffusivity were compared using TBSS in an analogous fashion.
Based on theoretical background we defined ten regions of interest (ROI’s), including the right and left PLIC (e.g., Beaulieu et al. 2005; Klingberg et al. 2000), SCR (e.g., Beaulieu et al. 2005; Klingberg et al. 2000), SLF (e.g., Carter et al. 2009; Hoeft et al. 2011; Steinbrink et al. 2008), inferior longitudinal and occipito-frontal fasciculus (Rollins et al. 2009; Steinbrink et al. 2008) and ACR (e.g., Beaulieu et al. 2005; Niogi and McCandliss 2006).
Results
The two spelling impaired groups (training group—TG, waiting group—WG) did not significantly differ with respect to any behavioral measure. Participants of the control group (CG) scored significantly higher than both spelling-impaired groups in reading and spelling abilities (see further “Participants” and Table 1). Figure 1 represents a schematic overview of the statistical comparisons done regarding the significance of results.
Fig. 1.
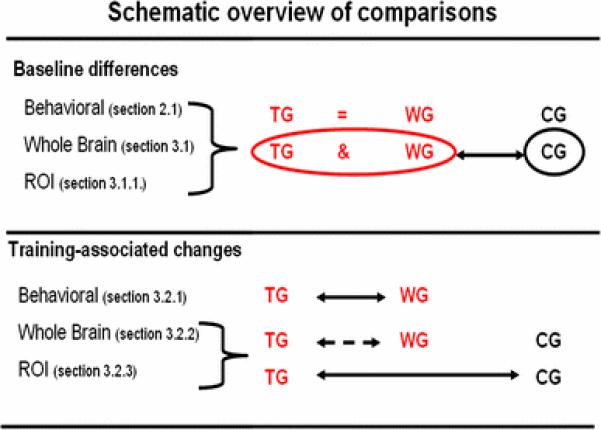
Schematic overview of statistical comparisons and significance of results. Black arrows indicate significant differences and dashed lines indicate a tendency of difference. ROI results of region of interest analyses, TG training group, WG waiting group, CG controls
Whole-brain baseline differences between groups
We tested for differences in white-matter integrity between the three groups before the intervention. In whole brain analyses, there were no significant differences between the training (TG) and the waiting group (WG) concerning any of the white matter indices (TFCE-corrected, p < 0.05). Therefore, we pooled the TG and WG to increase statistical power.
Controls had higher FA values compared to the spelling-impaired sample in the bilateral SCR, bilateral corpus callosum (CC), right inferior longitudinal fasciculus and inferior fronto-occipital fasciculus (ILF, IFO), right PLIC, external capsule and right anterior thalamic radiation (TFCE-corrected, p < 0.05, Fig. 2; for local maxima see further Table 4 in the appendix).
Fig. 2.
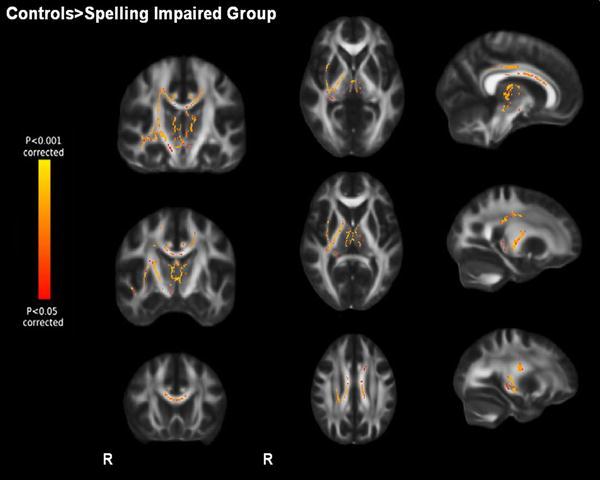
Baseline differences of fractional anisotropy (FA). p < 0.05 corrected, displaying higher FA in controls compared to the spelling-impaired groups. Display of coronal view (y) = −20, −10, 20; sagittal view (x) = 9, 24, 29; transversal view (z) = 30, 6, 0. R right
Higher MD for the spelling-impaired sample compared to controls was observed in the bilateral SCR and CC, right SLF, PLIC, IFO and anterior thalamic radiation (TFCE-corrected, p < 0.05, Fig. 3; for local maxima see further Table 4 in the appendix).
Fig. 3.
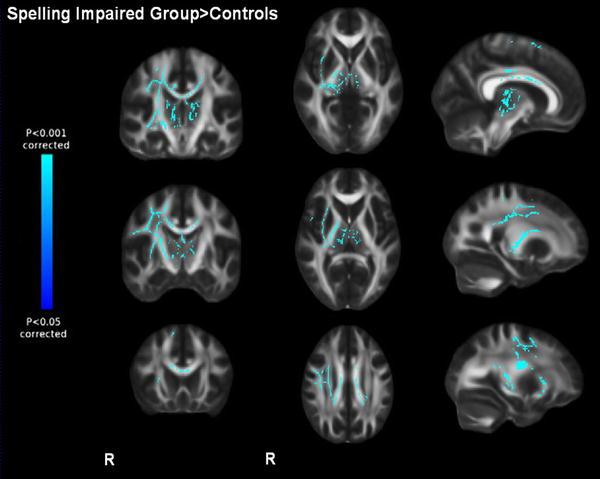
Baseline differences in mean diffusivity. p < 0.05 corrected, displaying higher mean diffusivity in the spelling-impaired groups compared to controls. Display of coronal view (y) = −20, −10, 20; sagittal view (x) = 9, 24, 29; transversal view (z) = 30, 6, 0. R right
Higher radial diffusivity for the spelling-impaired sample compared to controls was observed in the right PLIC, IFO, ILF, SLF, bilateral body of CC, anterior thalamic radiation and SCR. (TFCE-corrected, p < 0.05; for local maxima see further Table 4 in the appendix). No differences for axial diffusivity were observed.
Region of interest (ROI) analyses: baseline differences between groups
Region of interest analyses revealed differences between controls and the two spelling-impaired groups in the bilateral PLIC, right SCR and right SLF.
For the bilateral PLIC, higher FA was found in controls, compared to the spelling-impaired groups. Accordingly, lower radial diffusivity for controls compared to the two other groups was found. Lower MD and axial diffusivity for controls in the right PLIC was observed. For the right SCR, controls showed higher FA, lower MD, axial and radial diffusivity compared to the spelling-impaired groups. For the right SLF lower radial diffusivity was found for controls compared to the spelling impaired samples. For further information see Table 5 in the appendix. Correlations with behavioural measures at baseline revealed correlations between spelling skills and white-matter indices in the right PLIC, SCR and left ILF/IFO for the entire sample (see Table 2).
Table 2.
Baseline correlations: significant correlations between white matter indices and spelling skills for the entire sample
| FA | MD | Axial diffusivity | Radial diffusivity | |
|---|---|---|---|---|
| Right PLIC | 0.38 | −0.58 | −0.45 | −0.50 |
| Right SCR | −0.40 | −0.40 | ||
| Left IFO/ILF | 0.43 |
Pearson correlation coefficients are presented, ranging from −1 to +1 (positive values indicate positive correlations)
PLIC posterior limb of internal capsule, SCR superior corona radiata, IFO inferior occipito-frontal fasciculus, ILF inferior longitudinal fasciculus, SLF superior longitudinal fasciculus, ACR anterior corona radiata
Training-associated changes
Behavioral results: comparison of training group (TG) and waiting group (WG)
In order to investigate behavioral effects of the intervention, we computed a 2 × 2 ANOVA for repeated measures on the HSP spelling scores considering TIME (pre- and post-test) as within subjects’ variable and GROUP (TG and WG) as between subjects’ variable. We observed a significant main effect of TIME (F (1,17) = 17.78, p < 0.05, η p 2 = 0.50), indicating higher scores in the post- than in the pre-test, but as it was evident by a significant interaction between TIME and GROUP (F (1,17) = 11.33, p < 0.05, η p 2 = 0.40), only the TG showed performance increases in spelling (see Fig. 4). The mean spelling score of the TG (42.33) after intervention reached the range of average spelling ability (between 40 and 60; see Table 1).
Fig. 4.
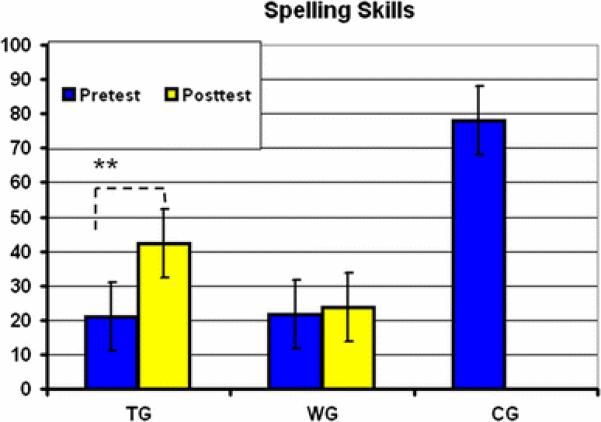
Behavioral effects of the training: Improvement of spelling skills (percentile rankings of the HSP). For descriptive reasons, the pre-test scores of the control group (CG) are also presented. TG training group, WG waiting group, CG controls
With respect to reading, a 2 × 2 ANOVA for repeated measures on the SLS reading scores (indicative of reading speed) revealed a significant main effect of TIME (F (1,17) = 11.31, p < 0.05, η p 2 = 0.40) indicating generally higher scores in the post- than in the pre-test. No significant interaction with experimental group emerged. Also, for reading comprehension (ELFE PR), the ANOVA yielded a significant main effect of TIME (F (1,17) = 4.56, p < 0.05, η p 2 = 0.21), indicating generally higher scores in the post- than in the pre-test (see Table 1).
Changes in white matter integrity associated with training
Using an F-test, we found significant differences in FA changes across the groups in the right PLIC (F-stats; TFCE-corrected, p < 0.05). Subsequent post hoc comparison revealed higher increases in FA in the TG compared to controls in the right hemisphere (PLIC, SLF, SCR, IFO/ILF, CC). Also the WG showed a small cluster comprising seven voxels with stronger increase of FA compared to controls in the right PLIC (Fig. 5; Table 6 in the appendix). No significant differences between TG and WG were observed. We extracted values of significant voxels to determine the direction of changes in white matter integrity.
Fig. 5.
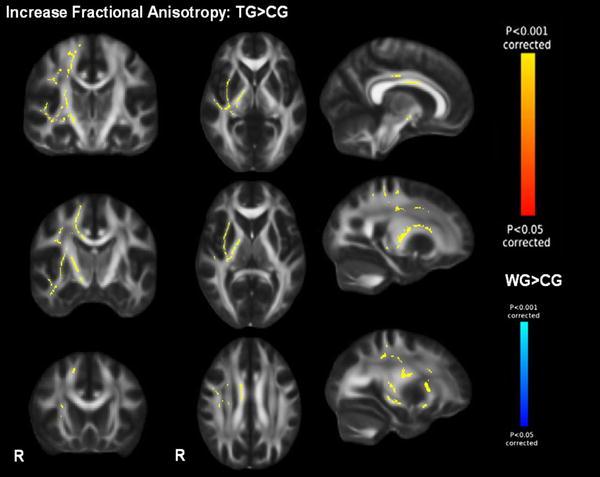
Increase of fractional anisotropy (FA). p < 0.05 corrected, displaying higher FA increase in the training group compared to controls (TG > CG) and Blue higher FA increase in the waiting group compared to controls (WG > CG). Display of coronal view (y) = −20, −10, 20; sagittal view (x) = 9, 24, 29; transversal view (z) = 30, 6, 0. R right
Differences in MD change were observed in the right SCR, SLF, ALIC, IFO and anterior thalamic radiation across the groups (F-stats; TFCE-corrected, p < 0.05). Significantly higher MD decreases in the TG compared to controls were found in the right SCR, SLF, IFO and PLIC (for local maxima see Table 6 in the appendix). No difference across and between all groups in axial diffusivity change was observed.
Differences in radial diffusivity changes across groups in the right PLIC, SCR, SLF, IFO, and CC were found (F-stats; TFCE-corrected, p < 0.05). Post hoc comparison revealed higher radial diffusivity decreases for the TG compared to controls in the right SLF, SCR, PLIC, ILF, IFO, thalamic radiation and CC (for local maxima see Table 6 in the appendix).
Region of interest analyses: changes in white matter integrity
Region of interest analyses revealed significant differences in white matter changes between groups in the right (PLIC, SCR, SLF, and ACR) and left hemisphere (PLIC, SCR).
For the right PLIC, FA increases were significantly higher in the TG compared to controls (p < 0.001). Fractional anisotropy increases were higher in the TG compared to the WG, but this did not reach significance (see Table 3). A significant MD decrease in the TG compared to controls was observed. Furthermore, controls yielded significantly lower decreases in radial diffusivity compared to the two spelling-impaired groups.
Table 3.
Region of interest analyses for training effect
| TG | WG | CG | p | |
|---|---|---|---|---|
| Right hemisphere | ||||
| Right PLIC | ||||
| FA | 0.0299 (0.0171) | 0.0265 (0.0136) | 0.0030 (0.0095) | 0.001 |
| MD | −0.00004 (0.00001) |
−0.00003 (0.00002) |
−0.00001 (0.00002) |
0.006 |
| Radial D. (mm2 s−1) |
−0.00005 (0.00002) |
−0.00003 (0.00002) |
−0.00001 (0.00002) |
0.000 |
| Right SCR | ||||
| FA | 0.0120 (0.0123) | 0.0095 (0.0117) | −0.0024 (0.0050) | 0.01 |
| MD | −0.000024 (0.000012) |
−0.000011 (0.000011) |
−0.000002 (0.000007) |
0.001 |
| Axial D. (mm2 s−1) |
−0.000025 (0.000012) |
−0.000010 (0.000015) |
−0.000007 (0.000017) |
0.01 |
| Radial D. (mm2 s−1) |
−0.000024 (0.000013) |
−0.000012 (0.000012) |
−0.000001 (0.000006) |
0.001 |
| Right SLF | ||||
| Radial D. (mm2 s−1) |
−0.00003 (0.00001) |
−0.00001 (0.00002) |
−0.00001 (0.00001) |
0.03 |
| Right ACR | ||||
| FA | 0.0021 (0.0072) | 0.0007 (0.0112) | −0.0075 (0.0022) | 0.03 |
| Left hemisphere | ||||
| Left PLIC | ||||
| FA | 0.0189 (0.0104) | 0.0027 (0.0142) | −0.0030 (0.0124) | 0.002 |
| Radial D. (mm2 s−1) |
−0.000022 (0.00002) |
−0.000003 (0.00002) |
−0.000002 (0.00001) |
0.02 |
| Left SCR | ||||
| Radial D. (mm2 s−1) |
−0.000006 (0.000002) |
−0.000002 (0.000009) |
0.0000003 (0.000005) |
0.01 |
Mean changes of FA, MD, axial and radial diffusivity indices for the training group (TG), waiting group (WG) and controls (CG), axial diffusivity and radial diffusivity values are expressed in mm2 s−1
R Plic (FA: F (2,25) = 10.23, p < 0.001, η2 = 0.45; MD: F (2,25) = 6.39, p < 0.05, η2 = 0.34; Radial D.: F (2,25) = 12.04, p < 0.001, η2 = 0.49)
R SCR (FA: F (2,25) = 5.20, p < 0.05; η2 = 0.30, MD: F (2,25) = 9.6, p < 0.001, η2 = 0.43; Axial D.: F (2,25) = 5.62, p < 0.05, η2 = 0.31; Radial D.: F (2,25) = 10.27, p < 0.001, η2 = 0.45)
R SLF (radial D.: F (2,25) = 3.71, p < 0.05, η2 = 0.23)
RACR (FA: F (2,25) = 4.16, p < 0.05, η2 = 0.25)
L Plic (FA: F (2,25) = 8.08, p < 0.05, η2 = 0.39, Radial D.: F (2,25) = 4.38, p < 0.05, η2 = 0.26)
L SCR (Radial D.: F (2,25) = 5.11, p < 0.05; η2 = 0.29)
D. diffusivity, PLIC posterior limb of internal capsule, SCR superior corona radiata, SLF superior longidutinal fasciculus, ACR anterior corona radiata
For the right SCR higher FA increases were observed for the TG compared to controls. Significantly higher MD decreases and decreases of axial diffusivity in the right SCR for the TG compared to controls (p < 0.001) and WG (p < 0.05) were observed. Higher decrease of radial diffusivity was observed in the TG compared to controls.
For the right SLF, decreases in radial diffusivity were significantly higher in the TG compared to controls. For the right ACR, a higher decrease of radial diffusivity in the TG compared to controls was found (see Table 3, Fig. 6).
Fractional anisotropy changes in the left PLIC were greater in the TG compared to the two other groups. Furthermore, significantly higher decrease of radial diffusivity in the TG compared to controls was found. Radial diffusivity in the left SCR was significantly decreased in the TG compared to the two other groups (see Table 3).
Discussion
Studies investigating neural correlates of spelling impairment are sparse (Richards et al. 2009). Here, we first report findings of differences in white matter integrity in spelling impaired children, as assessed by DTI. Remarkably, differences were primarily observed in the right hemisphere (SCR, PLIC, SLF), as opposed to the DTI studies investigating reading-impaired samples that rather reported left hemispheric differences. On the functional level, increased right hemispheric activation in subjects with reading and spelling impairment have been interpreted as (probably inefficient) compensatory cognitive mechanisms, e.g., internal articulation leading to phonological correct but orthographic incorrect spellings (e.g., Hoeft et al. 2011; Maisog et al. 2008; Shaywitz et al. 2006).
We found increased FA in controls compared to both spelling-impaired groups in the SCR. Fractional anisotropy reflects the degree of diffusion anisotropy within a voxel, determined by fiber diameter and density, degree of myelination (Basser 1995), extracellular diffusion, inter-axonal spacing (Sen and Basser 2005) and intravoxel fiber-tract coherence (Basser and Pierpaoli 1996). One out of many possible explanations could therefore be that increased FA might reflect more efficient axonal signal conduction (e.g., Basser 1995; Ben-Shachar et al. 2007).
Differences in white matter integrity in inferior–superior oriented fibers in the corona radiata and the PLIC have been found by prior studies investigating reading impairment (e.g., Beaulieu et al. 2005; Deutsch et al. 2005; Klingberg et al. 2000; Nagy et al. 2004; Niogi and McCandliss 2006). The corona radiata contains pathways devoted primarily to motor and somatosensory function. Therefore, a relation between white matter integrity in this region, and reading and spelling skills is rather surprising and difficult to interpret. Cerebellar deficits, reflections of differences in the CC or interdigitating pathways, such as the SLF have been suggested as possible explanations (Ben-Shachar et al. 2007).
The SLF connects the parieto-temporal cortex with the lateral frontal cortex and has been related to articulatory and phonological processing in language (Makris et al. 2005; Maldanado et al. 2011). The parieto-temporal cortex is known to be strongly related to the phoneme–grapheme conversion (Booth et al. 2002, 2004; Eden et al. 2004; Shaywitz et al. 2006). The lateral frontal cortex (e.g., inferior frontal gyrus) has been related to sublexical phonology-related processing (internal articulation) and lexico-semantic control and retrieval processes (Heim et al. 2009; Richlan et al. 2009; Maisog et al. 2008; Shaywitz et al. 2006).
We observed higher MD and radial diffusivity in the right hemisphere (SLF, PLIC, SCR, IFO, ILF and bilateral CC) for both spelling-impaired samples. Mean diffusivity is the mean of the eigenvalues of the diffusion tensor, invariant with respect to orientation of the diffusion tensor (Ben-Shachar et al. 2007). This suggests less efficient structural connectivity of right hemispheric pathways in spelling impaired children.
Correlations between spelling ability and white matter indices were found in the right PLIC, SCR and left inferior fronto-occipital fasciculus. A positive correlation between FA and spelling skills in the right PLIC, along with negative correlations to MD, axial and radial diffusivity and negative correlations between MD and axial diffusivity in the right SCR could possibly indicate more efficient white matter connectivity in the right hemisphere to be associated with better spelling skills. Axial diffusivity (λ1, along the axis of the fiber) has been shown to change with changes in fiber coherence and radial diffusivity [(λ2 + λ3)/2] and therefore has also sometimes been suggested to be related to factors such as fiber integrity and myelination.
It is important to note that the observed differences in white matter indices at baseline in children with spelling impairment may be one possible cause of spelling difficulties. Also, poorer spelling skills could result in less efficient cerebral connectivity. Clearly, further studies are needed to understand the relationship between white matter integrity and spelling skills.
We further investigated if 5 weeks of morpheme-based spelling intervention in children with poor spelling abilities would alter white matter microstructure. We indeed found first indications of changes in white matter related to successful intervention. Spelling ability improved in the TG, along with increases of FA and decreases of MD and radial diffusivity in the right hemisphere compared to controls, alluding to increased connectivity after the intervention. The comparison between controls and WG revealed just one significant area of greater FA change, including only seven voxels (see Fig. 5). The comparison of the spelling impaired TG and WG demonstrated significantly greater decrease of mean diffusivity in the right SCR in the TG, consistent with increasing structural connectivity in the group receiving the training. Descriptive data (see Table 3) suggested more widespread structural changes in the TG compared to the WG. However, probably due to the small sample size of nine to ten children per group and therefore reduced statistical power, these differences often did not reach significance. Further studies investigating larger samples and/or longer interventions would be needed to further clarify effects of spelling intervention on white matter changes. Increased FA and decreased radial diffusivity in the left anterior centrum semiovale in poor readers after intervention over 6 months have been observed (Keller and Just 2009). As mentioned earlier, differences between spelling impaired samples and controls were primarily observed in the right hemisphere. We found increases of FA and decreases of MD and radial diffusivity in right hemispheric pathways due to spelling intervention. Our results suggest that spelling impairment and improvement are related to white matter integrity in the right hemisphere. Positive correlations between stronger white matter integrity in the right SLF and greater activation in the right IFG and single-word reading improvement have also been found in a recent study that investigated children with dyslexia (Hoeft et al. 2011).
Some limitations of our study have to be considered, when interpreting our results. First, the sample size of ten children per group might be regarded as rather small, resulting in reduced statistical power. However, the employed study design (requiring children to participate in the training and to take part in several behavioral testing sessions and repeated MRI) imposed great efforts both on participants and the resources involved. We albeit hope our work might encourage future investigators to specifically investigate the effects of a spelling intervention on white matter integrity in larger spelling impaired samples. Further, biological interpretation of DTI parameters is challenging. We found evidence that spelling impairment was associated with lower FA and higher MD and radial diffusivity at baseline and that a spelling intervention resulted in increasing FA and reducing MD and radial diffusivity. Our results are therefore broadly consistent with the straight-forward but probably somewhat simplistic interpretation that higher FA (lower MD, radial diffusivity) is generally indicative of more preserved (“better”) white matter microstructure, as such values reflect greater fiber density and coherence and greater myelination which together could support improved neuronal efficiency. However, other microstructural changes, such as increasing axon diameter, or changes in crossing fiber populations, could alternatively affect DTI parameters in the opposite direction. Given this complexity, biological interpretations of DTI parameters have to remain speculative. In addition, our acquisition scheme was simple (including only 12 diffusion encoding directions) and so only a simple tensor model could be fitted to the data. Inclusion of more encoding directions could allow for greater accuracy of model parameter estimation and greater potential for complex model fitting. It is hoped that improvements in diffusion acquisition and modeling, as well as collection of multi-modal datasets, may allow for more accurate biological conclusions to be made in future studies.
Conclusion
In our sample, children with spelling impairment exhibited differences in white matter integrity mainly in the right hemisphere (SCR, PLIC, SLF). After 5 weeks of spelling intervention, spelling ability improved in the training group, along with evidence for altered integrity of white matter tracts in the right hemisphere compared to controls. We here thus provide first indications of changes in white matter due to successful intervention in such a cohort, which might stimulate future investigations into the effects of a spelling intervention in larger samples.
Appendix.
See Tables 4, 5, 6 and Fig. 6.
Fig. 6.
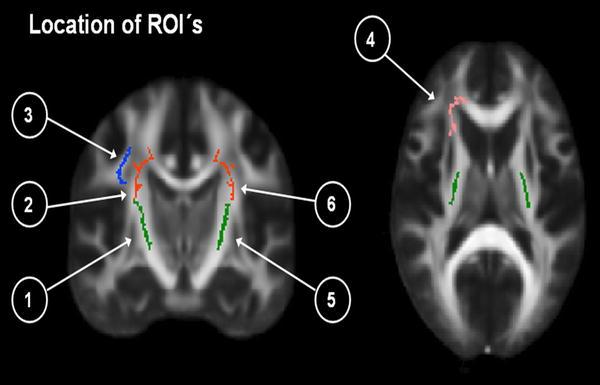
Location of ROI’s represented in Table 3. Presenting four ROI’s in the right hemisphere:1. Right posterior limb of internal capsule (PLIC, green); 2. Right superior corona radiata (SCR, red); 3. Right superior longitudinal fasciculus (SLF, blue); 4. Right anterior corona radiata (pink).Two ROI’s in the left hemisphere: 5. Left PLIC (green) and 6. Left SCR (red)
Table 4.
Local maxima and cluster size at baseline (TFCE, p < 0.95)
| Region (local maxima) | k | x | y | z |
|---|---|---|---|---|
| Fractional anisotropy (FA) | ||||
| CG > spelling impaired sample | ||||
| R anterior thalamic radiation | 7,924 | 84 | 114 | 78 |
| Mean diffusity (MD) | ||||
| Spelling impaired sample > CG | ||||
| R PLIC | 10,873 | 67 | 112 | 76 |
| Radial diffusivity | ||||
| Spelling-impaired sample > CG | ||||
| R PLIC | 13,771 | 67 | 110 | 74 |
TG training group, CG control group, WG waiting group, IFO inferior occipito-frontal fasciculus, SLF superior longitudinal fasciculus, PLIC posterior limb of internal capsule, SCR superior corona radiata, ILF inferior longitudinal fasciculus
Table 5.
Significant ROI at baseline
| Spelling-impaired sample | Control-group | p | |
|---|---|---|---|
| Right PLIC | |||
| FA | 0.4838 | 0.5079 | 0.005 |
| MD | 0.00054 | 0.00051 | 0.000 |
| Axial D. (mm2 s−1 ) | 0.00104 | 0.00101 | 0.023 |
| Radial D. (mm2 s−1 ) | 0.00029 | 0.00026 | 0.000 |
| Left PLIC | |||
| FA | 0.4989 | 0.5176 | 0.026 |
| Radial D. (mm2 s−1 ) | 0.00030 | 0.00028 | 0.022 |
| Right SCR | |||
| FA | 0.2130 | 0.2233 | 0.032 |
| MD | 0.00033 | 0.00031 | 0.002 |
| Axial D. (mm2 s−1 ) | 0.00053 | 0.00050 | 0.004 |
| Radial D. (mm2 s−1 ) | 0.00024 | 0.00021 | 0.003 |
| Right SLF | |||
| Radial D. (mm2 s−1 ) | 0.00037 | 0.00034 | 0.049 |
Comparison of mean FA, MD, axial and radial diffusivity indices across an a priori defined ROI between the spelling-impaired sample and controls Axial diffusivity and radial diffusivity values are expressed in mm2 s−1
R PLIC (FA: F (1,26) = 9.25, p < 0.05, ηp2 = 0.26; MD: F (1,26) = 21.03, p < 0.001, ηp2 = 0.45; L1: F (1,26) = 5.83, p < 0.05, ηp2 = 0.18; L23: F (2,25) = 17.30, p < 0.001, ηp2 = 0.40)
R SCR (FA: F (1,26) = 5.12, p < 0.05, ηp2 = 0.16; MD: F (1,26) = 12.29, p < 0.05, ηp2 = 0.32; L1: F (1,26) = 9.72, p < 0.05, ηp2 = 0.27; L23: F (1,26) = 10.45, p < 0.05, ηp2 = 0.29)
R SLF (L23: F (1,26) = 4.27, p = 0.05, ηp2 = 0.14)
L PLIC (FA: F (1,26) = 5.59, p < 0.05, ηp2 = 0.18; L23: F (1,26) = 5.98, p < 0.05, ηp2 = 0.19)
TG training group, CG control group, WG waiting group, FA fractional anisotropy, MD mean diffusivity, PLIC posterior limb of internal capsule, SCR superior corona radiata, SLF superior longitudinal fasciculus
Table 6.
Local maxima and cluster size for training effect (TFCE, p < 0.95)
| Region (local maxima) | k | x | y | z |
|---|---|---|---|---|
| FA | ||||
| F-test across the three groups | ||||
| R PLIC | 18 | 70 | 118 | 78 |
| 9 | 67 | 113 | 81 | |
| TG > CG | ||||
| R IFO | 5,496 | 56 | 130 | 72 |
| WG > CG | ||||
| R PLIC | 7 | 71 | 118 | 77 |
| MD | ||||
| F-test across the three groups | ||||
| R SCR | 3,619 | 63 | 125 | 94 |
| CG > TG | ||||
| R PLIC | 11,993 | 66 | 116 | 84 |
| Radial diffusity | ||||
| F-test across the three groups | ||||
| R SCR | 4,087 | 63 | 126 | 93 |
| R IFO | 2 | 56 | 107 | 63 |
| CG > TG | ||||
| R SCR | 15,416 | 66 | 124 | 91 |
TG training group, CG control group, WG waiting group, PLIC posterior limb of internal capsule, IFO inferior occipito-frontal fasciculus, SCR superior corona radiata
Contributor Information
D. Gebauer, Department of Neurology, Medical University of Graz, Graz, Austria; Department of Psychology, Institute of Psychology, Karl-Franzens-University of Graz, Universitaetsplatz 2/III, 8010 Graz, Austria
A. Fink, Department of Psychology, Institute of Psychology, Karl-Franzens-University of Graz, Universitaetsplatz 2/III, 8010 Graz, Austria
N. Filippini, Nuffield Department of Clinical Neuroscience, fMRIB Centre, University of Oxford, Oxford, UK; Department of Psychiatry, University of Oxford, Oxford, UK
H. Johansen-Berg, Nuffield Department of Clinical Neuroscience, fMRIB Centre, University of Oxford, Oxford, UK
G. Reishofer, Division of Neuroradiology, Department of Radiology, Medical University of Graz, Graz, Austria
K. Koschutnig, Division of Neuroradiology, Department of Radiology, Medical University of Graz, Graz, Austria
R. Kargl, Institute of Reading and Spelling, Graz, Austria
C. Purgstaller, Institute of Reading and Spelling, Graz, Austria
F. Fazekas, Department of Neurology, Medical University of Graz, Graz, Austria
C. Enzinger, Department of Neurology, Medical University of Graz, Graz, Austria; Division of Neuroradiology, Department of Radiology, Medical University of Graz, Graz, Austria
References
- Augst G. Schriftwortschatz: Untersuchungen und Wortlisten zum orthographischen Lexikon bei Schülern und Erwachsenen. Peter Lang, Frankfurt am Main. 1989 [Google Scholar]
- Aylward EH, Richards TL, Berninger VW, Nagy WE, Field KM, Grimme AC, Richards AL, Thomson JB, Cramer SC. Instructional treatment associated with changes in brain activation in children with dyslexia. Neurology. 2003;61:212–219. doi: 10.1212/01.wnl.0000068363.05974.64. [DOI] [PubMed] [Google Scholar]
- Basser PJ. Inferring microstructural features and the physiological state of tissues from diffusion-weighted images. NMR Biomed. 1995;8:333–344. doi: 10.1002/nbm.1940080707. [DOI] [PubMed] [Google Scholar]
- Basser PJ, Pierpaoli C. Microstructural and physiological features of tissues elucidated by quantitative-diffusion-tensor MRI. J Magn Reson B. 1996;111:209–219. doi: 10.1006/jmrb.1996.0086. [DOI] [PubMed] [Google Scholar]
- Beaulieu C, Plewes C, Paulson LA, Roy D, Snook L, Concha L, Phillips L. Imaging brain connectivity in children with diverse reading ability. NeuroImage. 2005;25:1266–1271. doi: 10.1016/j.neuroimage.2004.12.053. [DOI] [PubMed] [Google Scholar]
- Bengtsson SL, Nagy Z, Skare S, Forsman L, Forssberg H, Ullén F. Extensive piano practicing has regionally specific effects on white matter development. Nat Neurosci. 2005;8:1148–1150. doi: 10.1038/nn1516. [DOI] [PubMed] [Google Scholar]
- Ben-Shachar M, Dougherty R, Wandell B. White matter pathways in reading. Curr Opin Neurobiol. 2007;17:258–270. doi: 10.1016/j.conb.2007.03.006. [DOI] [PubMed] [Google Scholar]
- Booth J, Burman D, Meyer J, Gitelman D, Parrish T, Mesulam M. Functional anatomy of intra- and cross-modal lexical tasks. NeuroImage. 2002;16:7–22. doi: 10.1006/nimg.2002.1081. [DOI] [PubMed] [Google Scholar]
- Booth J, Burman D, Meyer J, Gitelman D, Parrish T, Mesulam M. Development of brain mechanisms for processing orthographic and phonologic representations. J Cog Neurosci. 2004;16:1234–1249. doi: 10.1162/0898929041920496. [DOI] [PMC free article] [PubMed] [Google Scholar]
- Carter J, Lanham D, Cutting L, Clements-Stephens A, Chen X, Hadzipasic M, Kim J, Denckla M, Kaufmann W. A dual DTI approach analyzing white matter in children with dyslexia. Psychiatr Res Neuroimaging. 2009;172:215–219. doi: 10.1016/j.pscychresns.2008.09.005. [DOI] [PMC free article] [PubMed] [Google Scholar]
- Deutsch G, Dougherty R, Bammer R, Siok WT, Gabrieli J, Wandell B. Children’s reading performance is correlated with white matter structure measured by diffusion tensor imaging. Cortex. 2005;41:354–363. doi: 10.1016/s0010-9452(08)70272-7. [DOI] [PubMed] [Google Scholar]
- Dougherty RF, Ben-Shachar M, Deutsch GK, Hernandez A, Fox GR, Wandell A. Temporal-callosal pathway diffusivity predicts phonological skills in children. PNAS. 2007;104:8556–8561. doi: 10.1073/pnas.0608961104. [DOI] [PMC free article] [PubMed] [Google Scholar]
- Draganski B, Gaser C, Busch V, Schuierer G, Bogdahn U, May A. Changes in gray matter induced by training. Nature. 2004;427:311–312. doi: 10.1038/427311a. [DOI] [PubMed] [Google Scholar]
- Eden GF, Jones KM, Cappell K, Gareau L, Wood FB, Zeffiro TA, Dietz NAE, Agnew JA, Flowers DL. Neural changes following remediation in adult developmental dyslexia. Neuron. 2004;44:411–422. doi: 10.1016/j.neuron.2004.10.019. [DOI] [PubMed] [Google Scholar]
- Gebauer D, Fink A, Kargl R, Reishofer G, Koschutnig K, Purgstaller C, Fazekas F, Enzinger C. Differences in brain function and changes with intervention in spelling impaired children. (submitted) [DOI] [PMC free article] [PubMed]
- Heim S, Eickhoff SB, Ischebeck AK, Friederici AD, Stephan KE, Amunts K. Effective connectivity of the left BA 44, BA 45 and inferior temporal gyrus during lexical and phonological decisions identified with DCM. Hum Brain Mapp. 2009;30:392–402. doi: 10.1002/hbm.20512. [DOI] [PMC free article] [PubMed] [Google Scholar]
- Hoeft F, McCandliss B, Black J, Gantman A, Zakerani N, Hulme C, Lyytinen H, Whitfield-Gabrieli S, Glover G, Reiss A, Gabrieli J. Neural systems predicting long-term outcome in dyslexia. PNAS. 2011;108:361–366. doi: 10.1073/pnas.1008950108. [DOI] [PMC free article] [PubMed] [Google Scholar]
- Kargl R, Purgstaller C. Morphem unterstütztes Segmentierungstraining MORPHEUS. Hogrefe; Göttingen: 2010. [Google Scholar]
- Keller TA, Just MA. Altering cortical connectivity: remediation-induced changes in the white matter of poor readers. Neuron. 2009;64:624–631. doi: 10.1016/j.neuron.2009.10.018. [DOI] [PMC free article] [PubMed] [Google Scholar]
- Klicpera C, Schabmann A, Gasteiger-Klicpera B. Legasthenie. Ernst Reinhardt Verlag; München, Basel: 2007. [Google Scholar]
- Klingberg T, Hedehus M, Temple E, Salz T, Gabrieli J, Moseley M, Poldrack R. Microstructure of temporo-parietal white matter as a basis for reading ability: evidence from diffusion tensor magnetic resonance imaging. Neuron. 2000;25:493–500. doi: 10.1016/s0896-6273(00)80911-3. [DOI] [PubMed] [Google Scholar]
- Kronbichler M, Wimmer H, Staffen W, Hutzler F, Mair A, Ladurner G. Developmental dyslexia: gray matter abnormalities in the occipitotemporal cortex. Hum Brain Mapp. 2008;29:613–625. doi: 10.1002/hbm.20425. [DOI] [PMC free article] [PubMed] [Google Scholar]
- Lenhard W, Schneider W. ELFE 1-6. Ein Leseverständnistest für Erst- bis Sechstklässler. Hogrefe; Göttingen: 2006. [Google Scholar]
- Maisog JM, Einbinder ER, Flowers DL, Turkeltaub PE, Eden GF. A meta-analysis of functional neuroimaging studies of dyslexia. Ann N Y Acad Sci. 2008;1145:237–259. doi: 10.1196/annals.1416.024. [DOI] [PubMed] [Google Scholar]
- Makris N, Kennedy DN, McInerney S, Sorensen AG, Wang R, Caviness VS, Pandya DN. Segmentation of subcomponents within the superior longitudinal fascicle in humans: a quantitative, in vivo, DT-MRI study. Cereb Cortex. 2005;15:854–869. doi: 10.1093/cercor/bhh186. [DOI] [PubMed] [Google Scholar]
- Maldanado IL, Moritz-Gasser S, Duffau H. Does the left superior longitudinal fascicle subserve language semantics? A brain electrostimulation study. Brain Struct Funct. 2011;216:263–274. doi: 10.1007/s00429-011-0309-x. [DOI] [PubMed] [Google Scholar]
- May P, Vieluf U, Malitzky V. Hamburger Schreibprobe. Diagnose orthographischer Kompetenz. Verlag für pädagogische Medien; Hamburg: 2000. [Google Scholar]
- Mayringer H, Wimmer H. Salzburger Lese-Screening für die Klassenstufen 1 - 4. Hans Huber; Bern: 2003. [Google Scholar]
- Mayringer H, Wimmer H. Salzburger Lese-Screening für die Klassenstufen 5 - 8. Hans Huber; Bern: 2005. [Google Scholar]
- Meyler A, Keller T, Cherkassky VL, Gabrieli J, Just MA. Modifying the brain activation of poor readers during sentence comprehension with extended remedial instruction: a longitudinal study of neuroplasticity. Neuropsychologia. 2008;46:2580–2592. doi: 10.1016/j.neuropsychologia.2008.03.012. [DOI] [PMC free article] [PubMed] [Google Scholar]
- Nagy Z, Westerberg H, Klingberg T. Maturation of white matter is associated with the development of cognitive functions during childhood. J Cogn Neurosci. 2004;16:1227–1233. doi: 10.1162/0898929041920441. [DOI] [PubMed] [Google Scholar]
- Nichols TE, Holmes AP. Nonparametric permutation tests for functional neuroimaging: a primer with examples. Hum Brain Mapp. 2002;15:1–25. doi: 10.1002/hbm.1058. [DOI] [PMC free article] [PubMed] [Google Scholar]
- Niogi SM, McCandliss BD. Left lateralized white matter microstructure accounts for individual differences in reading ability and disability. Neuropsychologia. 2006;44:2178–2188. doi: 10.1016/j.neuropsychologia.2006.01.011. [DOI] [PubMed] [Google Scholar]
- Poldrack RA, Desmond JE, Glover GH, Gabrieli JD. The neural basis of visual skill learning: an fMRI study of mirror reading. Cereb Cortex. 1998;8:1–10. doi: 10.1093/cercor/8.1.1. [DOI] [PubMed] [Google Scholar]
- Raichle ME, Fiez JA, Videen TO, MacLeod AM, Pardo JV, Fox PT, Petersen SE. Practice-related changes in human brain functional anatomy during nonmotor learning. Cereb Cortex. 1994;4:8–26. doi: 10.1093/cercor/4.1.8. [DOI] [PubMed] [Google Scholar]
- Raven JC. Guide to the Standard Progressive Matrices: Sets A, B, C, D and E. HK Lewis; London: 1960. [Google Scholar]
- Richards TL, Aylward EH, Berninger VW, Field KM, Grimme AC, Richards AL, Nagy W. Individual fMRI activiation in orthographic mapping and morpheme mapping after orthographic or morphological spelling treatment in child dyslexics. J Neuroling. 2006;19:56–86. [Google Scholar]
- Richards T, Berninger V, Fayol M. fMRI activation differences between 11-year-old good and poor spellers’ access in working memory to temporary and long-term orthographic representations. J Neuroling. 2009;22:327–353. [Google Scholar]
- Richlan F, Kronbichler M, Wimmer H. Functional abnormalities in the dyslexic brain: a quantitative meta-analysis of neuroimaging studies. Hum Brain Mapp. 2009;30:3299–3308. doi: 10.1002/hbm.20752. [DOI] [PMC free article] [PubMed] [Google Scholar]
- Rimrodt SL, Peterson DJ, Denckla MB, Kaufmann WE, Cutting LE. White matter microstructural differences linked to left perisylvian language network in children with dyslexia. Cortex. 2010;46:739–749. doi: 10.1016/j.cortex.2009.07.008. [DOI] [PMC free article] [PubMed] [Google Scholar]
- Rollins N, Vachha B, Srinivasan P, Chia J, Pickering J, Hughes C, Gimi B. Simple developmental dyslexia in children: alterations in diffusion tensor matrices of white matter tracts at 3 T. Radiology. 2009;251:882–891. doi: 10.1148/radiol.2513080884. [DOI] [PubMed] [Google Scholar]
- Scheerer-Neumann G. Intervention bei Lese-Rechtschreibschwäche. Überblick über Theorien, Methoden und Ergebnisse. Kamp; Bochum: 1979. [Google Scholar]
- Scholz J, Klein M, Behrens T, Johansen-Berg H. Training induces changes in white-matter architecture. Nat Neurosci. 2009;12:1370–1371. doi: 10.1038/nn.2412. [DOI] [PMC free article] [PubMed] [Google Scholar]
- Schulte-Körne G, Remschmidt H. Legasthenie- Symptomatik, Diagnostik, Ursachen, Verlauf und Behandlung. Deutsches Ärzteblatt. 2003;7:396–406. [Google Scholar]
- Sen PN, Basser PJ. A model for diffusion in white matter in the brain. Biophys J. 2005;89:2927–2938. doi: 10.1529/biophysj.105.063016. [DOI] [PMC free article] [PubMed] [Google Scholar]
- Shaywitz B, Shaywitz S, Blachman B, Pugh K, Fulbright R, Skudlarski P, Einar Mencl W, Constable R, Holohan J, Marchione K, Fletcher J, Lyon G, Gore J. Development of left occipitotemporal systems forskilled reading in children after a phonologically based intervention. Biol Psychiatry. 2004;55:926–233. doi: 10.1016/j.biopsych.2003.12.019. [DOI] [PubMed] [Google Scholar]
- Shaywitz SE, Mody M, Shaywitz B. Neural mechanisms in dyslexia. Curr Dir Psychol Sci. 2006;15:278–281. [Google Scholar]
- Simos P, Fletcher J, Berman M, Breier J, Foorman B, Castillo E, Davis R, Fitzgerald M, Papanicolaou A. Dyslexia-specific brain activation profile becomes normal following successful remedial training. Neurology. 2002;58:1203–1213. doi: 10.1212/wnl.58.8.1203. [DOI] [PubMed] [Google Scholar]
- Simos P, Fletcher J, Denton C, Sarkari S, Billingsley-Marshall R, Papanicolaou A. Magnetic source imaging studies of dyslexia interventions. Dev Neuropsychol. 2006;30:591–611. doi: 10.1207/s15326942dn3001_4. [DOI] [PubMed] [Google Scholar]
- Smith SM, Nichols TE. Threshold-free cluster enhancement: addressing problems of smoothing, threshold dependence and localisation in cluster inference. NeuroImage. 2009;44:83–98. doi: 10.1016/j.neuroimage.2008.03.061. [DOI] [PubMed] [Google Scholar]
- Steinbrink C, Vogt K, Kastrup A, Müller H-P, Juengling FD, Kassubek J, Riecker A. The contribution of white and gray matter differences to developmental dyslexia: Insights from DTI and VBM at 3.0 T. Neuropsychologia. 2008;46:3170–3178. doi: 10.1016/j.neuropsychologia.2008.07.015. [DOI] [PubMed] [Google Scholar]
- Temple E, Deutsch G, Poldrack R, Miller S, Tallal P, Merzenich M, Gabrieli J. Neural deficits in children with dyslexia ameliorated by behavioral remediation: evidence from functional MRI. PNAS USA. 2003;100:2860–2865. doi: 10.1073/pnas.0030098100. [DOI] [PMC free article] [PubMed] [Google Scholar]
- Westerberg H, Klingberg T. Changes in cortical activity after training of working memory: a single subject analysis. Physiol Behav. 2007;92:186–192. doi: 10.1016/j.physbeh.2007.05.041. [DOI] [PubMed] [Google Scholar]