

Abstract
Cholesterol (CHOL) molecules play a key role in modulating the rigidity of cell membranes and controlling intracellular transport and signal transduction. Using an all-atom molecular dynamics approach, we study the process of CHOL interleaflet transport (flip-flop) in a dipalmitoylphosphatidycholine (DPPC)-CHOL bilayer over a time period of 15 μs. We investigate the effect of the flip-flop process on mechanical stress across the bilayer and the role of CHOL in inducing molecular order in bilayer leaflets. The simulations are carried out at physiologically relevant CHOL concentration (30%), temperature (323 K), and pressure (1 bar). CHOL flip-flop events are observed with a rate constant of 3 × 10⁴ s−1. Once a flip-flop event is triggered, a CHOL molecule takes an average of 73 nanoseconds to migrate from one bilayer leaflet to the other.
Introduction
In the standard fluid mosaic model, cell membranes are dynamic structures in which molecular motions play a key biophysical role (1). These motions include diffusion of proteins and lipids in the plane of the bilayer and flip-flop transport of lipids between the two leaflets composing the bilayer. Although flip-flop motion of phospholipids is typically considered to be a slow process, with little relevance on physiological timescales (2), this is not the case for cholesterol (CHOL). Although the transport rate of CHOL has been elusive from an experimental point of view, most studies suggest that it is relatively fast (3). This rapid flip-flop transport has profound implications for the biological role of CHOL in cell membranes.
The potential role of CHOL in controlling the mechanical behavior of membranes can be understood in the context of the bilayer couple hypothesis originally suggested by Sheetz and Singer (4), in which the overall curvature of a membrane is determined by the relative areas of the two leaflets. The membrane curves away from the leaflet with the relative excess of surface area, much in the way a bimetallic couple curves away from the metal film with the greater thermal expansion modulus. Lange and co-workers (5) first suggested that CHOL may act as a surface area buffer in cell membranes, stabilizing changes in membrane shape by rapidly flipping between the bilayer leaflets, decreasing the surface area of the relatively compressed leaflet while increasing the surface area of the relatively expanded leaflet. This was consistent with their observations that CHOL concentration determines the equilibrium curvature of membrane ghosts derived from red blood cells (6).
The concept of CHOL as a molecule to facilitate membrane curvature seems at odds with its observed effect on the mechanics of membrane bending, however. Multiple studies have shown that as the CHOL content of a membrane increases, the membrane becomes more rigid, requiring more force to produce the same degree of curvature (7–10). Recently, Bruckner and co-workers (11) suggested that the effect of CHOL on membrane mechanics may be time dependent, resulting in an increased instantaneous elastic modulus but allowing for relaxation of curved membranes at longer timescales by a flip-flop mechanism. This is consistent with the results of Yanagisawa and co-workers (12), who observed that in membrane vesicles in which CHOL-rich regions are formed, deformation at long timescales occurred preferentially where CHOL concentration was the greatest.
Another potential role for CHOL flip-flop in cell physiology is related to the interleaflet coupling of lipid phase separation. The chemical composition of the eukaryotic plasma membrane is asymmetric (13,14); that is, if the bilayer membrane is considered as two monolayers (or leaflets) packed tail to tail, the leaflet facing the exterior of the cell contains different lipids at different concentrations than the leaflet facing the interior of the cell. In terms of lipid phase state, it is striking that the interior leaflet of a eukaryotic plasma membrane has a composition that does not form phase-segregated liquid-ordered (lo) and liquid-disordered (ld) domains in vitro, whereas the exterior leaflet will segregate into these two liquid phases (15). However, evidence from biochemical assays (16) and recent in vitro experiments (17–20) has shown that the phase separation in one leaflet of an asymmetric bilayer can induce domain formation in the opposing leaflet. Rapid CHOL transport between the leaflets may be the mechanism of this induction (21).
Understanding the role of CHOL in the membrane requires understanding the dynamics of CHOL flip-flop. Our hypothesis is that membrane bending stress can be relieved by cholesterol flip-flop across the membrane with a characteristic timescale in the microsecond range. Broad ranges have been reported for CHOL flip-flop rates, but the general trend has been for the upper limit on flip-flop halftime to decrease as analytical techniques have become more advanced. Early studies reported that this halftime was definitively shorter than phospholipid flip-flop halftime, but ranged broadly from 3 s (5) to tens of minutes (22). More recent studies have clarified that the halftime is certainly shorter than 1 s (23), and Bruckner et al. (11) used an NMR-based technique to identify CHOL residence time on a single leaflet of the bilayer as <10 ms. Wide discrepancies remain in experimental studies of CHOL flip-flop, however. In 2011, Garg and co-workers (24) reported neutron scattering results consistent with a CHOL flip-flop halftime in the range of hundreds of minutes. Physical insights into the molecular details of flip-flop will be a useful tool in resolving these discrepancies.
In fact, molecular dynamics (MD) simulations of CHOL flip-flop transport have generally identified fast flip-flop rates, with halftimes in the range of tens of ns to ms (25,26). There have also been MD simulations identifying relatively slow CHOL flip-flop, however, with recent work by Bennett and Tieleman supporting halftimes in the range of minutes for raft-like bilayers (27). The MD simulations that have been performed so far have used coarse-grain methods and/or steered approaches to capture flip-flop events.
Here, we report an all-atom MD simulation study of spontaneous flip-flop events in a dipalmitoylphosphatidycholine (DPPC)/CHOL bilayer at physiological CHOL concentrations. We have examined the effects of CHOL translocation on structural, dynamical, and mechanical properties of the DPPC bilayer membrane. We performed two simulations: in one case, the initial configuration of the bilayer leaflets had a slight imbalance (31% and 29%) in CHOL concentrations; and in the other case, each leaflet had the same number of CHOL molecules in the initial configuration. We ran the first simulation for 15 μs and observed 24 CHOL flip-flop events. In the second case, we performed the simulation with the parallel replica method (PRM) (28,29) and observed five CHOL translocations over a period of 2.9 μs. On average, a CHOL molecule migrates across the lipid bilayer in ∼73 ns after a flip-flop event is triggered. The potential energy barrier for a CHOL translocation event is estimated to be 100 KJ/mole, whereas the free energy barrier is significantly lower (21.5 KJ/mol). We have also calculated the effects of CHOL translocation on mechanical stresses across the lipid bilayer and on the curvatures of bilayer leaflets. We find that the compressive lateral pressure and curvature of a leaflet decrease after a CHOL molecule leaves the leaflet.
Methods
All-atom MD simulations were performed on a system consisting of 360 DPPC and 152 CHOL molecules, which corresponds to an average CHOL concentration of 30%. The system also contained 14,620 simple point charge water molecules. Altogether, there were 66,268 atoms in the system. We used the DPPC force field of Tieleman et al. (30) and a slightly modified GROMOS force field for CHOL molecules (31,32). Periodic boundary conditions were applied in all directions. We used the particle mesh Ewald method to calculate the long-range Coulomb interaction. The system was coupled to a thermal bath at a temperature of 323 K and to a barostat at a pressure of 1 bar. Equations of motions were integrated with the velocity Verlet algorithm using a time step of 2 fs and we ran the simulation for 15 μs. Simulation details are given in the Supporting Material.
We also studied CHOL flip-flop dynamics with the parallel replica MD simulation scheme (28). Parallel replica is an efficient approach to sample rare events, such as CHOL translocation across a membrane. In this scheme, one generates multiple replicas of an atomic configuration, i.e., atomic positions at a given instant of time. These replica configurations are implemented on a parallel machine with identical processors. The number of available parallel processors p is partitioned into n groups, where n is equal to the number of replicas. Each replica configuration is implemented on the p/n number of processors. Although the initial atomic configurations of the replicas are identical, the initial atomic velocities in the replicas are not the same. They are chosen randomly from the Maxwell distribution corresponding to the temperature of the system. The n replica simulations are run concurrently for a dephasing time on the order of a few ns, and after dephasing, the parallel replica simulations are run until a rare event is observed in one of the replicas. At that instant, the simulations are stopped and the atomic configuration of the replica with the rare event is implemented on the other (p/n-1) groups of processors. Again, new Maxwellian random velocities are assigned to all the atoms in the n replicas and then replica simulations are run in parallel until the next rare event is observed.
Results
To study CHOL flip-flop dynamics resulting from a small difference in CHOL concentrations in the bilayer leaflets, we setup an initial MD configuration in which the CHOL concentrations in the two leaflets were 31% and 29%. Hereafter, the leaflets with 31% and 29% initial CHOL concentrations will be referred to as the upper leaflet (UL) and lower leaflet (LL), respectively. In this initial configuration, the CHOL molecules were placed randomly in the UL and LL. We ran the MD simulation for 15 μs and observed 22 CHOL translocation events from the UL to the LL and two of those 22 CHOL molecules translocated back to the UL. A translocation event is determined by monitoring the z-coordinate of the hydroxyl group of a CHOL molecule, zOH. If the change in zOH exceeds two-thirds the membrane thickness (∼4–5 nm), we consider that a translocation or flip-flop event. For each flip-flop event we monitor residence times in the bilayer leaflets before the onset of the flip-flop event and after the trans-membrane migration of the CHOL molecule. We also monitor the CHOL residence time in the middle of the bilayer. Fig. 1, a–c, shows snapshots of a CHOL molecule (red and cyan) migrating from the UL to the LL. The snapshots also show the surrounding DPPC molecules (blue and yellow) in the bilayer. For clarity, other CHOL or water molecules are not shown here.
Figure 1.
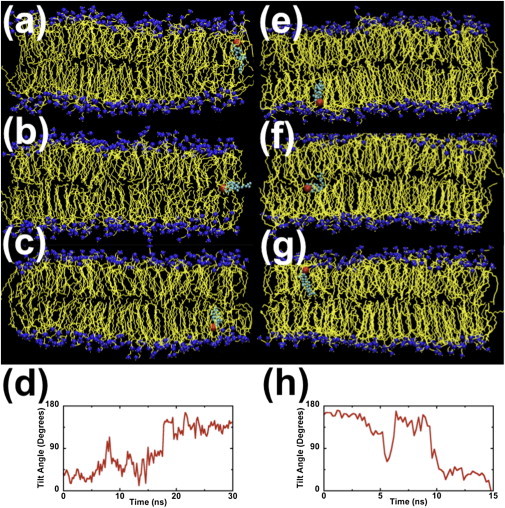
Snapshots of a translocating CHOL molecule (headgroup is red and ring/tail structure is cyan) surrounded by DPPC molecules. For clarity, other CHOL and water molecules are not shown here. Panels (a–c) show CHOL translocation from the UL to the LL. These snapshots were taken at time t = 166, 173, and 189 ns. Panel (d) shows how the tilt angle (angle between the bilayer normal and the line joining atoms C5 and C21 in a CHOL molecule; see Fig S1) changes with time. Panels (e–g) are snapshots of the same CHOL molecule at t = 13407, 13412, and 13418 ns, respectively. These snapshots show translocation from the LL to the UL. Panel (h) shows changes in the CHOL tilt angle with time.
Cholesterol molecules with their rigid hydrocarbon rings and flexible hydrocarbon tails are usually aligned parallel to the bilayer normal (z axis). When a CHOL molecule starts to migrate across the bilayer, the angle between its molecular axis (i.e., the line joining atoms C5 and C21 in a CHOL molecule; see Fig. S1 in the Supporting Material) and the bilayer normal begins to increase. Near the middle of the bilayer, the translocating CHOL molecule lies almost entirely in the x-y plane; see Fig. 1 b. When the molecule leaves the middle of the bilayer and approaches the opposite leaflet, its molecular axis begins to tilt toward the bilayer normal with its hydroxyl group facing that leaflet; see Fig. 1 c. Fig. 1 d shows changes in the angle between the axis of the translocating CHOL molecule and the bilayer normal as the molecule migrates across the bilayer. We observe similar changes in the angle for every translocating CHOL molecule. Fig. 1, e–g, shows the same CHOL molecule migrating back to the UL ∼13 μs later. In this reverse translocation, the residence time for the molecule in the middle of the bilayer was only 7 ns. The molecule took 37 ns to diffuse from the LL to the middle of the bilayer and another 29 ns to diffuse to the UL.
We found a wide range of time intervals between successive flop-flop events. As shown in Fig. 2 a, 13 CHOL translocation events occurred in the first 5 μs. The shortest time interval between consecutive flip-flop events was 20 ns and the longest 2 μs. The frequency of CHOL flip-flop events dropped after 5 μs. Between 5 and 10 μs, there were 7 UL → LL flip-flop events. After 10 μs, we observed two translocations from the UL to the LL and two in the opposite direction. The histogram in Fig. 2 b shows the distribution of translocation event durations. The shortest translocation time is 20 ns and the longest 200 ns. The average translocation time for the 24 flip-flop events we observed was 73 ns.
Figure 2.
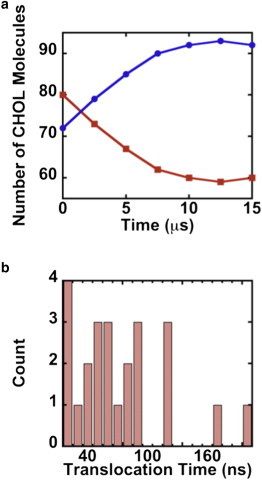
(a) The number of CHOL molecules in the upper (red squares) and lower (blue circles) leaflets as the simulation progressed. (b) A histogram of total translocation times for the 24 flip-flop events we observed in 15 μs.
The first CHOL flip-flop event happened at 165 ns. In that event, the CHOL molecule moved from the UL to the middle of the bilayer in ∼7 ns, stayed there for 10 ns, and then moved to the LL in ∼7 ns. For translocating CHOL molecules, the residence time in the middle of the bilayer varied between 10 and 90 ns. Similarly, we observed a wide range of timescales for transitions from the UL to the middle of the bilayer (10–70 ns) and from there to the LL (5–45 ns).
A couple of times during the simulation (15 μs), we observed a pair of CHOL molecules residing simultaneously in the middle of the bilayer while translocating from the UL to the LL. Snapshots in Fig. 3 show the transmembrane migration for a pair of molecules. The second flip-flop event was triggered ∼20 ns after the first one. The two molecules resided in the middle of the bilayer for ∼60 and 13 ns, and the second molecule reached the LL 11 ns before the first one.
Figure 3.
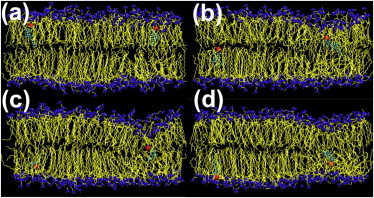
A pair of CHOL molecules (headgroups are red and ring/tail structures are cyan) translocating almost simultaneously from the UL to the LL. Snapshots (a–d) were taken at time t = 4340, 4385, 4465, and 4505 ns, respectively.
We investigated the effect of CHOL translocation on the so-called deuterium order parameter, SCD, for the acyl chains of DPPC molecules (see the Supporting Material). Fig. 4 shows the effect of CHOL flip-flop on the order parameter. The results shown here were averaged over all the atoms of acyl chains in the UL and LL. At time t = 100 ns the value of SCD for the UL is higher than that for the LL because the UL has more CHOL molecules (80) than the LL (72). The order parameter for DPPC molecules in the LL increases with CHOL migration from the UL to the LL. This is consistent with experimental (33) and MD simulation (34,35) studies, which show that an increase in CHOL concentration reduces the number of gauche defects in the hydrocarbon chains of DPPC molecules and thus the value of the order parameter is increased. Fig. 4 shows that the order parameter for the LL levels off after 10 μs, because there are very few flip-flop events in the last 5 μs of the simulation.
Figure 4.
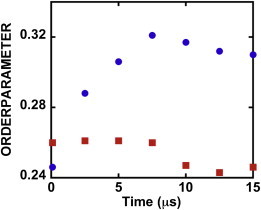
Time evolution of order parameters for DPPC molecules in the upper (red squares) and lower (blue circles) leaflets.
We have also determined the lateral self-diffusion coefficients from the time evolution of the mean square displacements of DPPC and CHOL molecules in the two leaflets; see also the Supporting Material. We found the diffusion coefficients for both CHOL and DPPC molecules are nearly the same when these molecules are in the same leaflet. However, the self-diffusion coefficients for molecules in opposite leaflets vary significantly because the two leaflets have different CHOL concentrations. For example, after 5 μs the diffusion coefficient was 35% higher in the UL than in the LL. This was caused by the translocation of CHOL molecules, which made the CHOL concentration in the LL 5% higher than in the UL. The higher the CHOL concentration, the less mobile are the molecules in the leaflet (34).
Fig. 5 shows changes in the potential energy of a CHOL molecule with time as the molecule translocates from the UL to the LL. The potential energy is calculated by summing up the bonded and nonbonded (Lennard-Jones and electrostatic) energies for the translocating CHOL molecule. The potential energy of the translocating molecule fluctuates around −350 kJ/mole when the molecule is in the UL or LL. In the middle of the bilayer (see inset), the potential energy of the molecule rises to −250 kJ/mole. Thus, the potential energy barrier to CHOL interleaflet migration is around 100 kJ/mole. In every CHOL flip-flop event, we find almost the same value for the potential energy barrier.
Figure 5.
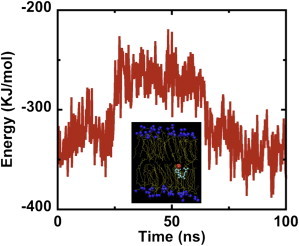
Potential energy of a flip-flopping CHOL molecule as a function of time. The potential energy barrier is ∼100 KJ/mol. The inset shows the cholesterol molecule (headgroup is red and ring/tail structure is cyan) in the middle of the bilayer.
To correlate structural changes with the mechanical response of the membrane, we calculated the density profile and mechanical stresses across the membrane (i.e., along z, the bilayer normal) at various time intervals; see the Supporting Material for more details. The membrane thickness was calculated from the difference between the two highest peaks in the density profile and the lateral pressure, π(z), from the diagonal components of the stress tensor
| (1) |
Here, mi is the mass of the ith atom, is its velocity, and and are the position vector and force between atoms i and j, respectively.
Fig. 6, a and b, shows the density and lateral pressure, respectively, at time t = 15 μs. The two leaflets have reached mechanical equilibrium because they have nearly the same stress profiles. Cholesterol molecules may flip-flop between the leaflets, but the probability for the UL → LL translocation is balanced by the probability for the LL → UL translocation.
Figure 6.
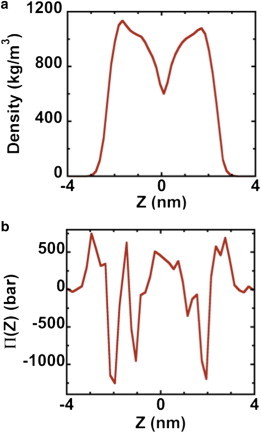
(a and b) are density and stress, Π(Z), profiles, respectively, across the bilayer at time t = 15 μs. Membrane midplane is at Z = 0.
We also calculated the curvature energies of UL and LL to determine if the CHOL flip-flop dynamics lead to membrane relaxation (see the Supporting Material). Our results indicate that CHOL migration from the UL to the LL decreases the curvature energy of the UL. However, the curvature energy of the LL remains more or less the same over the entire duration of the simulation. At 15 μs, the curvature energies of the two leaflets are very close to each other.
Finally, we performed another all-atom MD simulation in which the two leaflets had the same number of CHOL molecules. In this case, we used the PRM to study CHOL flip-flop events. In PRM the initial configuration of the system was taken from the MD simulation after four CHOL molecules had migrated from the UL to the LL of the bilayer. Therefore, in the initial configuration of the parallel replica MD simulation, each leaflet had 76 CHOL molecules or 30% CHOL concentration. We created five replicas of this configuration and assigned each atom in the system a random velocity chosen from the Maxwell distribution corresponding to a temperature of 323 K. Using a thermostat and keeping the pressure constant at 1 bar, the five replicas were run in parallel on 900 identical processors of a Linux cluster (180 processors for each replica) for a dephasing time of 5 ns. There were no flip-flop events during the dephasing time. After dephasing, the parallel replica simulations were continued until a flip-flop event occurred in one of the replicas. The total time for a flip-flop event is simply five times the elapsed MD simulation time after dephasing. Altogether we observed five translocation events from the UL to the LL in a span of 2.9 μs.
Discussion
In the direct all-atom MD simulation we observed 24 CHOL flip-flop events over a span of 15 μs, and in the parallel replica MD simulation there were five translocation events over 2.9 μs. Based on these results, the average CHOL translocation frequency in the simulated system is ∼1.6 ×10⁶ s−1 and the rate constant for flip-flop events in the first 10 μs is found to be 30,000 s−1, corresponding to a flip-flop halftime of 23 μs. The CHOL flip-flop rate drops off significantly with time as shown in Fig. S3.
We have estimated the free-energy barrier for flip-flop events from the calculation of diffusion maps of CHOL molecules (36). We find the free-energy barrier (21.5 KJ/mol) to be significantly lower than the potential energy barrier shown in Fig. 5. Our estimate for the free-energy barrier is consistent with the calculated flip-flop rate. Bennett et al. report the free energy barrier to be 25 KJ/mol for 0% and 41 KJ/mol for 40% CHOL concentration.
The average CHOL flip-flop rate in our MD simulations is faster than the rate reported for other MD simulations of DPPC bilayers. In their 2009 work, Bennett et al. (26) reported the CHOL flip-flop event rate constant to be between 10 and 8100 s−1 for DPPC bilayers with CHOL concentrations between 20% and 40% at 323 K. These rate constants are based on umbrella sampling free energy calculations with all-atom MD simulations. In the same work, Bennett et al. also observed direct flip-flop events in their 3 μs long coarse-grained MD simulations. They found that the flip-flop rate constant exceeds 14,000 s−1 when the CHOL concentration is 40%. Jo and co-workers (25) found a CHOL flip-flop rate constant between 1200 and 16,000 s−1 based on an umbrella sampling MD simulation of DPPC bilayers with two cholesterol molecules at 323 K. Perhaps the reason for the faster flip-flop rate in our all-atom MD simulation is that initially the UL and LL had slightly different initial CHOL concentrations, 31% and 29%, respectively. Fast flip-flop rates have been reported in recent experimental work; Steck et al. found that flip-flop has a halftime of <1 s (23), whereas Bruckner et al. placed an upper limit of 10 ms on the halftime. These results, as well as other recent MD results, suggest that these fast flip-flop measurements are certainly plausible. They also call for experimental approaches with finer temporal resolution, capable of probing the timescales simulated here.
The fast flip-flop rates we see here have implications for the physiological mechanism that maintains CHOL concentration asymmetry in the plasma membrane. In the context of CHOL molecules that can migrate across the membrane so quickly, it makes no sense to postulate active mechanisms (mediated either by transport proteins or steady-state membrane remodeling) that maintain the asymmetry. Instead, the asymmetric CHOL composition must be built into the chemical physics of the membrane, and is most likely a result of interactions between CHOL and other lipid species. In particular, interactions between CHOL and sphingomyelin (SM) seem a likely source. It is well known that these molecules associate strongly (37), and SM flip-flops slowly, with a long residence time in a single bilayer leaflet (38). A recent report by Bennett and Tieleman (27) shows MD simulations in which the presence of SM in a raft-like membrane slows CHOL flip-flop tremendously, yielding a rate constant of 4.4 × 10⁻⁴ s−1.
From the observed direct events in our simulations we find that on average CHOL translocation time is ∼73 ns. Because CHOL can exchange between the leaflets rapidly, CHOL flip-flop is a likely mechanism for a range of physiological processes, including coupling of phase structure across the membrane and stress relaxation upon membrane bending.
Our results provide evidence of an induced phase transition upon CHOL flip-flop. Fig. 4 shows clearly that as CHOL molecules migrate from the UL to the LL, the order parameter of the LL increases. The temperature at which this simulation was performed, binary membranes of CHOL and DPPC can take on either an lo or ld configuration, depending on the concentration of CHOL. Chiang et al. (39) have identified lo/ld phase coexistence at ∼20% CHOL with a transition to pure lo phase occurring at ∼30% CHOL concentration. Our simulation, then, was performed around the transition between the phase coexistence regime and the pure lo regime. Chiang et al. also saw that the order parameter for the lo phase was ∼0.1 greater than that for the ld phase, roughly consistent with the difference between the order parameters for the two leaflets at the 15 μs time point, at which the LL is 34% CHOL, whereas the UL is 25% CHOL. The constant increase of the order parameter of the LL in the first ∼7.5 μs is consistent with ordering induced by the 22 CHOL molecules that flip-flop into this leaflet, taking it from 29% to 34% CHOL concentration. Rapid flip-flop of CHOL from a CHOL-rich leaflet to a CHOL-poor leaflet can clearly induce lipid ordering.
Our results for the order parameter are in good agreement with previous MD calculations of order parameter at various CHOL concentrations. At 15 μs we find the CHOL concentration in the UL is 25% and the order parameter is 0.28. Hofsaβ et al. (34) reported a value of 0.3 for the order parameter at the same CHOL concentration. In the LL we calculate the order parameter to be 0.33 at t =15 μs and the corresponding CHOL concentration to be 34%. Hofsaβ et al. reported a value of 0.31 for SCD at 40% CHOL concentration. (Note that to compare our results with those of Hofsaβ et al. we averaged over atoms 2–8 in the acyl chains). The slight discrepancy between their results and ours is likely due to the difference in hydration levels.
Our results also provide direct evidence for the role of relaxation of membrane stress upon CHOL flip-flop. We found the total stress profile of the membrane changes as CHOL migrates from the upper leaflet to the lower leaflet. The total compressive stress in the upper leaflet (Z > 0 nm) decreases significantly, which suggests that membrane bending in the direction of this leaflet would require significantly less energy following the transport of CHOL to the lower leaflet (Fig. S2). Cholesterol transport rate slows as the membrane relaxes, (Fig. S3), indicating that the initially observed fast transport rates may be driven in part by membrane stress. This all suggests that rapid CHOL flip-flop may be an important mechanism by which a stressed membrane is relaxed.
Given the experimental challenges in directly addressing the timescales of flip-flop events shown here, the best approaches to further investigating the biophysics of CHOL transport in membranes likely revolve around examining the secondary effects of flip-flop, particularly the ordering and stress relaxation effects described previously. One promising model system for experimental investigation is the asymmetric SM vesicle system described by London and co-workers (38,40). Such systems allow for the dynamics of CHOL to be modulated in each leaflet independently via the strong SM-CHOL interaction. Combined with detailed simulations of this interaction and the implications of this interaction for membrane properties, the examination of how SM asymmetry alters membrane properties has the potential to provide key evidence for the role of CHOL flip-flop and its dynamics in key physiological processes.
In summary, our all-atom MD simulations of DPPC-CHOL membrane reveal that a slight imbalance (2%) in CHOL concentration between the UL and LL leads to spontaneous CHOL flip-flop events, revealing a relatively large rate constant of ∼30,000 s−1. The average time for a CHOL molecule to migrate across the DPPC bilayer is 73 ns. At the end of our 15 μs MD simulation, we find that the stress distributions in the UL and LL are nearly symmetric and that their curvature energies are approximately the same. Hence, we conclude that CHOL flip-flop events tend to relax stressed membranes.
Acknowledgments
Simulations were performed on the 20,925-processor Linux cluster at USC’s High Performance Computing Facility and on the 4,096-processor Linux cluster at our Collaboratory for Advanced Computing and Simulations.
This work was supported by a National Science Foundation-Cyber-Enabled Discovery grants (CDI-IOS-1125317 and CMMI-1068212. A. Choubey acknowledges the USC Provost Fellowship Award.
Footnotes
This is an Open Access article distributed under the terms of the Creative Commons-Attribution Noncommercial License (http://creativecommons.org/licenses/by-nc/2.0/), which permits unrestricted noncommercial use, distribution, and reproduction in any medium, provided the original work is properly cited.
Supporting Material
References
- 1.Singer S.J., Nicolson G.L. The fluid mosaic model of the structure of cell membranes. Science. 1972;175:720–731. doi: 10.1126/science.175.4023.720. [DOI] [PubMed] [Google Scholar]
- 2.Nakano M., Fukuda M., Handa T. Flip-flop of phospholipids in vesicles: kinetic analysis with time-resolved small-angle neutron scattering. J. Phys. Chem. B. 2009;113:6745–6748. doi: 10.1021/jp900913w. [DOI] [PubMed] [Google Scholar]
- 3.Hamilton J.A. Fast flip-flop of cholesterol and fatty acids in membranes: implications for membrane transport proteins. Curr. Opin. Lipidol. 2003;14:263–271. doi: 10.1097/00041433-200306000-00006. [DOI] [PubMed] [Google Scholar]
- 4.Sheetz M.P., Singer S.J. Biological membranes as bilayer couples. A molecular mechanism of drug-erythrocyte interactions. Proc. Natl. Acad. Sci. USA. 1974;71:4457–4461. doi: 10.1073/pnas.71.11.4457. [DOI] [PMC free article] [PubMed] [Google Scholar]
- 5.Lange Y., Dolde J., Steck T.L. The rate of transmembrane movement of cholesterol in the human erythrocyte. J. Biol. Chem. 1981;256:5321–5323. [PubMed] [Google Scholar]
- 6.Lange Y., Cutler H.B., Steck T.L. The effect of cholesterol and other intercalated amphipaths on the contour and stability of the isolated red cell membrane. J. Biol. Chem. 1980;255:9331–9337. [PubMed] [Google Scholar]
- 7.Evans E., Rawicz W. Entropy-driven tension and bending elasticity in condensed-fluid membranes. Phys. Rev. Lett. 1990;64:2094–2097. doi: 10.1103/PhysRevLett.64.2094. [DOI] [PubMed] [Google Scholar]
- 8.Song J.B., Waugh R.E. Bending rigidity of SOPC membranes containing cholesterol. Biophys. J. 1993;64:1967–1970. doi: 10.1016/S0006-3495(93)81566-2. [DOI] [PMC free article] [PubMed] [Google Scholar]
- 9.Henriksen J., Rowat A.C., Ipsen J.H. Universal behavior of membranes with sterols. Biophys. J. 2006;90:1639–1649. doi: 10.1529/biophysj.105.067652. [DOI] [PMC free article] [PubMed] [Google Scholar]
- 10.Henriksen J., Rowat A.C., Ipsen J.H. Vesicle fluctuation analysis of the effects of sterols on membrane bending rigidity. Eur. Biophys. J. 2004;33:732–741. doi: 10.1007/s00249-004-0420-5. [DOI] [PubMed] [Google Scholar]
- 11.Bruckner R.J., Mansy S.S., Szostak J.W. Flip-flop-induced relaxation of bending energy: implications for membrane remodeling. Biophys. J. 2009;97:3113–3122. doi: 10.1016/j.bpj.2009.09.025. [DOI] [PMC free article] [PubMed] [Google Scholar]
- 12.Yanagisawa M., Imai M., Taniguchi T. Shape deformation of ternary vesicles coupled with phase separation. Phys. Rev. Lett. 2008;100:148102. doi: 10.1103/PhysRevLett.100.148102. [DOI] [PubMed] [Google Scholar]
- 13.Bretscher M.S. Asymmetrical lipid bilayer structure for biological membranes. Nat. New Biol. 1972;236:11–12. doi: 10.1038/newbio236011a0. [DOI] [PubMed] [Google Scholar]
- 14.Devaux P.F. Static and dynamic lipid asymmetry in cell membranes. Biochemistry. 1991;30:1163–1173. doi: 10.1021/bi00219a001. [DOI] [PubMed] [Google Scholar]
- 15.Wang T.Y., Silvius J.R. Cholesterol does not induce segregation of liquid-ordered domains in bilayers modeling the inner leaflet of the plasma membrane. Biophys. J. 2001;81:2762–2773. doi: 10.1016/S0006-3495(01)75919-X. [DOI] [PMC free article] [PubMed] [Google Scholar]
- 16.Baird B., Sheets E.D., Holowka D. How does the plasma membrane participate in cellular signaling by receptors for immunoglobulin E? Biophys. Chem. 1999;82:109–119. doi: 10.1016/s0301-4622(99)00110-6. [DOI] [PubMed] [Google Scholar]
- 17.Kiessling V., Crane J.M., Tamm L.K. Transbilayer effects of raft-like lipid domains in asymmetric planar bilayers measured by single molecule tracking. Biophys. J. 2006;91:3313–3326. doi: 10.1529/biophysj.106.091421. [DOI] [PMC free article] [PubMed] [Google Scholar]
- 18.Collins M.D., Keller S.L. Tuning lipid mixtures to induce or suppress domain formation across leaflets of unsupported asymmetric bilayers. Proc. Natl. Acad. Sci. USA. 2008;105:124–128. doi: 10.1073/pnas.0702970105. [DOI] [PMC free article] [PubMed] [Google Scholar]
- 19.Kiessling V., Wan C., Tamm L.K. Domain coupling in asymmetric lipid bilayers. Biochim. Biophys. Acta. 2009;1788:64–71. doi: 10.1016/j.bbamem.2008.09.003. [DOI] [PMC free article] [PubMed] [Google Scholar]
- 20.Wan C., Kiessling V., Tamm L.K. Coupling of cholesterol-rich lipid phases in asymmetric bilayers. Biochemistry. 2008;47:2190–2198. doi: 10.1021/bi7021552. [DOI] [PubMed] [Google Scholar]
- 21.Collins M.D. Interleaflet coupling mechanisms in bilayers of lipids and cholesterol. Biophys. J. 2008;94:L32–L34. doi: 10.1529/biophysj.107.124362. [DOI] [PMC free article] [PubMed] [Google Scholar]
- 22.Lange Y., Cohen C.M., Poznansky M.J. Transmembrane movement of cholesterol in human erythrocytes. Proc. Natl. Acad. Sci. USA. 1977;74:1538–1542. doi: 10.1073/pnas.74.4.1538. [DOI] [PMC free article] [PubMed] [Google Scholar]
- 23.Steck T.L., Ye J., Lange Y. Probing red cell membrane cholesterol movement with cyclodextrin. Biophys. J. 2002;83:2118–2125. doi: 10.1016/S0006-3495(02)73972-6. [DOI] [PMC free article] [PubMed] [Google Scholar]
- 24.Garg S., Porcar L., Perez-Salas U. Noninvasive neutron scattering measurements reveal slower cholesterol transport in model lipid membranes. Biophys. J. 2011;101:370–377. doi: 10.1016/j.bpj.2011.06.014. [DOI] [PMC free article] [PubMed] [Google Scholar]
- 25.Jo S., Rui H.A., Im W. Cholesterol flip-flop: insights from free energy simulation studies. J. Phys. Chem. B. 2010;114:13342–13348. doi: 10.1021/jp108166k. [DOI] [PubMed] [Google Scholar]
- 26.Bennett W.F.D., MacCallum J.L., Tieleman D.P. Molecular view of cholesterol flip-flop and chemical potential in different membrane environments. J. Am. Chem. Soc. 2009;131:12714–12720. doi: 10.1021/ja903529f. [DOI] [PubMed] [Google Scholar]
- 27.Bennett W.F.D., Tieleman D.P. Molecular simulation of rapid translocation of cholesterol, diacylglycerol, and ceramide in model raft and nonraft membranes. J. Lipid Res. 2012;53:421–429. doi: 10.1194/jlr.M022491. [DOI] [PMC free article] [PubMed] [Google Scholar]
- 28.Voter A.F. Parallel replica method for dynamics of infrequent events. Phys. Rev. B. 1998;57:13985–13988. [Google Scholar]
- 29.Cubuk, E., A. Waterland, and E. Kaxiras. 2012. The predictive integration method for dynamics of infrequent events. American Physical Society, APS March Meeting: S1.189.
- 30.Tieleman D.P., Berendsen H.J.C. Molecular dynamics simulations of a fully hydrated dipalmitoylphosphatidylcholine bilayer with different macroscopic boundary conditions and parameters. J. Chem. Phys. 1996;105:4871–4880. [Google Scholar]
- 31.Höltje M., Förster T., Höltje H.-D. Molecular dynamics simulations of stratum corneum lipid models: fatty acids and cholesterol. Biochim. Biophys. Acta. 2001;1511:156–167. doi: 10.1016/s0005-2736(01)00270-x. [DOI] [PubMed] [Google Scholar]
- 32.Pandit S.A., Chiu S.W., Scott H.L. Cholesterol packing around lipids with saturated and unsaturated chains: a simulation study. Langmuir. 2008;24:6858–6865. doi: 10.1021/la8004135. [DOI] [PMC free article] [PubMed] [Google Scholar]
- 33.Lafleur M., Cullis P.R., Bloom M. Modulation of the orientational order profile of the lipid acyl chain in the L alpha phase. Eur. Biophys. J. 1990;19:55–62. doi: 10.1007/BF00185086. [DOI] [PubMed] [Google Scholar]
- 34.Hofsaβ C., Lindahl E., Edholm O. Molecular dynamics simulations of phospholipid bilayers with cholesterol. Biophys. J. 2003;84:2192–2206. doi: 10.1016/S0006-3495(03)75025-5. [DOI] [PMC free article] [PubMed] [Google Scholar]
- 35.Chiu S.W., Jakobsson E., Scott H.L. Cholesterol-induced modifications in lipid bilayers: a simulation study. Biophys. J. 2002;83:1842–1853. doi: 10.1016/S0006-3495(02)73949-0. [DOI] [PMC free article] [PubMed] [Google Scholar]
- 36.Ferguson A.L., Panagiotopoulos A.Z., Debenedetti P.G. Nonlinear dimensionality reduction in molecular simulation: The diffusion map approach. Chem. Phys. Lett. 2011;509:1–11. [Google Scholar]
- 37.Veiga M.P., Arrondo J.L.R., Marsh D. Interaction of cholesterol with sphingomyelin in mixed membranes containing phosphatidylcholine, studied by spin-label ESR and IR spectroscopies. A possible stabilization of gel-phase sphingolipid domains by cholesterol. Biochemistry. 2001;40:2614–2622. doi: 10.1021/bi0019803. [DOI] [PubMed] [Google Scholar]
- 38.Cheng H.T., Megha, London E. Preparation and properties of asymmetric vesicles that mimic cell membranes: effect upon lipid raft formation and transmembrane helix orientation. J. Biol. Chem. 2009;284:6079–6092. doi: 10.1074/jbc.M806077200. [DOI] [PMC free article] [PubMed] [Google Scholar]
- 39.Chiang Y.W., Costa-Filho A.J., Freed J.H. Dynamic molecular structure and phase diagram of DPPC-cholesterol binary mixtures: a 2D-ELDOR study. J. Phys. Chem. B. 2007;111:11260–11270. doi: 10.1021/jp0732110. [DOI] [PubMed] [Google Scholar]
- 40.Chiantia S., Schwille P., London E. Asymmetric GUVs prepared by MβCD-mediated lipid exchange: an FCS study. Biophys. J. 2011;100:L1–L3. doi: 10.1016/j.bpj.2010.11.051. [DOI] [PMC free article] [PubMed] [Google Scholar]
Associated Data
This section collects any data citations, data availability statements, or supplementary materials included in this article.