

Abstract
Voltage-dependent calcium channels (CaV) enable the inward flow of calcium currents for a wide range of cells. CaV1 and CaV2 subtype α1 subunits form the conducting pore using four repeated membrane domains connected by intracellular linkers. The domain I-II linker connects to the membrane gate (IS6), forming an α-helix, and is bound to the CaVβ subunit. Previous studies indicated that this region may or may not form a continuous helix depending on the CaV subtype, thereby modulating channel activation and inactivation properties. Here, we used small-angle x-ray scattering and ensemble modeling analysis to investigate the solution structure of these linkers, extending from the membrane domain and including the CaVβ-binding site, called the proximal linker (PL). The results demonstrate that the CaV1.2 PL is more flexible than the CaV2.2 PL, the flexibility is intrinsic and not dependent on CaVβ binding, and the flexibility can be most easily explained by the presence of conserved glycines. Our analysis also provides a robust example of investigating protein domains in which flexibility plays an essential role.
Introduction
Voltage-dependent calcium channels (CaV) selectively allow the passage of calcium ions through cellular plasma membranes down the electrochemical gradient. They play essential roles in many physiological processes, such as excitation-contraction coupling, excitation-secretion, excitation-transcription, and action-potential modulation (1). Two subfamilies, CaV1 and CaV2, activate upon a significant membrane depolarization, whereas the CaV3 subfamily opens with a much smaller membrane depolarization. Thus, these subfamilies function in different physiological regimes. The whole family is expressed in a wide variety of tissues and cell types (both excitable and nonexcitable). CaV2 channels act in neurons in synaptic transmission, and CaV1 channels function prominently in skeletal and cardiac muscle cells.
Structurally, the CaV1 and CaV2 channels are comprised of several subunits. The α1 subunit serves as the membrane pore-forming component and has four homologous membrane domains. Each of the four α1 domains contains six helical segments, S1–S6. The first four segments fold into a voltage sensor domain, and the last two form the ion-conduction channel (1). Connecting the four membrane domains are intracellular linkers, and capping them are the N- and C-termini, also located intracellularly. These linkers and termini range in size from 100 to 600 residues. They regulate channel activity and serve as molecular interfaces for many signaling proteins.
The cytoplasmic accessory β subunit (CaVβ) associates constitutively with α1 and directs localization of the CaV complex to the plasma membrane (2). Importantly, CaVβ affects many channel biophysical properties, including open probability and the kinetics of activation and inactivation (2). CaVβ has two structured domains: one is SH3-like and the second is a guanylate kinase (GuK) motif. The GuK domain interacts with high affinity with an amphipathic helix from α1, called the alpha interaction domain (AID), located in the membrane domain I-II cytoplasmic linker (3–5). This interaction is assumed to modulate the channel’s biophysical properties through mechanical transduction to the α1 domain I S6 pore helix (IS6) (2,4,5).
Consistent with this notion, earlier crystallographic studies suggested that the I-II linker, beginning from IS6 and extending through the AID sequence, adopts a helical conformation, and that this helix formation is aided by association with CaVβ(4,5). This extended helix would then affect biophysical channel properties such as inactivation kinetics. Further functional studies confirmed this idea by introducing helix-breaking glycines into the CaV1.2 I-II linker and including effects on Gβγ channel modulation (6–9).
More recent structure-function studies of this region in the α1 subunit have shown that the structure of the region ranging from the end of IS6 and the AID in the I-II linker, i.e., the proximal linker (PL), depends on the CaV subtype (10,11). Crystallographic and circular dichroism spectroscopic results demonstrated that an absolutely conserved glycine found in CaV1 channels shortens the postulated extended PL helix, whereas in CaV2 channels the different residue identity preserves an extended helical conformation. Electrophysiological recordings of mutations for this conserved amino acid position in the two CaV subtypes (subtypes 1 and 2) had very clear and complementary effects on inactivation properties for the respective channels. This biophysical behavior was largely preserved in the presence and absence of CaVβ, suggesting that the intrinsic structure of the PL imparts these properties. Here, we examined the PL of both subtypes, using small-angle x-ray scattering (SAXS), to obtain more detailed structural information about this important region’s structure in solution. We employed ensemble-based modeling methods to interpret the SAXS results and improve, elaborate, and validate the earlier structural findings. The results show that PL conformational flexibility does indeed depend on the CaV α1 subtype.
Materials and Methods
Molecular cloning
For SAXS, Helix-PL-AID constructs were prepared as previously described (10). In short, PL-AID DNA fragments encoding rabbit CaV1.2 residues 436–475 or rabbit CaV2.2 357–396 were inserted into pET-28a vector (Novagen) downstream of a cassette encoding a HisTag, maltose-binding protein (MBP), a TEV protease site, and a sequence encoding an α-helical peptide (3xAAKAAE). For the coexpression of CaVβ GuK with the above vectors, a DNA fragment encoding residues 203–422 of CaVβ2 was ligated between the NcoI and NotI restriction sites of a pCDF-Duet vector (Novagen).
Protein expression and purification
All expression vectors were transformed into Escherichia coli Tuner (DE3) Codon Plus competent cells. Cells were grown in 2xYT media plus antibiotics. Expression was induced with isopropylthio-β-galactoside at 16°C. Cells were harvested 12–16 hr after induction and stored at −80°C.
Helix-PL-AID proteins were purified as previously described (10). For purification of the GuK/Helix-PL-AID protein complexes, cells suspended in phosphate buffer (50 mM sodium phosphate pH 8.0, 0.3 M NaCl) plus 0.1% Triton X-100, 15 U/ml DNase, lysozyme, and 1 mM phenylmethanesulfonylfluoride were lysed by a microfluidizer and subjected to 1 hr of centrifugation at 38,700 g. The soluble fraction was purified by Ni2+ chelate chromatography, removal of the HisTag by TEV proteolysis, and cation-exchange (SP-Sepharose; GE Healthcare) and size-exclusion (Superdex-75 HiPrep; GE Healthcare) column chromatography. The final buffer conditions for all SAXS-measured proteins (unless otherwise indicated) were 20 mM Tris-HCl pH 8.0, 0.25 M NaCl, 5% glycerol, 1 mM dithiothreitol.
SAXS data collection and processing
We first measured the samples using a Pilatus 300K detector (Dectris, Baden, Switzerland) and a Xenocs GeniX Low Divergence CuKα radiation source setup with scatterless slits (12) at Tel-Aviv University to determine optimal solution conditions and conduct a preliminary analysis. We performed the final SAXS experiments at the European Synchrotron Radiation Facility (Grenoble, France) (13) ID14-3 beamline using a robotic sample changer with a flow-through capillary setup. Images were recorded with a Pilatus 1M detector (Dectris). The sample-detector distance was 2.43 m with the wavelength tuned to 0.931 Å, yielding a measurement q range of 0.005–0.6 Å−1. A uniform acquisition time of 100 s was used for all samples, and divided into 10 consecutive frames for radiation damage detection. The final SAXS profiles were automatically averaged from integrated images that did not display radiation damage. Buffer was measured under identical conditions before and after sample measurement. Analysis was conducted on buffer-subtracted profiles. Several concentrations in the range of 0.5–3 mg/ml were measured. Each measured concentration was manually checked for radiation damage and aggregation, and the highest undamaged concentration was selected for further analysis.
Subtracted scattering profiles were analyzed with procedures implemented in the ATSAS (14–16) package. I(0) and Rg were evaluated using the Guinier approximation (17,18). Sample oligomerization was evaluated using I(0) with BSA as a molecular weight standard. P(r) distributions were calculated using GNOM (15).
Structural modeling of the SAXS curves
To examine the flexibility of the proteins by selection of conformational ensembles, we employed the ensemble optimization method (EOM) software (20). This method selects a subset of conformations from a large, randomly generated pool of conformations. Each conformation is generated by linking predefined rigid domains with randomly constructed linkers using RANCH in EOM software. The method evaluates each conformation by simulating its scattering profile as calculated by CRYSOL (21). Selection is performed using a genetic algorithm as implemented in GAJOE in EOM software, which minimizes the discrepancy between the mixed scattering profile of the conformational subset and the measurement profile, where χ2 is a measure of this discrepancy.
Models of rigid domains in the molecules were extracted from CaV1.2 and CaV2.2 I-II linker/CaVβ2 crystal structures (10). Other parts that were not present in these crystal structures but were also defined as rigid (e.g., the 3xAAKAAE helix region and parts of CaVβ) were modeled using the I-Tasser server (22). RANCH was configured to generate a pool of 10K conformations for the CaV1.2 fragment and 20K conformations for the two CaV linker/GuK complexes. All conformation pools were generated with native-like chains in the flexible regions, conforming to the Ramachandran plot. The conformation pools were then selected from subsets of 50 and 100 conformations for the fragments and complexes respectively, using GAJOE.
Results
CaV1.2 and 2.2 proximal I-II linker regions are both flexible in solution and exhibit divergent structural features
Recent crystallographic studies of the CaV1.2 and 2.2 I-II linker/CaVβ complexes have revealed structural variation between the CaV1 and CaV2 PL regions. An α-helical conformation observed for most of the CaV2.2 PL was missing in the electron density of the CaV1.2 I-II linker/CaVβ complex structure, strongly implying a less ordered structure and considerable flexibility. The PL conformation was shown to have important functional consequences in both channel subtype contexts (10). To further explore these structural differences and relate them to VDCC functional properties, we probed the structural properties of isolated PL fragments in solution using SAXS.
In the intact channel complex, the PL region is flanked by the channel transmembrane α-helix IS6 on its N-terminal end and the α-helical AID on its C-terminal end (Fig. 1). To examine the PLs’ structure while preserving this conformational environment, we expressed each of the PLs downstream to a known high-helical-propensity peptide (see Materials and Methods, Helix-PL-AID) and upstream of the AID. Examinations of these constructs using circular dichroism spectroscopy demonstrated a significantly higher α-helix signal for the Helix-CaV2.2 PL-AID protein (10). In this study, we prepared a biochemical preparation that represents a more realistic biological context by coexpressing the above constructs with the β subunit’s GuK domain, which robustly binds the AID and induces its α-helical conformation (4).
Figure 1.
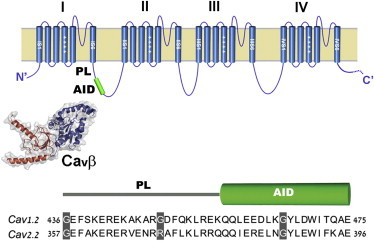
CaVα1 subunits and the location of the I-II PL. Top: Cartoon depiction of CaVα1 subunits and the location of the I-II PL and AID. Bottom: Schematic of the Helix-PL-AID fragment used for SAXS analysis. Sequence alignment between the rabbit CaV1.2 and CaV2.2 PL-AID regions.
The CaV1.2 and CaV2.2 Helix-PL-AID/GuK complexes are similar in mass (Table 1) and amino acid composition (Fig. 1). As shown in Table 1, Guinier analysis of their SAXS measurements resulted in similar values. A comparison of the shapes of the calculated pair distance (p(r)) distribution functions for these protein complexes reveals noticeable differences (Fig. 2). The CaV2.2 complex shows increased probability centered at 25 Å and decreased probability centered at 75 Å when compared with CaV1.2. The distributions’ long tails are a clear indication that the proteins measured are not entirely globular, although the GuK structure dominates the pair distribution curve.
Table 1.
Summary of SAXS analysis
| Protein | Rga (Å) | Rgb (Å) | RgEOMc (Å) | Dmax (Å) | Vporod | Mw (Mwseq) (kDa) | χR | χEOM |
|---|---|---|---|---|---|---|---|---|
| CaV1.2 | 21.9 ± 0.6 | 23.3 ± 0.3 | 22.7 ± 3.03d | 76 | 22.0 | 6.75 (6.7) | 1.68 | 0.82 |
| CaV2.2 | 25.5 ± 2.0 | 25.3 ± 0.4 | 91 | 32.6 | 11.5 (6.9) | |||
| CaV1.2 / GuK | 28.8 ± 0.2 | 30.7 ± 0.3 | 27.8 ± 1.33d | 101 | 61.4 | 32.6 (32.3) | 2.53 | 1.32 |
| CaV2.2 / GuK | 29.1 ± 0.1 | 32.0 ± 0.3 | 27.8 ± 0.85d | 102 | 61.8 | 38.9 (32.5) | 4.06 | 3.19 |
Values are represented as the mean ± SD. Dmax is the maximum size calculated by GNOM. Mw is the molecular mass calculated from Guinier extrapolation to I(0) and comparison with a standard BSA sample. Note the exaggerated value calculated for CaV2.2, suggesting a mixture of monomers and dimers. Higher concentrations yielded higher Mw. Mwseq is the theoretical mass calculated from construct sequence. The discrepancy between experimental data and the scattering curves calculated from the models is denoted as χR for fitting the rigid-body extended Helix-PL-AID/GuK models and as χEOM for the models obtained by EOM (using the DisEmbl input).
Rg determined from Guinier analysis.
Rg derived from GNOM P(r) distribution.
Rg derived from EOM Rg distribution.
SD of the Rg distribution.
Figure 2.
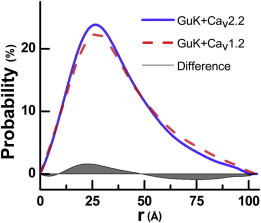
Pair distribution probability functions, P(r), of CaV2.2 and CaV1.2 in complex with GuK. The GuK-helix-CaV2.2PL-AID complex (continuous line) is shown to be more compact than the GuK-Helix-CaV1.2PL-AID complex (dashed line). The gray area depicts the subtracted probabilities, showing increased probability in shorter distances and decreased probability in longer distances. This is indicative of a more compact conformation for the CaV2.2 complex.
Using the crystal structures and the high probability of the α-helical conformation of the Helix region, we readily generated models of the Helix-PL-AID/GuK complexes. Notably, Dmax values of both complexes, obtained from respective p(r) distributions (Fig. 2; Table 1), are ∼100 Å. This value matches the computed Dmax for both complexes when the Helix-PL-AID fragments are modeled as extended α-helices. However, upon fitting to the experimental scattering curves, calculated scattering profiles of such extended α-helical models result in poor χ-values (Fig. S1 in the Supporting Material). Supported by the crystallographic observations and sequence-based secondary-structure predictions, this low-quality fit may be explained by the inherent flexibility of domains in the complex.
Evidence for the flexibility of I-II linker fragments may be inferred directly from the solution SAXS measurements of the CaV1.2 and CaV2.2 Helix-PL-AID fragments alone. In Fig. 3, A and B, we present Kratky plots (I·q2 vs. q) that display a monotonic increase with q for both fragments. This increase is characteristic of a disordered protein lacking distinguishable structure in solution (23). We note that extrapolation at q→0 of the SAXS intensity for the CaV2.2 Helix-PL-AID fragment suggests that even at the lowest concentration (0.49 mg/ml), the fragment tends to oligomerize. Nevertheless, as shown in its Kratky representation, the CaV2.2 Helix-PL-AID dimers are also flexible in solution. Taken together, these results lead us to conclude that the Helix-PL-AID/GuK proteins cannot be appropriately modeled by a single average conformation, but rather by an ensemble of conformations that the proteins sample while in solution.
Figure 3.
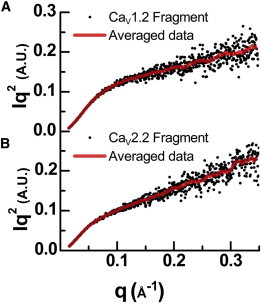
(A and B) Kratky plots of the (A) CaV1.2 and (B) CaV2.2 fragments. Concentrations are 1 mg/ml and 0.4 mg/ml, respectively. The monotonous increase with q is a signature of disordered proteins. Scattered dots indicate the measured data, and lines display the smoothed running average.
Modeling disorder of the CaV1.2/2.2 Helix-PL-AID fragments
To model the proteins’ disorder, we first analyzed the Helix-PL-AID protein sequences using the DisEMBL method (24), employing its hot-loops score, which determines a lack of ordered secondary structure. As illustrated in Fig. 4, a disorder score was assigned per residue, with a region considered as disordered when its smoothed score passed a predefined threshold. The CaV1.2 fragment exhibits two extended disordered segments (Fig. 4 A). In contrast, the CaV2.2 fragment exhibits a single extended disordered segment (Fig. 4 B). Both CaV1.2 and CaV2.2 also exhibit shorter disordered features at the fragment termini, which are not relevant to our analysis.
Figure 4.
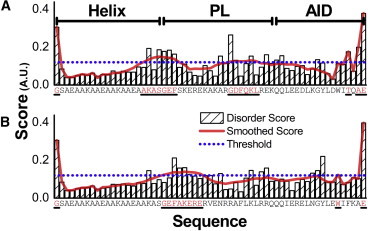
(A and B) DisEMBL hot-loops prediction score for the (A) CaV1.2 and (B) CaV2.2 fragments. Striped bars: DisEMBL hot loops per residue score. Solid line: DisEMBL hot-loops scores smoothed with an eight-residue sliding window. Dotted line: Threshold for marking residues as disordered. Bars are labeled with the corresponding residue. Residues marked as disordered are highlighted and underlined. The CaV1.2 score indicates two major disorder regions: one is entirely contained within the PL domain and the other overlaps it. The CaV2.2 score indicates a single major disordered region at the start of the PL domain. The threshold is determined by the prediction algorithm’s expectation value for random input 0.86 multiplied by 1.4 for the reduction of false positives. Further details can be found in Linding et al. (24).
Having assigned the disordered regions in the Helix-PL-AID fragments, we used the EOM software (20) to search for an optimal ensemble of conformations that would best depict the measured scattering data. The EOM method uses preselected definitions of the rigid structural domains of a protein to generate a large pool of models with random conformations between them. A genetic algorithm is then used to select an optimized ensemble of configurations from this pool that best fits the experimental data.
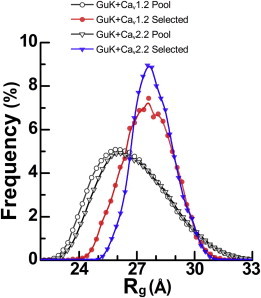
Fig. 5 shows SAXS data and EOM fits for the modeled complexes using DisEMBL to delimit the flexible regions, along with a graphic depiction of the respective selected pools. The respective Rg and Dmax distributions are shown in Fig. 6, where both the preselected pool of conformations (squares) and the optimized ensemble (circles) are depicted. Although the GuK/CaV1.2 and GuK/CaV2.2 Helix-PL-AID Rg distributions have a similar mean (∼27.9 Å), they differ in their distribution width, with standard deviations (SDs) of 2.8 and 1.9 Å, respectively. Moreover, the Dmax distributions show a mean of 99 and 96 Å for GuK/CaV1.2 and GuK/CaV2.2 Helix-PL-AID, respectively. Interestingly, the Dmax distribution for GuK/CaV1.2 has a distinct peak around 106 Å, whereas the GuK/CaV2.2 complex has a maximal Dmax frequency at 87 Å with comparable frequencies up to 105 Å. This difference suggests that the CaV2.2 fragment has a propensity to be more compact than CaV1.2, sampling multiple extended and compact (i.e., folded) configurations while in complex with GuK. Therefore, we conclude that CaV2.2 and CaV1.2 fragments have different structures in solution when the DisEMBL flexibility assignments are employed.
Figure 5.
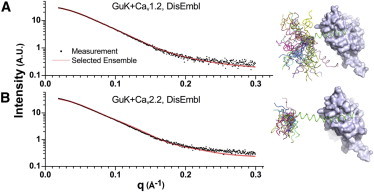
(A and B) SAXS intensity profiles for (A) GuK-CaV1.2 and (B) GuK-CaV2.2 complexes. The measured scattering intensities (scattered dots) are well described by an ensemble of conformations fit (line) using the DisEMBL prediction for disordered regions and the crystal structure for rigid regions. Solution background is subtracted in all measurements. The χ-values of the fittings were 1.32 and 3.2 for GuK-CaV1.2 and GuK-CaV2.2, respectively. The difference in χ-values is attributed to a difference in the measurement errors, as seen in the figure. To the right of the curves is a depiction of the respective PL ensembles superimposed using the bound GuK domain, shown as a surface representation.
Figure 6.
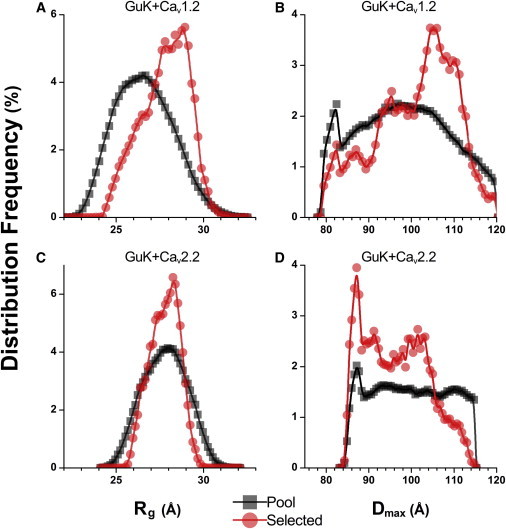
Rg and Dmax distribution frequencies of EOM fitting for GuK in complex with CaV1.2 and CaV2.2. Square symbols denote distributions for 10,000 unique pool conformations, automatically constructed prior to fitting. Circle symbols denote distributions for 1000 nonunique ensemble conformations selected by EOM fitting. (A and C) Distributions for Rg. (B and D) Distributions for Dmax. (A and B) GuK in complex with Helix-CaV1.2 PL-AID. (C and D) GuK in complex with Helix-CaV2.2 PL-AID. The Rg and Dmax distributions for the GuK-CaV1.2 complex shift toward higher values relative to the GuK-CaV2.2 complex and the naive constructed pool. This indicates that GuK-CaV1.2 prefers longer conformations, whereas GuK-CaV 2.2 has little effect on probable conformations, with some preference toward a bent conformation for fully extended helices, as seen in the crystal structure.
Minimal model for CaV1.2 fragment flexibility and disorder
As may be noticed in Fig. 4, all of the major disordered segments predicted by DisEMBL contain glycine residues. Glycine is known as a disorder-promoting residue due to its lack of steric interference from the side-chain group (25–27). This observation suggests that the fragments’ disorder might be modeled most simply by rigid domains with joints at the glycine sites.
To locate the dominant disorder-promoting site in CaV1.2, we conducted additional EOM runs with minimal disorder regions having only the glycine residues as flexible joints. The CaV1.2 Helix-PL-AID contains three glycine sites (G436, G449, and G466) that may potentially affect fragment flexibility (Fig. 4). We constructed EOM disorder models with combinations of one, two, and three glycine sites as flexible joints, not in complex with the GuK, and compared their results with the EOM run using the DisEMBL model.
The result of these EOM runs indicate that most of the flexibility required to fit the measured data can be attributed to single glycine joints at either G436 or G449, with χ = 0.89 and 0.87, respectively, compared with 1.34 for the G466 single joint. Moreover, adding an additional degree of freedom results in a slightly better fit, with the best combination of two joints being G436 and G449 with χ = 0.82. Finally, adding the third joint at G466 yields no real improvement with χ = 0.819.
Representative Rg and Dmax distributions for the glycine joint EOM runs are shown in Fig. 7. An interesting observation about these distributions is that they are all biphasic, with two distinct configurations, but the phases flatten as additional degrees of freedom (i.e., flexible joints or hinges) are added. The similarity between the distributions and the quality of the fits suggests that indeed most of the flexibility stems from conformational freedom at or near the glycine. We conclude that a model invoking flexibility at just two glycines, G436 and G449, in CaV1.2 is as consistent with the scattering curve as the model based on DisEMBL.
Figure 7.
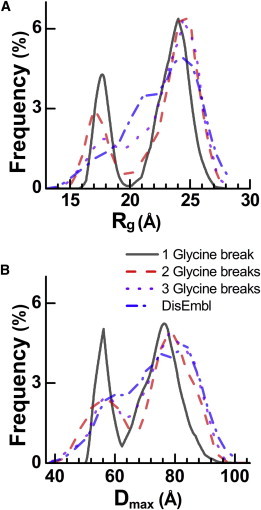
(A and B) Comparison of Rg (A) and Dmax (B) distribution frequencies from EOM fitting for several disorder models of CaV1.2. Models shown: a single glycine joint at G449 (solid line); two glycine joints at G436, G449 (dashed line); three glycine joints at G436, G449, and G466 (dotted line); and DisEMBL predicted disorder based on the hot-loops score (dash-dotted line).
To validate the minimal model consisting of two flexible joints, we conducted combinatorial EOM runs for all possible double-jointed models. The quality of the EOM fits is shown in Fig. 8, depicted as a heat map. The best EOM fits (white color) are centered in the PL region (green lines). Interestingly, the best EOM fits are located along a diagonal, corresponding to joints separated by 13 residues (white lines). Although the EOM method is not expected to provide single-residue resolution, the EOM map is consistent with flexibility imparted by the glycine residues (G436 and G449) in the PL region also separated by 13 amino acids. Moreover, the map clearly shows that only a few selected flexible joint locations, within the framework of a two-joint model, result in the highest-quality fits.
Figure 8.
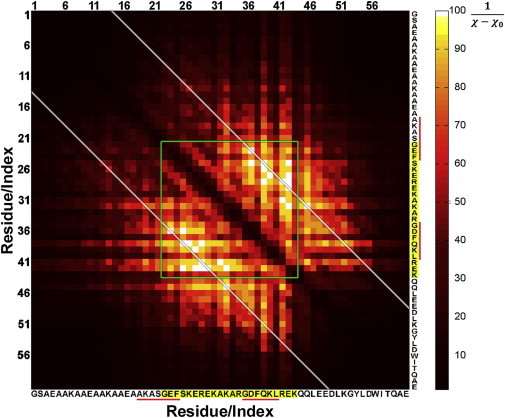
EOM fit map of combinatorial EOM runs based on two flexible joints of the CaV1.2 fragment. For clarity, each point in the map is color-coded according to , where represents the discrepancy between the EOM fit and the experimental data, and is set to 0.809. The correlation map is symmetric about the main diagonal with both axes having the CaV1.2 fragment amino acid sequence. Pairs of flexible joints within the PL region (highlighted sequence) are enclosed within green lines. The white diagonal lines correspond to a 13 amino acid separation between two joints that captures the best EOM fits and is within proximity to the predicted DisEmbl flexible regions (underlined in red).
Allowing maximum PL disorder results in more conformations for CaV1.2 than for CaV2.2
In an additional comparative test of conformational ensembles selected for CaV1.2 and CaV2.2 linker fragments, we used EOM to allow maximal disorder for the whole PL region in both proteins. Because the GuK domain and the Helix region are identical between models, and both AID regions are very highly homologous in length and conformation, these EOM runs had essentially identical input models. The similarity in input can be detected by the similar Rg distribution of the EOM-generated pools (Fig. 9, open symbols). Interestingly, although the experimental SAXS curves exhibit similar Rg values, the Rg distributions for the selected EOM ensembles point to a wider distribution for the CaV1.2 fit. These results are in line with the higher predicted flexibility and lower helical content measured for the CaV1.2 PL (10).
Figure 9.
Rg distribution frequencies calculated from the EOM-selected ensemble of conformations for the CaV2.2 fragment in complex with GuK, and for the CaV1.2 fragment in complex with GuK when the whole PL is modeled as flexible. EOM pool Rg distributions are denoted as open symbols, with GuK-CaV1.2 as circles and GuK-CaV2.2 as triangles. Selected conformations for GuK-CaV1.2 (solid circles) span a wider range of Rg values, with a significant population of conformations at lower Rg values compared with GuK-CaV2.2 (solid triangles). The Rg pool distributions appear roughly the same.
Effect of the GuK domain on CaV1.2 and CaV2.2 ensemble conformations
Next, we considered the effect of GuK binding on Helix-PL-AID conformations. To evaluate this effect, we extracted Helix-PL-AID fragment conformations from EOM-selected ensembles for the respective GuK/CaV1.2 and 2.2 complexes. For these extracted conformations, we calculated the electron density Rg using CRYSOL (21). The resulting Rg distribution is presented in Fig. 10 and compared with the Rg distribution of the EOM-selected ensemble for the SAXS measurement of CaV1.2 fragment alone (dashed line). A comparison of the distribution derived from the CaV1.2 fragment alone and the distribution derived from the complex with GuK indicates that the GuK domain has little impact on the fragment’s conformations. We note a minor reduction in the frequency of compact conformations due to steric interference, evident around Rg distributions of ∼15 Å. When we compare the extracted Rg distributions of CaV1.2 and CaV2.2 fragments in complex with GuK (Fig. 10, solid and dotted lines, respectively), we observe a sharper distribution with a pronounced peak for CaV2.2. The means of the distributions for both CaV fragments are similar at 23.6 and 23.9 Å. However, a wider Rg distribution is seen for CaV1.2. We thus conclude that the CaV1.2 PL has considerable intrinsic flexibility that is not dramatically modified by the binding of the GuK domain and presumably CaVβ.
Figure 10.
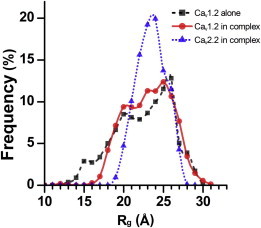
Effect of the GuK domain on CaV1.2 and CaV2.2 fragment conformation. Plotted are the Rg distribution frequencies of the isolated Helix-PL-AID components derived from the EOM-selected ensemble of conformations for the CaV2.2 fragment in complex with GuK (dotted line) and the CaV1.2 fragment as an unbound monomer (dashed line) or in complex with GuK (solid line). The CaV2.2 fragment exhibits a preference for longer conformations relative to CaV1.2.
Discussion
Our work demonstrates the degree of structural flexibility for two CaV channel I-II PLs. These properties appear to have functional implications. Previous work highlighted the role played by I-II PL flexibility in channel inactivation and activation (10). The CaV1.2 I-II PL exists in a wide range of configurations in solution and appears to be more flexible than its CaV2.2 I-II PL counterpart, as evaluated by SAXS. Although these SAXS studies provide direct information regarding the PLs’ disorder in solution, the extent of the disorder or flexibility in the context of intact channel remains unknown. Nonetheless, our previous functional studies (10) correlate well with our present findings.
The intrinsic structural differences between the CaV subfamilies are related directly to the primary sequence structure. In our earlier study, we closely examined the sequence conservation of the proximal I-II linker for a wide range of organisms, including the primitive multicellular metazoan Trichoplax adherens, and discerned a high degree of conservation within CaV1 and CaV2 subfamilies, including the absolutely conserved Gly in CaV1 channels (see Fig. 4 in Almagor et al. (10)). Hence, we assume that the intrinsic structural differences in this region are relevant for a wide variety of organisms.
The crystallographic studies indicate that at least for CaV2, the PL adopts a single α-helix domain, a structural motif that was only recently discerned (28–30). This motif is found in a variety of myosins and other proteins, sometimes encoding helices with lengths of >300 Å. In myosins, the motif serves as a stiff lever arm, whereas in other proteins it may serve as a spacer. A typical sequence signature has been deduced whereby salt bridges between the positioned charged residues form to strengthen the helix (31,32). Although the PL does not fit the canonical sequence signature, it nonetheless is enriched in charged residues that should form similar salt bridges. Whether the PL behaves as a lever arm between IS6 and CaVβ or as a spacer or some other structural element remains to be determined.
The flexibility of the PLs presents a challenging characterization task, as a limited number of experimental techniques are suitable for measuring these samples in solution and gaining structural insights. Our SAXS data and EOM analysis clearly show distinct differences between the selected conformations of CaV1.2 and CaV2.2 that match the experimental data even when similar conformational freedom is given in the initial pool for the genetic algorithm (Fig. 9). Therefore, we allocated the minimal conformational freedom required to reconstruct the solution SAXS data. This approach refines the dominant disorder-promoting sites in the PLs that could be tested in future studies.
In contrast to a recent working model (2), these PL regions retain a range flexibility while they are surrounded by helix-promoting structures, even when bound to the GuK domain (Fig. 10). The flexibility can be modeled minimally with joints at absolutely conserved glycine residues, emphasizing these residues’ functional importance. This minimal model may provide some mechanistic insight into known diseases, such as Timothy syndrome (33), which is caused by point mutations at the I-II PL’s glycine residues (TS1: human G406R, rabbit G436R) (10,11). Nonetheless, the exact physical mechanism by which this flexibility confers certain electrophysiological properties to the channel, including the influence of the GuK domain-containing CaVβ protein, remains to be determined. We previously suggested a mechanism whereby the flexibility frees the IS6 for motion while a rigid helix and the bound CaVβ constrain it, acting as a brake (10). These hypotheses require further testing.
Acknowledgments
We thank the beamline staff at the European Synchrotron Radiation Facility, Moshe Giladi, and Roi Strulovich for assistance with data collection and analysis.
This work was supported by a Deutsch-Israelische Projektkooperation/Deutsche Forschungsgemeinschaft grant to J.A.H. R.B. received support from the Israel Science Foundation (grant 571/11), the European Community’s 7th Framework Programme (293402), and the Sackler Institute for Biophysics at Tel Aviv University.
Contributor Information
Joel A. Hirsch, Email: jhirsch@post.tau.ac.il.
Roy Beck, Email: roy@post.tau.ac.il.
Supporting Material
References
- 1.Jones S.W. Overview of voltage-dependent calcium channels. J. Bioenerg. Biomembr. 1998;30:299–312. doi: 10.1023/a:1021977304001. [DOI] [PubMed] [Google Scholar]
- 2.Buraei Z., Yang J.A. The β subunit of voltage-gated Ca2+ channels. Physiol. Rev. 2010;90:1461–1506. doi: 10.1152/physrev.00057.2009. [DOI] [PMC free article] [PubMed] [Google Scholar]
- 3.Chen Y.H., Li M.H., Yang J. Structural basis of the α1-β subunit interaction of voltage-gated Ca2+ channels. Nature. 2004;429:675–680. doi: 10.1038/nature02641. [DOI] [PubMed] [Google Scholar]
- 4.Opatowsky Y., Chen C.C., Hirsch J.A. Structural analysis of the voltage-dependent calcium channel β subunit functional core and its complex with the α1 interaction domain. Neuron. 2004;42:387–399. doi: 10.1016/s0896-6273(04)00250-8. [DOI] [PubMed] [Google Scholar]
- 5.Van Petegem F., Clark K.A., Minor D.L., Jr. Structure of a complex between a voltage-gated calcium channel β-subunit and an α-subunit domain. Nature. 2004;429:671–675. doi: 10.1038/nature02588. [DOI] [PMC free article] [PubMed] [Google Scholar]
- 6.Zhang Y., Chen Y.H., Yang J. Origin of the voltage dependence of G-protein regulation of P/Q-type Ca2+ channels. J. Neurosci. 2008;28:14176–14188. doi: 10.1523/JNEUROSCI.1350-08.2008. [DOI] [PMC free article] [PubMed] [Google Scholar]
- 7.Arias J.M., Murbartián J., Perez-Reyes E. Transfer of β subunit regulation from high to low voltage-gated Ca2+ channels. FEBS Lett. 2005;579:3907–3912. doi: 10.1016/j.febslet.2005.06.008. [DOI] [PubMed] [Google Scholar]
- 8.Vitko I., Shcheglovitov A., Perez-Reyes E. Orientation of the calcium channel β relative to the α(1)2.2 subunit is critical for its regulation of channel activity. PLoS ONE. 2008;3:e3560. doi: 10.1371/journal.pone.0003560. [DOI] [PMC free article] [PubMed] [Google Scholar]
- 9.Findeisen F., Minor D.L., Jr. Disruption of the IS6-AID linker affects voltage-gated calcium channel inactivation and facilitation. J. Gen. Physiol. 2009;133:327–343. doi: 10.1085/jgp.200810143. [DOI] [PMC free article] [PubMed] [Google Scholar]
- 10.Almagor L., Chomsky-Hecht O., Hirsch J.A. The role of a voltage-dependent Ca2+ channel intracellular linker: a structure-function analysis. J. Neurosci. 2012;32:7602–7613. doi: 10.1523/JNEUROSCI.5727-11.2012. [DOI] [PMC free article] [PubMed] [Google Scholar]
- 11.Almagor L., Chomsky-Hecht O., Hirsch J.A. Ca(V)1.2 I-II linker structure and Timothy syndrome. Channels (Austin) 2012;6:468–472. doi: 10.4161/chan.22078. [DOI] [PMC free article] [PubMed] [Google Scholar]
- 12.Li Y.L., Beck R., Divinagracia M. Scatterless hybrid metal-single-crystal slit for small-angle X-ray scattering and high-resolution X-ray diffraction. J. Appl. Cryst. 2008;41:1134–1139. [Google Scholar]
- 13.Gabadinho J., Beteva A., McSweeney S.M. MxCuBE: a synchrotron beamline control environment customized for macromolecular crystallography experiments. J. Synchrotron Radiat. 2010;17:700–707. doi: 10.1107/S0909049510020005. [DOI] [PMC free article] [PubMed] [Google Scholar]
- 14.Konarev P.V., Volkov V.V., Svergun D.I. PRIMUS: a Windows PC-based system for small-angle scattering data analysis. J. Appl. Cryst. 2003;36:1277–1282. [Google Scholar]
- 15.Svergun D. Determination of the regularization parameter in indirect-transform methods using perceptual criteria. J. Appl. Cryst. 1992;25:495–503. [Google Scholar]
- 16.Petoukhov M.V., Konarev P.V., Svergun D.I. ATSAS 2.1—towards automated and web-supported small-angle scattering data analysis. J. Appl. Cryst. 2007;40:s223–s228. [Google Scholar]
- 17.Svergun D.I., Koch M.H.J. Small-angle scattering studies of biological macromolecules in solution. Rep. Prog. Phys. 2003;66:1735–1782. [Google Scholar]
- 18.Guinier A. La diffraction des rayons X aux tres petits angles: application a l’etude de phenomenes ultramicroscopiques. Ann. Phys. (Paris) 1939;12:161–237. [Google Scholar]
- 19.Reference deleted in proof.
- 20.Bernadó P., Mylonas E., Svergun D.I. Structural characterization of flexible proteins using small-angle X-ray scattering. J. Am. Chem. Soc. 2007;129:5656–5664. doi: 10.1021/ja069124n. [DOI] [PubMed] [Google Scholar]
- 21.Svergun D., Barberato C., Koch M.H.J. CRYSOL—a program to evaluate x-ray solution scattering of biological macromolecules from atomic coordinates. J. Appl. Cryst. 1995;28:768–773. [Google Scholar]
- 22.Roy A., Kucukural A., Zhang Y. I-TASSER: a unified platform for automated protein structure and function prediction. Nat. Protoc. 2010;5:725–738. doi: 10.1038/nprot.2010.5. [DOI] [PMC free article] [PubMed] [Google Scholar]
- 23.Doniach S. Changes in biomolecular conformation seen by small angle X-ray scattering. Chem. Rev. 2001;101:1763–1778. doi: 10.1021/cr990071k. [DOI] [PubMed] [Google Scholar]
- 24.Linding R., Jensen L.J., Russell R.B. Protein disorder prediction: implications for structural proteomics. Structure. 2003;11:1453–1459. doi: 10.1016/j.str.2003.10.002. [DOI] [PubMed] [Google Scholar]
- 25.Linding R., Russell R.B., Gibson T.J. GlobPlot: exploring protein sequences for globularity and disorder. Nucleic Acids Res. 2003;31:3701–3708. doi: 10.1093/nar/gkg519. [DOI] [PMC free article] [PubMed] [Google Scholar]
- 26.O’Neil K.T., DeGrado W.F. A thermodynamic scale for the helix-forming tendencies of the commonly occurring amino acids. Science. 1990;250:646–651. doi: 10.1126/science.2237415. [DOI] [PubMed] [Google Scholar]
- 27.Creamer T.P., Rose G.D. α-Helix-forming propensities in peptides and proteins. Proteins. 1994;19:85–97. doi: 10.1002/prot.340190202. [DOI] [PubMed] [Google Scholar]
- 28.Spink B.J., Sivaramakrishnan S., Spudich J.A. Long single α-helical tail domains bridge the gap between structure and function of myosin VI. Nat. Struct. Mol. Biol. 2008;15:591–597. doi: 10.1038/nsmb.1429. [DOI] [PMC free article] [PubMed] [Google Scholar]
- 29.Knight P.J., Thirumurugan K., Peckham M. The predicted coiled-coil domain of myosin 10 forms a novel elongated domain that lengthens the head. J. Biol. Chem. 2005;280:34702–34708. doi: 10.1074/jbc.M504887200. [DOI] [PubMed] [Google Scholar]
- 30.Peckham M., Knight P.J. When a predicted coiled coil is really a single α-helix, in myosins and other proteins. Soft Matter. 2009;5:2493–2503. [Google Scholar]
- 31.Sivaramakrishnan S., Spink B.J., Spudich J.A. Dynamic charge interactions create surprising rigidity in the ER/K α-helical protein motif. Proc. Natl. Acad. Sci. USA. 2008;105:13356–13361. doi: 10.1073/pnas.0806256105. [DOI] [PMC free article] [PubMed] [Google Scholar]
- 32.Süveges D., Gáspári Z., Nyitray L. Charged single α-helix: a versatile protein structural motif. Proteins. 2009;74:905–916. doi: 10.1002/prot.22183. [DOI] [PubMed] [Google Scholar]
- 33.Splawski I., Timothy K.W., Keating M.T. Ca(V)1.2 calcium channel dysfunction causes a multisystem disorder including arrhythmia and autism. Cell. 2004;119:19–31. doi: 10.1016/j.cell.2004.09.011. [DOI] [PubMed] [Google Scholar]
Associated Data
This section collects any data citations, data availability statements, or supplementary materials included in this article.