

Abstract
Mitochondrial Ca2+ uptake exerts dual effects on mitochondria. Ca2+ accumulation in the mitochondrial matrix dissipates membrane potential (ΔΨm), but Ca2+ binding of the intramitochondrial enzymes accelerates oxidative phosphorylation, leading to mitochondrial hyperpolarization. The levels of matrix free Ca2+ ([Ca2+]m) that trigger these metabolic responses in mitochondria in nerve terminals have not been determined. Here, we estimated [Ca2+]m in motor neuron terminals of Drosophila larvae using two methods: the relative responses of two chemical Ca2+ indicators with a 20-fold difference in Ca2+ affinity (rhod-FF and rhod-5N), and the response of a low-affinity, genetically encoded ratiometric Ca2+ indicator (D4cpv) calibrated against known Ca2+ levels. Matrix pH (pHm) and ΔΨm were monitored using ratiometric pericam and tetramethylrhodamine ethyl ester probe, respectively, to determine when mitochondrial energy metabolism was elevated. At rest, [Ca2+]m was 0.22 ± 0.04 μM, but it rose to ∼26 μM (24.3 ± 3.4 μM with rhod-FF/rhod-5N and 27.0 ± 2.6 μM with D4cpv) when the axon fired close to its endogenous frequency for only 2 s. This elevation in [Ca2+]m coincided with a rapid elevation in pHm and was followed by an after-stimulus ΔΨm hyperpolarization. However, pHm decreased and no ΔΨm hyperpolarization was observed in response to lower levels of [Ca2+]m, up to 13.1 μM. These data indicate that surprisingly high levels of [Ca2+]m are required to stimulate presynaptic mitochondrial energy metabolism.
Introduction
Mitochondria provide most of the ATP that fuels a variety of cellular activities. Changes in cellular activities result in an increase in ATP demand and are usually associated with elevations in cytosolic ADP and calcium concentrations ([Ca2+]i) (1,2), both of which are believed to modulate mitochondrial ATP synthesis. These regulatory mechanisms appear to be preserved in presynaptic nerve terminals, where the synchronization of ATP utilization with mitochondrial ATP production is crucial for sustaining synaptic transmission (3,4). An ADP stimulatory influence on energy metabolism has been well documented in isolated mitochondria and a number of neuronal preparations (1,2,5). The widely used ADP/ATP ratio reflects the energetic status of the cell and determines the amount of ADP available for phosphorylation by the F1-F0-ATP synthase (5). However, simulations of mitochondrial metabolism show that changes in the cytosolic ADP/ATP ratio and phosphate levels alone are not sufficient to explain mitochondrial metabolism stimulation (6). The calcium sensitivity of elements of mitochondrial energy metabolism provides an additional mechanism for stimulating ATP synthesis. An elevation in mitochondrial matrix Ca2+ levels ([Ca2+]m) increases mitochondrial metabolism in motor nerve terminals in situ (7), although the [Ca2+]m levels responsible for this stimulatory effect have not been quantified.
Quantification of [Ca2+]m levels that stimulate presynaptic mitochondrial energy metabolism in situ necessitates estimation of [Ca2+]m along with several independent measures of mitochondrial energy metabolism, such as matrix pH (pHm) and mitochondrial membrane potential (ΔΨm). The accuracy of any physiologically relevant [Ca2+]m estimate measured with Ca2+ indicators depends on the indicator’s affinity, specificity of targeting to the matrix, environmental sensitivity, and accuracy of the calibration in situ, as well as the ability to replicate in vivo [Ca2+]i transients. Either chemical or genetically encoded Ca2+ indicators (GECIs) can be used to measure [Ca2+]m. GECIs offer subcellular specificity of targeting, but they are vulnerable to pH changes, and with the exception of aequorin, they have slow kinetics, nonlinear responses to Ca2+, and a low dynamic range (8). Most chemical Ca2+-indicators perform well in the areas in which GECIs are deficient, but they can be difficult to load with specificity, and few ratiometric chemical Ca2+ indicators are available with a Ca2+ affinity suitably low for measuring [Ca2+]m. Nonratiometric imaging with dyes is particularly problematic, as their calibration generally requires permeabilization of the inner mitochondrial membrane to control [Ca2+]m, which inevitably leads to dye loss (9).
Exploiting the advantages of chemical Ca2+ indicators and GECIs in the same preparation limits negative influences imposed by their respective disadvantages, providing a greater degree of confidence in [Ca2+]m estimates. The Drosophila larval neuromuscular preparation is amenable to the application of chemical Ca2+ indicators, and it is genetically tractable, allowing the expression of GECIs. Further, the endogenous firing rates and accompanying changes in [Ca2+]i have been quantified (7,10). Here, we use two different chemical Ca2+ indicators (rhod-5N, Kd ∼ 320 μM, and rhod-FF, Kd ∼ 19 μM) and adopt an analytical approach to calculate [Ca2+]m from the ratio of their responses under similar conditions with no requirement for permeabilization. Two ratiometric GECIs, TN-XXL and D4cpv (Kd ∼ 0.8 μM and Kd ∼ 60 μM, respectively, in vitro) were used to estimate minimum and maximum [Ca2+]m, respectively. A genetically encoded pH indicator (GEpHI; ratiometric pericam) and a mitochondrial potentiometric probe, tetramethylrhodamine ethyl ester (TMRE), were used to report elevation of mitochondrial energy metabolism. Both chemical and GECIs revealed that a high level of [Ca2+]m (∼26 μM) was required to stimulate presynaptic mitochondrial energy metabolism.
Methods
Fly stocks
Flies were maintained at room temperature on cornmeal media supplemented with baker’s yeast. Third-instar Drosophila larvae of both sexes were used for all of the experiments. The enhancer-trap strain w1118; P[w+, OK6:GAL4] was used to drive expression of upstream-activating-sequence (UAS)-controlled reporter transgenes in motor neurons. The other fly stocks/transgenes used in this study included UAS-GFP, UAS-2mt8RP, UAS-GCaMP1.3, UAS-2mt8D4cpv, and UAS-2mt8TN-XXL.
Generation of flies transgenic for mitochondrially targeted Ca2+ indicators
cDNA for D4cpv was provided by Roger Tsien, cDNA for TN-XXL was provided by Dirk Reiff (Max Planck Institute for Biological Cybernetics, Tübingen, Germany) and cDNA for superecliptic pHluorin was provided by Gero Miesenbock (Centre for Neural Circuits and Behaviour, Oxford University, Oxford, United Kingdom). GECIs were targeted to the matrix of mitochondria by fusing a tandem repeat of the first 36 aa of subunit VIII of human cytochrome oxidase (COX) (11) to the N-terminus of each GECI. The fused cDNAs were then cloned into a P-element vector (pUAST) and injected into w1118 Drosophila embryos by Rainbow Transgenic Flies (Newbury Park, CA). Strains containing homozygous transgenes were obtained after determining the chromosome harboring the transgene and outcrossing all other chromosomes.
Dye loading and fluorescence imaging
Drosophila larvae were filleted and pinned to a Sylgard bath in Schneider’s solution (Sigma Aldrich, Saint Louis, MO). The segmental nerves were cut from the ventral ganglion before dye loading. Rhod-FF and rhod-5N stocks (2 mM in each case) in Pluronic/dimethylsulfoxide solution (Invitrogen, Carlsbad, CA) were diluted in Schneider’s solution to a final concentration of 1 μM and added to larval preparations. After 20 min of incubation at room temperature, larvae were washed with fresh Schneider’s solution for 15 min. For imaging, Schneider’s solution was replaced with hemolymph like solution 6 (HL6) (12) containing 2 mM CaCl2 and 7 mM L-glutamic acid and the nerves were drawn into a stimulation pipette. In the case of TMRE, larval preparations with severed nerves were incubated in Schneider’s solution containing 50 nM TMRE at room temperature for 20 min. The solution was then replaced with HL6 supplemented with 50 nM TMRE and the nerves were drawn into a stimulation pipette. TMRE-loaded larval preparations were stimulated at various frequencies with the dye present in the bath to minimize TMRE leakage. Dye and GECI fluorescence changes were imaged in MN13-Ib axonal terminals in abdominal segment 4, as described previously in Chouhan et al. (7). Briefly, nerve terminals were visualized using wide-field microscopy on a BX51WI microscope (Olympus, Center Valley, PA) equipped with a 100× (1.0 NA) water-immersion objective. Nerve stimulation at various frequencies was delivered via Master-8 stimulator (AMPI, Jerusalem, Israel) and a Digitimer (Brooksville, FL) model DS2A Mk.II. Images were captured with an Andor (Belfast, United Kingdom) iXon+ DU-860D EMCCD camera using Andor iQ 1.8 acquisition software and saved as 14-bit (128 × 128 pixels) TIF files. Image processing was performed with either Andor iQ or ImageJ software package. For quantification of ΔΨm hyperpolarization, background-subtracted TMRE fluorescence was averaged over 2 s (∼6 frames) at 15 s after onset of a stimulus.
Indicator calibrations
Dissected larval preparations expressing mito-D4cpv or mito-TN-XXL were permeabilized for 20 min with HL6 solutions containing 50 μM ionomycin, 10 μM carbonyl cyanide m-chlorophenyl hydrazone (CCCP) and various known calcium concentrations and imaged by collecting fluorescence from mitochondria in various nerve terminals. Calibration solutions with free calcium concentrations <5 μM were prepared by mixing various volumes of two HL6 solutions: one containing 5 mM EGTA and the other 1 mM CaCl2, and adjusting pH to 7.3 at 24°C. Free calcium concentration was calculated using Ca-EGTA Calculator v1.2, http://www.stanford.edu/∼cpatton/CaEGTA-NIST.htm. Calibration solutions with free calcium concentrations >5 μM were made by adding various volumes of 1 M CaCl2 to HL6 solution. EYFP/ECFP fluorescence ratios were plotted against free calcium concentration and fitted with a four-parameter sigmoid equation in SigmaPlot 10 (Systat Software, Evanston, IL).
Mitochondrially-targeted-ratiometric-pericam (mito-RP)-expressing preparations were permeabilized for 20 min with internal solution (120 mM KCl, 0.5 mM KH2PO4, 10 mM succinate, 10 mM Bis-Tris propane) containing 100 μM digitonin and 10 μM CCCP adjusted to the various pH values. Fluorescence values (excitation at 490 nm) were normalized to the resting (nonpermeabilized) fluorescence and plotted against pH. The values were fitted to a Boltzmann function using SigmaPlot 10.
Mitochondrial calcium concentration quantification with fluorescent dyes
Inability to accurately measure Fmax and Fmin values for nonratiometric fluorescent dyes in mitochondria precludes their use in mitochondrial calcium concentration ([Ca2+]m) quantification. However, [Ca2+]m can be estimated by comparing relative fluorescence responses of two fluorescent dyes with distinct Kd values without the need for measuring Fmax and Fmin values. The theory for this approach is presented in the Appendix.
The range of calcium concentrations that can be reliably estimated by this method depends on the performance of the detection system used, the loading conditions, and the Kd values for fluorescent indicators. The standard deviation of fluorescent noise (deflections of the signal from the mean, measured from a region of interest) for rhod indicators under loading conditions described above is <0.7% of Fmax:
Thus, fluorescent values that are different by at least three standard deviations for fluorescent noise (3σnoise) are resolved with probability >99.7%. Rearranging Eq. 2 from the Appendix gives an estimate for the range of calcium concentrations measured by each indicator:
Assuming that rhod-FF and rhod-5N intramitochondrial Kd values are 1.5-fold higher than their in vitro estimates, the minimum and maximum [Ca2+]m that can be detected using these two indicators together are 10 μM and 1350 μM, respectively.
The mean ± SE for [Ca2+]m values was calculated using error propagation theory. Partial derivatives of [Ca2+] with respect to RFF and R5N for Eqs. 4 and 5 in the Appendix were used to calculate the SE,
where and are the mean values of RFF and R5N.
Results
Cytosolic Ca2+ is actively taken up by mitochondria where it stimulates mitochondrial energy metabolism. To estimate [Ca2+]m levels in presynaptic mitochondria at various [Ca2+]i levels, we either loaded fluorescent chemical Ca2+ indicators or expressed ratiometric GECIs in mitochondria of motor neurons (MNs) in Drosophila larvae. Mitochondrial Ca2+ uptake was examined in the presynaptic mitochondria of the MN that innervates body wall muscle fiber 13 (MN13-Ib) with big boutons (Fig. 1 A). Nerve stimulation at 80 Hz for 2 s resulted in a rapid increase in [Ca2+]i, as reported by GCaMP3 fluorescence (Fig. 1 B, upper). The rise in [Ca2+]i was accompanied by rapid mitochondrial Ca2+ uptake and matrix pH (pHm) alkalinization followed by a slow return of both [Ca2+]m and pHm to baseline. Removal of Ca2+ from the extracellular medium abolished changes in pHm (Fig. 1 B, middle). Inhibition of the mitochondrial ADP/ATP exchanger with 50 μM bongkrek acid had no effect on pHm (Fig. 1 B, lower), suggesting that mitochondrial Ca2+ acts as the principal driver of mitochondrial alkalinization.
Figure 1.
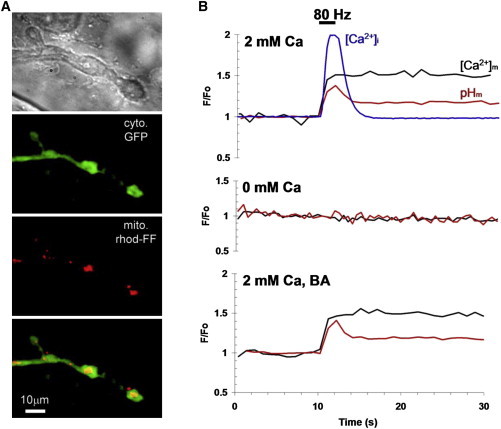
Imaging of mitochondrial pH and Ca2+ changes in Drosophila larval motor neuron terminals. (A) Images of a motor neuron forming a terminal with type-Ib big boutons on the surface of muscle fiber 13. Top to bottom: phase-contrast image; boutons containing cytosolic (cyto.) GFP; mitochondria (mito.) loaded with rhod-FF; merge of cyto. and mito. (B) Changes in cytosolic Ca2+, [Ca2+]i (blue line; F/Fo, GCaMP3), mitochondrial matrix Ca2+, [Ca2+]m (black traces; (2Fo − F)/Fo, mito-RP excitation at 420 nm), and pHm (red traces, F/Fo, mito-RP excitation at 490 nm) obtained upon 80 Hz nerve stimulation for 2 s at 10 s in normal (upper), Ca2+-free (middle), and 50 μM bongkrek acid (BA) containing HL6 solution (lower).
We further explored the relationship between pHm, mitochondrial membrane potential (ΔΨm), and [Ca2+]m at different stimulation frequencies. A combination of two mitochondrial fluorescent chemical Ca2+ indicators with different Kd values, such as rhod-FF (Kd = 19μM) and rhod-5N (Kd = 320μM), allows estimation of [Ca2+]m levels without necessitating indicator calibrations after each experiment. Although rhod-FF and rhod-5N cannot be used in the same preparation for the real-time [Ca2+]m measurements, due to the overlap in their spectral properties, different Ca2+ indicator combinations are possible, such as mag-fluo-4 and rhod-5N. However, from our experience, adequate loading of both indicators at the same time is difficult and often leads to inconsistent results. We therefore used individual preparations loaded with either rhod-5N or rhod-FF that were then stimulated for 2 s by a pair of different frequencies (stimulating frequency followed by a reference frequency) separated by an 8-s interval. Stimulations for 5 s did not produce a larger increase in the fluorescence of either dye, indicating that equilibrium for [Ca2+]m is reached quickly (data not shown). Fig. 2 A shows changes in rhod-FF and rhod-5N fluorescence at 42 and 80 Hz. Background-corrected intensities, calculated as the average fluorescence signal 2–3 s after the cessation of each stimulus train, were used to calculate the ratios of response amplitudes (stimulating frequency/reference frequency) at 30, 42, 60, and 80 Hz for both Ca2+ indicators. Rhod-FF ratios of 30/42 Hz, 0.66 ± 0.03 (n = 6); 42/60 Hz, 0.83 ± 0.02 (n = 9); and 42/80 Hz, 0.76 ± 0.03 (n = 10) were higher than the corresponding ratios for rhod-5N: 30/42 Hz, 0.52 ± 0.13 (n = 6); 42/60 Hz, 0.70 ± 0.05 (n = 11); and 42/80 Hz, 0.57 ± 0.03 (n = 7), which is consistent with rhod-FF having a higher affinity for Ca2+. The 60/80-Hz ratios could not be reliably measured, since stimulation at 60 Hz led to an insignificant calcium uptake at 80 Hz, suggesting Ca2+-dependent inhibition of Ca2+ uptake at higher [Ca2+]m. Thus, calculation of [Ca2+]m values for 60-Hz and 80-Hz stimuli from the ratios with 60 Hz and 80 Hz only as reference frequencies might result in their underestimation. The determined ratios and the published in vitro Kd values for these Ca2+-indicators were used to derive absolute values for [Ca2+]m. The detailed procedure for the calculation of [Ca2+]m is fully described in the Appendix to this article. The calculated [Ca2+]m values ranged from 8.4 μM to 29.5 μM for the frequencies used. However, these [Ca2+]m estimates are likely to be significantly underestimated due to the differences in Kd values for free and cell/organelle-internalized Ca2+-indicators (13). The shaded columns in Fig. 2 B show the effects of varying rhod-FF and rhod-5N affinities between 1 × Kd and 1.5 × Kd (assuming Fmin ∼ 0) on solution spaces for [Ca2+]m at 42- and 80-Hz stimulation. It has been estimated that the intramitochondrial rhod-5N Kd value is at least 1.5 times higher (∼470 μM) than its in vitro Kd (14). To account for this, we calculated [Ca2+]m using higher (1.5×) estimates for Ca2+ affinities of the Ca2+ indicators (see Table 1).
Figure 2.
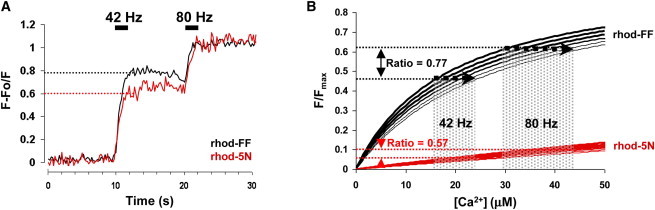
Quantifying mitochondrial matrix Ca2+ concentrations with rhod-FF and rhod-5N indicators. (A) Fluorescent responses of rhod-FF (black) and rhod-5N (red) normalized to 80 Hz recorded from presynaptic mitochondria in MN13-Ib axonal terminals stimulated with 42- and 80-Hz electrical pulse trains for 2 s at 10 and 20 s. Dotted lines show the 42/80-Hz ratio values for both indicators. (B) Graphical simulation of rhod-FF and rhod-5N fluorescence (F/Fmax, Fmin = 0) at different Ca2+ concentrations ([Ca2+]) for a range of Kd values for both indicators (thick, 1 × Kd, to thin, 1.5 × Kd). Dotted lines show the rhod-FF and rhod-5N fluorescence intensities that give 42/80-Hz ratios similar to those in A and also result in single numerical solutions for [Ca2+] for rhod-FF and rhod-5N at 42 and 80 Hz. Dotted areas are the solution spaces for [Ca2+] at 42 and 80 Hz for various Kd.
Table 1.
Equilibrium values of [Ca2+]m at rest and during nerve stimulation
| Rhod-FF/Rhod-5N | Mito-D4cpv | Mito-TN-XXL | |
|---|---|---|---|
| Rest | — | — | 0.22 ± 0.04 |
| 30 Hz | 13.1 ± 3.9 | — | — |
| 42 Hz | 24.3 ± 3.4 | 27.0 ± 2.6 | — |
| 60 Hz | 35.4 ± 10.0 | — | — |
| 80 Hz | 44.3 ± 6.4 | 62.9 ± 4.9 | — |
Nerves were stimulated at various frequencies, and equilibrium values were derived from measurements using Ca2+ indicators rhod-FF/5N, D4cpv, and TN-XXL. Values are shown as the mean ± SE (μM).
We sought independent estimates for [Ca2+]m values by using ratiometric GECIs targeted to the mitochondrial matrix, although they have a more limited dynamic range than fluorescent chemical Ca2+ indicators. D4cpv is a low-affinity fluorescence-resonance-energy-transfer-based (enhanced yellow fluorescence protein (EYFP) (cpVenus)/enhanced cyan fluorescent protein (ECFP) pair) GECI wherein the calmodulin/peptide pair was redesigned to change its Ca2+ affinity and also to prevent perturbation by wild-type calmodulin (15). We expressed mitochondrially targeted D4cpv (mito-D4cpv) in Drosophila larval MNs. Larval preparations expressing mito-D4cpv were permeabilized with solutions containing 50 μM ionomycin, 10 μM CCCP, and various known Ca2+ concentrations to calibrate the GECI. Ratios of EYFP/ECFP fluorescence intensities were plotted against log[Ca2+], and fitted with a four-parameter Hill’s model (Fig. 3 A). The apparent Ca2+ affinity for mito-D4cpv (Kd, app = 90.3 μM) was higher than the reported affinity of cytosolic D4cpv (Kd, app = 64 μM) (16). The other parameters derived from the model were Hill’s coefficient, nH = 1.24, and Rmin and Rmax of 2.48 and 7.34, respectively.
Figure 3.
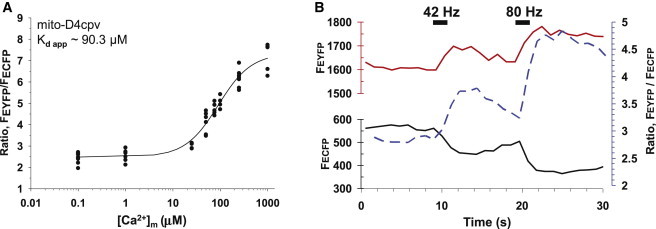
Measuring mitochondrial matrix Ca2+ concentrations with the genetically encoded Ca2+ indicator mito-D4cpv. (A) Calibration curve (four-parameter Hill’s fit, R2 = 0.95) showing EYEP(cpVenus)/ECFP ratio of mito-D4cpv as a function of the logarithm of Ca2+ concentration (μM). (B) Changes in EYFP (red line) and ECFP fluorescence (black line) and their ratio (dotted blue line) in mitochondria of M13-1b axonal terminals stimulated with 42- and 80-Hz electrical pulse trains for 2 s at 10 and 20 s.
Mito-D4cpv was imaged in MN13-Ib axonal terminals to estimate [Ca2+]m values at 42 and 80 Hz. Fig. 3 B shows typical fluorescent responses seen in the EYFP and ECFP channels, and their ratio. Stimulation at 42 and 80 Hz for 2 s increased the EYFP/ECFP ratio to 3.37 ± 0.09 (n = 9) and 4.38 ± 0.11 (n = 8), respectively. Fitting those values into the Hill’s equation gives [Ca2+]m values of 27.0 ± 2.6 μM and 62.9 ± 4.9 μM for 42 and 80 Hz, respectively. Both mito-D4cpv and fluorescent chemical Ca2+ indicators (1.5 × Kd) produced comparable estimates for [Ca2+]m at 42 Hz, but mito-D4cpv gave a higher value at 80 Hz, see Table 1. This supports our earlier assumption and previous estimates that Kd for rhod-5N/FF in mitochondria would be at least 1.5 times higher than the values suggested from in vitro measurements.
[Ca2+]m at rest was also estimated with the high-affinity GECI TN-XXL (8) (Kd, app ∼ 1.1 μM; Fig. S1 A in the Supporting Material), which we targeted to the mitochondrial matrix (mito-TN-XXL). In resting [Ca2+]m measurements, the nerves were severed at least 30 min before imaging. The resting [Ca2+]m in MN13-Ib presynaptic mitochondria was 220 ± 43 nM (n = 8; Table S1), which is higher than our estimate of resting [Ca2+]i (32 ± 6 nM) in these neurons. Comparable resting [Ca2+]m values have been reported from other cells (15,17,18). Plotting resting and stimulated [Ca2+]m values against our [Ca2+]i estimates derived from fura-dextran measurements yields a linear relationship (Fig. 4 A), which suggests that mitochondria do not start taking up Ca2+ until [Ca2+]i exceeds 200–250 nM.
Figure 4.
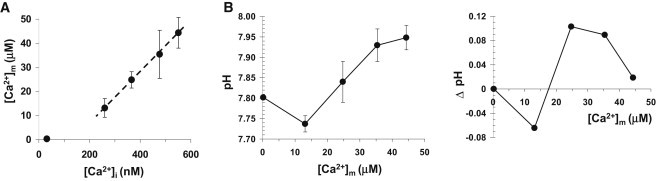
Interrelation between mitochondrial matrix Ca2+, cytosolic Ca2+, and mitochondrial matrix pH. (A) Graph showing a linear relationship between the volume average cytosolic Ca2+ concentration, [Ca2+]i, and mitochondria matrix Ca2+ concentration, [Ca2+]m. (B) (Left) Graph depicting the equilibrium mitochondrial matrix pH associated with different mitochondrial matrix Ca2+ concentrations, [Ca2+]m. (Right) Plot showing differential changes in mitochondrial matrix pH associated with ∼10 μM step increase in mitochondrial matrix Ca2+ concentration. Error bars indicate the mean ± SE.
To quantify pHm changes associated with Ca2+ uptake by mitochondria, we used mito-RP (10). The 490-nm excitation/ 520-nm emission wavelengths report pHm changes relatively independent of Ca2+ (19). Mito-RP was calibrated with standard pH solutions containing 100 μM digitonin and 10 μM CCCP, producing pKa ∼ 8.61 (Fig. S1 B). The matrix pH level in MN13-Ib mitochondria at rest was estimated to be ∼7.80 (Table S1). Nerve stimulation caused a rapid transient change in pHm followed by a plateau above baseline (Fig. 1 B), with the latter used as a measure of the equilibrium pHm. pHm showed a biphasic relationship with increasing [Ca2+]m levels. [Ca2+]m accumulation below ∼20 μM led to mitochondrial matrix acidification ([Ca2+]m(30 Hz) ≈ 13.1 μM, pHm = 7.74 ± 0.02, n = 9), whereas [Ca2+]m above that level alkalinized the matrix ([Ca2+]m(80 Hz) ≈ 44.3 μM, pHm = 7.95 ± 0.03, n = 13) (Fig. 4 B). These changes in pHm were only minimally affected by concurrent acidification in the cytosol (Fig. S2), permitting a correlation between [Ca2+]m and pHm values. Plotting of differential changes in pHm against [Ca2+]m shows that maximal mitochondrial alkalinization per unit of Ca2+ is achieved at close to [Ca2+]m ∼ 26 μM, or 42 Hz stimulation, which is the average rate at which MN13-Ib MN fires in situ (10).
Although pHm changes are important for the control of overall mitochondrial metabolic activity, and they generally mirror changes in ΔΨm, proton gradient comprises only ∼20% of the proton motive force required for ATP synthesis (20). Therefore, we also sought to determine ΔΨm changes to evaluate mitochondrial capacity for ATP synthesis at different [Ca2+]m levels. To measure ΔΨm, we employed TMRE in nonquench mode, a rhodamine-based cationic mitochondrial probe that follows the Nernstian distribution in mitochondria. Stimulation at 30 Hz for 2 s resulted in ΔΨm depolarization followed by recovery to baseline (Fig. 5) in MN13-Ib mitochondria (ΔF/Fo (30 Hz) = 0.9 ± 0.7%, n = 8). Higher-frequency stimulations gave rise to an after-stimulus ΔΨm hyperpolarization with a peak around 15 s after the onset of a stimulus train similar to the NAD(P)H-stimulation-evoked increase seen in these terminals (10). ΔΨm increases became nearly saturated after 60 Hz (ΔF/Fo (42 Hz) = 4.1 ± 1.1%, n = 7; ΔF/Fo (60Hz) = 8.4 ± 0.9%, n = 8; and ΔF/Fo (80 Hz) = 9.3 ± 1.1%, n = 5), which parallels pHm changes. Thus, both pHm and ΔΨm measurements suggest that mitochondrial metabolism in Drosophila larval nerve terminals is most responsive at [Ca2+]m levels in the range∼20–30 μM.
Figure 5.
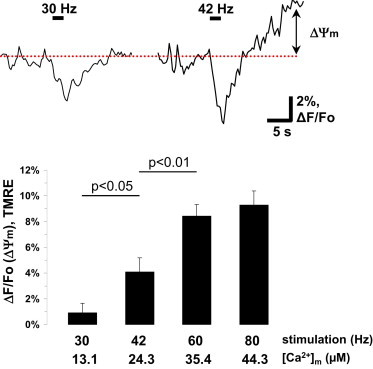
Imaging of mitochondrial membrane potential changes (ΔΨm) with TMRE probe. (Upper) Representative traces of TMRE fluorescent changes ((F − Fo)/Fo = ΔF/Fo) in response to 2-s stimuli at 30 and 42 Hz in mitochondria of MN13-Ib terminals. (Lower) Quantification of after-stimulus ΔΨm increases for different stimulation frequencies. Multigroup comparisons were carried out using analysis of variance with Tukey’s posttest. Error bars indicate the mean ± SE.
Discussion
We have determined presynaptic values of [Ca2+]m in Drosophila larval MNs by employing both chemical and genetically encoded Ca2+ indicators (GECIs). [Ca2+]m was empirically derived from the ratio of rhod-5N fluorescence responses to two [Ca2+]i transients of different amplitudes, relative to the ratio of rhod-FF responses to comparable [Ca2+]i transients. Our calculations reveal that [Ca2+]m rises to 24.3 μM when the MN fires close to its typical in vivo rate for 2 s. Low-affinity matrix-targeted ratiometric GECI D4cpv corroborated this [Ca2+]m estimate (27.0 μM). Our estimates of elevated [Ca2+]m were refined using the high-affinity matrix-targeted ratiometric GECI TN-XXL to estimate resting [Ca2+]m. Measures of change in mitochondrial energy metabolism (i.e., changes in pHm and ΔΨm) were collected using matrix-targeted GEpHI ratiometric pericam and the mitochondrial cationic dye TMRE, respectively. We found that pHm did not alkalinize and ΔΨm did not increase significantly at stimulation frequencies below the endogenous firing rate of MN, which suggests that mitochondrial energy metabolism is well integrated with presynaptic activity. The fact that neither pHm nor ΔΨm showed an appreciable increase until [Ca2+]m reached ∼26 μM also indicates that the least Ca2+-sensitive elements of oxidative phosphorylation might be responsible for setting the overall Ca2+ sensitivity of mitochondrial energy metabolism in situ.
We interpret the [Ca2+]m levels measured in this study to represent fluctuations in a physiological range. The average peak firing rate of MN13-Ib during fictive locomotion is 42.4 ± 1.6 Hz (10), but it can fire at up to 80 Hz for brief periods. When driven at 80 Hz for 2 s, [Ca2+]m rises (on average) to ∼54 μM. Longer stimulation trains and stimulation rates exceeding 80 Hz do not yield [Ca2+]m estimates significantly higher than 54 μM, although higher stimulus rates result in higher [Ca2+]i (data not shown). D4cpv reported a higher [Ca2+]m level when mitochondria were permeabilized in the presence of 1 mM Ca2+ relative to 100 μM Ca2+ (Fig. 3 A), indicating that [Ca2+]m levels >54 μM would have been reported had they been achieved during intense nerve stimulation. As mitochondrial proteases could be activated by high levels of [Ca2+]m (21), we considered the possibility that [Ca2+]m may achieve toxic levels, possibly as a consequence of measurements being done ex vivo. Our highest estimates of [Ca2+]m are below those made using low-affinity Ca2+ indicators in either neuronal or nonneuronal (HeLa) cultured mammalian cells, where estimates peaked between 100 μM and near-millimolar levels (14,15,22–24), but the toxicity of such levels is rarely addressed. Two observations argue against [Ca2+]m levels of ∼54 μM leading to toxic and irreversible effects in this study. First, the distribution and gross morphology of groups of presynaptic mitochondria remained essentially unchanged for up to 6 h after nerve stimulation at 80 Hz ex vivo. Second, mitochondrial pHm and [Ca2+]m responses (measured with chemical Ca2+ indicators or GECIs) remained remarkably robust and consistent for up to 6 h poststimulation ex vivo.
Although our [Ca2+]m estimates are below the highest levels reported from cells in culture, they are substantially above the only other [Ca2+]m estimate made at presynaptic nerve terminals; an estimate of ∼1 μM from lizard MNs (25). The reasons for the discrepancy in the values between lizard and Drosophila are not obvious. One possibility is that the use of a rhod-based Ca2+ indicator (rhod-5N) in lizard MN terminals limited [Ca2+]m levels or damaged mitochondria, as reported for the effects of rhod-2 and rhod-FF (26), which appears unlikely, as we also relied upon rhod-5N in addition to rhod-FF, and their use did not yield estimates significantly different from those based on our low-affinity GECI D4cpv. Second, Drosophila MN terminals are glutamatergic, whereas lizard MN terminals are cholinergic, but this fundamental difference offers no immediately evident explanation. Third, terminals between the preparations may differ in their cytosolic levels of Mg2+, adenine nucleotides, inorganic phosphate, Na+, and H+, all of which have been shown to influence Ca2+ uptake and/or release (27), but few of which have been quantified in either lizard or Drosophila MN terminals. Last, Paolo Bernardi and colleagues reported that Drosophila mitochondria in permeabilized S2R+ cells display Ca2+ transport systems that match their mammalian equivalents (and presumably lizards), but they have a unique selective Ca2+ release channel (28).
Our estimate of resting [Ca2+]m (∼220 nM) is well above [Ca2+]i resting levels (∼32 nM), but very close to the [Ca2+]i threshold at which presynaptic mitochondria begin to take up Ca2+ from the cytosol, >200–250nM. However, the significance of this coincidence is not clear. [Ca2+]i rises to 350 ± 34 nM at the endogenous firing rate of the MN, and [Ca2+]m rises to ∼26 μM. Firing at 80 Hz, [Ca2+]i level reaches 551 ± 23 nM, and [Ca2+]m reaches ∼54 μM within 2 s. Such a rapid accumulation of large amounts of Ca2+ by mitochondria might indicate their exposure to Ca2+ microdomains. We have previously established that the mitochondria in Drosophila MN terminals do not take up Ca2+ from the endoplasmic reticulum (10), although we cannot dismiss the possibility that mitochondria have access to voltage-gated calcium-channel microdomains at the plasma membrane.
Our observations that pHm and ΔΨm did not rise significantly in response to [Ca2+]m as high as 13.1 μM raise the question of which Ca2+-binding targets in the matrix may be essential for the elevations seen in pHm and ΔΨm. The Ca2+-binding targets with a matrix locus are well defined: pyruvate dehydrogenase (PDH), NAD+-isocitrate dehydrogenase (ICDH), 2-oxoglutarate dehydrogenase, and the F1-F0-ATP synthase in the inner mitochondrial membrane. Ca2+ stimulates the activity of the F1-F0-ATP synthase, possibly through a number of mediators, but with an estimated apparent Ca2+ affinity of ∼1 μM (29). PDH supplies the Krebs cycle with acetyl-CoA and has an apparent Ca2+ affinity of ∼0.75 μM (30,31). 2-oxoglutarate dehydrogenase within the Krebs cycle has a higher apparent Ca2+ affinity than PDH in a high ADP/ATP environment (∼0.28 μM (31)). The Ca2+ affinity of ICDH, however, is at least an order of magnitude higher than that of any other dehydrogenases and estimated at 5 and 41 μM, depending on the ADP/ATP environment (31,32). The dehydrogenase Ca2+ affinity measurements above were made in tolulene-permeabilized mitochondria and likely reflect in situ Ca2+ affinities. Measurements made on the purified enzymes in solution generally support those reported here. However, Ca2+ affinity estimates on purified enzymes might be underestimated, as the use of chelation agents such as EGTA interferes with other ionic species (33). Evident in these estimates is the significant gap between the Ca2+ affinity of ICDH and those of the three other matrix Ca2+ targets. Our observations that [Ca2+]m values of several tens of μM are required to elevate pHm and ΔΨm are consistent with ICDH stimulation being required to increase mitochondrial energy metabolism, and also with the theory of the three dehydrogenases acting in series. Acidification observed at low [Ca2+]m levels may be due to the couptake of phosphate with Ca2+. Low [Ca2+]m levels are incapable of stimulating ICDH, which is necessary to counteract the influx of protons in the form of H2PO4−. The high Ca2+ affinity of ICDH may also provide an explanation for why an elevation in mitochondrial metabolism is not observed in lizard MN terminals (34), where [Ca2+]m peaks at only ∼1 μM (25).
Our analytical approach for estimating [Ca2+]m, using data from two different Ca2+ indicators with distinct Ca2+ affinities, captures some of the benefits of low-affinity chemical Ca2+ indicators, such as their high dynamic range and relatively linear responses, but sidesteps their disadvantage of dye loss during membrane permeabilization and calibration. Mito-D4cpv provides for a conventional ratiometric imaging, but its biphasic Ca2+ response curves can be problematic, and constructing an in situ calibration curve also can be demanding (Fig. 3 A). The genetics required to introduce GECI transgenes into mutant backgrounds for analysis are also less convenient than using topically applied chemical Ca2+ indicators. However the use of mito-D4cpv, and mito-TN-XXL, is particularly valuable for making ratiometric measurements, because even if some protein is lost during permeabilization, which is unlikely, ratiometric estimates of [Ca2+]m remain unaffected.
Conclusions
In this study, we provide estimates of presynaptic [Ca2+]m from individually identified MN terminals in situ, from which we were able to obtain measures of changes in mitochondrial energy metabolism. The use of complementary Ca2+ indicators targeted to the matrix provided a robust estimate of [Ca2+]m. The magnitude of the changes in [Ca2+]m, and the [Ca2+]m values at which pHm and ΔΨm change are surprisingly consistent with what is known about the relative affinities of Ca2+-responsive elements of oxidative phosphorylation, even though most of those data were gleaned from nonneuronal cell types outside of their cellular context.
Acknowledgments
We thank Amit Chouhan, Rosario Martinez, and Adam Rossano for their help with DNA cloning and creating transgenic flies used in this study. We are grateful to Dr. Thomas Gunter for his critical reading of the preliminary version of this manuscript and his valuable comments.
This work was supported by National Institutes of Health grants R01 NS061914 and T32 AG021890.
Appendix: Estimation of Absolute Ca2+ Levels from the Relative Responses of Two Ca2+-Sensitive Indicators
Fluorescence of a Ca2+ indicator inside the cell can be approximated as
| (1) |
where εI and εCaI are the extinction coefficients, and qI and qCaI are the quantum yields of the Ca2+-free and Ca2+-bound forms of the indicator, respectively. f is the fraction of Ca2+-bound indicator ([CaI]/[I]total). For typical BAPTA-based fluorescent indicators with a single Ca2+ binding site, f is equal to
| (2) |
For most of the intensity-based Ca2+ fluorescent indicators qCaI ≫ qI, whereas the extinction coefficients are comparable (35,36). Thus, Eqs. 1 and 2 can be rewritten as:
Frest, F1, and F2 are the indicator fluorescence intensities at rest and during stimuli 1 and 2. Δ[Ca2+]1 and Δ[Ca2+]2 are corresponding buffered Ca2+ influxes in response to those stimuli. Assuming Δ[Ca2+]1, Δ[Ca2+]2 > [Ca2+]rest, the relative changes in the fluorescence of the indicator can be written as
| (3) |
Comparison of the relative fluorescent responses of two indicators with different Ca2+ affinities to a similar set of two stimuli allows for generation of two linear equations that can be solved for Δ[Ca2+]1 and Δ[Ca2+]2. In the case of rhod-FF (FF) and rhod-5N (5N), Eq. 3 can be rewritten as
The solutions for these equations are
| (4) |
| (5) |
More accurate estimates of Ca2+ concentration for each stimulus can be calculated by estimation of the resting Ca2+ concentration with a high-affinity indicator and adding it to the buffered Ca2+ influx values found using the equations above, [Ca2+] = [Ca2+]rest + Δ[Ca2+]. However, in the case of mitochondria, Ca2+ concentration at rest is typically several orders of magnitude smaller than after stimulus-induced Ca2+ uptake. Thus, the buffered Ca2+ influx values represent good quantitative estimates of equilibrium mitochondrial free Ca2+ concentration.
Supporting Material
References
- 1.Erecińska M., Dagani F. Relationships between the neuronal sodium/potassium pump and energy metabolism. Effects of K+, Na+, and adenosine triphosphate in isolated brain synaptosomes. J. Gen. Physiol. 1990;95:591–616. doi: 10.1085/jgp.95.4.591. [DOI] [PMC free article] [PubMed] [Google Scholar]
- 2.Duchen M.R. Ca2+-dependent changes in the mitochondrial energetics in single dissociated mouse sensory neurons. Biochem. J. 1992;283:41–50. doi: 10.1042/bj2830041. [DOI] [PMC free article] [PubMed] [Google Scholar]
- 3.Ivannikov M.V., Sugimori M., Llinás R.R. Synaptic vesicle exocytosis in hippocampal synaptosomes correlates directly with total mitochondrial volume. J. Mol. Neurosci. 2013;49:223–230. doi: 10.1007/s12031-012-9848-8. [DOI] [PMC free article] [PubMed] [Google Scholar]
- 4.Ivannikov M.V., Harris K.M., Macleod G.T. Mitochondria: enigmatic stewards of the synaptic vesicle reserve pool. Front. Synaptic Neurosci. 2010;2:145. doi: 10.3389/fnsyn.2010.00145. [DOI] [PMC free article] [PubMed] [Google Scholar]
- 5.Chance B., Williams G.R. The respiratory chain and oxidative phosphorylation. Adv. Enzymol. Relat. Subj. Biochem. 1956;17:65–134. doi: 10.1002/9780470122624.ch2. [DOI] [PubMed] [Google Scholar]
- 6.Cortassa S., Aon M.A., O’Rourke B. An integrated model of cardiac mitochondrial energy metabolism and calcium dynamics. Biophys. J. 2003;84:2734–2755. doi: 10.1016/S0006-3495(03)75079-6. [DOI] [PMC free article] [PubMed] [Google Scholar]
- 7.Chouhan A.K., Ivannikov M.V., Macleod G.T. Cytosolic calcium coordinates mitochondrial energy metabolism with presynaptic activity. J. Neurosci. 2012;32:1233–1243. doi: 10.1523/JNEUROSCI.1301-11.2012. [DOI] [PMC free article] [PubMed] [Google Scholar]
- 8.Mank M., Griesbeck O. Genetically encoded calcium indicators. Chem. Rev. 2008;108:1550–1564. doi: 10.1021/cr078213v. [DOI] [PubMed] [Google Scholar]
- 9.Paredes R.M., Etzler J.C., Lechleiter J.D. Chemical calcium indicators. Methods. 2008;46:143–151. doi: 10.1016/j.ymeth.2008.09.025. [DOI] [PMC free article] [PubMed] [Google Scholar]
- 10.Chouhan A.K., Zhang J., Macleod G.T. Presynaptic mitochondria in functionally different motor neurons exhibit similar affinities for Ca2+ but exert little influence as Ca2+ buffers at nerve firing rates in situ. J. Neurosci. 2010;30:1869–1881. doi: 10.1523/JNEUROSCI.4701-09.2010. [DOI] [PMC free article] [PubMed] [Google Scholar]
- 11.Filippin L., Abad M.C., Pozzan T. Improved strategies for the delivery of GFP-based Ca2+ sensors into the mitochondrial matrix. Cell Calcium. 2005;37:129–136. doi: 10.1016/j.ceca.2004.08.002. [DOI] [PubMed] [Google Scholar]
- 12.Macleod G.T., Hegström-Wojtowicz M., Atwood H.L. Fast calcium signals in Drosophila motor neuron terminals. J. Neurophysiol. 2002;88:2659–2663. doi: 10.1152/jn.00515.2002. [DOI] [PubMed] [Google Scholar]
- 13.Launikonis B.S., Zhou J., Ríos E. Confocal imaging of [Ca2+] in cellular organelles by SEER, shifted excitation and emission ratioing of fluorescence. J. Physiol. 2005;567:523–543. doi: 10.1113/jphysiol.2005.087973. [DOI] [PMC free article] [PubMed] [Google Scholar]
- 14.de la Fuente S., Fonteriz R.I., Alvarez J. Dynamics of mitochondrial [Ca2+] measured with the low-Ca2+-affinity dye rhod-5N. Cell Calcium. 2012;51:65–71. doi: 10.1016/j.ceca.2011.10.007. [DOI] [PubMed] [Google Scholar]
- 15.Palmer A.E., Giacomello M., Tsien R.Y. Ca2+ indicators based on computationally redesigned calmodulin-peptide pairs. Chem. Biol. 2006;13:521–530. doi: 10.1016/j.chembiol.2006.03.007. [DOI] [PubMed] [Google Scholar]
- 16.Palmer A.E., Tsien R.Y. Measuring calcium signaling using genetically targetable fluorescent indicators. Nat. Protoc. 2006;1:1057–1065. doi: 10.1038/nprot.2006.172. [DOI] [PubMed] [Google Scholar]
- 17.Rizzuto R., Simpson A.W., Pozzan T. Rapid changes of mitochondrial Ca2+ revealed by specifically targeted recombinant aequorin. Nature. 1992;first8:325–327. doi: 10.1038/358325a0. [DOI] [PubMed] [Google Scholar]
- 18.Brandenburger Y., Kennedy E.D., Capponi A.M. Possible role for mitochondrial calcium in angiotensin II- and potassium-stimulated steroidogenesis in bovine adrenal glomerulosa cells. Endocrinology. 1996;137:5544–5551. doi: 10.1210/endo.137.12.8940382. [DOI] [PubMed] [Google Scholar]
- 19.Jiang D., Zhao L., Clapham D.E. Genome-wide RNAi screen identifies Letm1 as a mitochondrial Ca2+/H+ antiporter. Science. 2009;326:144–147. doi: 10.1126/science.1175145. [DOI] [PMC free article] [PubMed] [Google Scholar]
- 20.Brand M.D. Measurement of mitochondrial protonmotive force. In: Brown G.C., Cooper C.E., editors. Bioenergetics. A Practical Approach. IRL Press; Oxford: 1995. pp. 39–62. [Google Scholar]
- 21.Arrington D.D., Van Vleet T.R., Schnellmann R.G. Calpain 10: a mitochondrial calpain and its role in calcium-induced mitochondrial dysfunction. Am. J. Physiol. Cell Physiol. 2006;291:C1159–C1171. doi: 10.1152/ajpcell.00207.2006. [DOI] [PubMed] [Google Scholar]
- 22.Arnaudeau S., Kelley W.L., Demaurex N. Mitochondria recycle Ca2+ to the endoplasmic reticulum and prevent the depletion of neighboring endoplasmic reticulum regions. J. Biol. Chem. 2001;276:29430–29439. doi: 10.1074/jbc.M103274200. [DOI] [PubMed] [Google Scholar]
- 23.Núñez L., Senovilla L., García-Sancho J. Bioluminescence imaging of mitochondrial Ca2+ dynamics in soma and neurites of individual adult mouse sympathetic neurons. J. Physiol. 2007;580:385–395. doi: 10.1113/jphysiol.2006.126524. [DOI] [PMC free article] [PubMed] [Google Scholar]
- 24.Vay L., Hernández-SanMiguel E., Alvarez J. Mitochondrial free [Ca2+] levels and the permeability transition. Cell Calcium. 2009;45:243–250. doi: 10.1016/j.ceca.2008.10.007. [DOI] [PubMed] [Google Scholar]
- 25.David G., Talbot J., Barrett E.F. Quantitative estimate of mitochondrial [Ca2+] in stimulated motor nerve terminals. Cell Calcium. 2003;33:197–206. doi: 10.1016/s0143-4160(02)00229-4. [DOI] [PubMed] [Google Scholar]
- 26.Fonteriz R.I., de la Fuente S., Alvarez J. Monitoring mitochondrial [Ca2+] dynamics with rhod-2, ratiometric pericam and aequorin. Cell Calcium. 2010;48:61–69. doi: 10.1016/j.ceca.2010.07.001. [DOI] [PubMed] [Google Scholar]
- 27.Favaron M., Bernardi P. Tissue-specific modulation of the mitochondrial calcium uniporter by magnesium ions. FEBS Lett. 1985;183:260–264. doi: 10.1016/0014-5793(85)80789-4. [DOI] [PubMed] [Google Scholar]
- 28.von Stockum S., Basso E., Bernardi P. Properties of Ca2+ transport in mitochondria of Drosophila melanogaster. J. Biol. Chem. 2011;286:41163–41170. doi: 10.1074/jbc.M111.268375. [DOI] [PMC free article] [PubMed] [Google Scholar]
- 29.Yamada E.W., Huzel N.J. Calcium-binding ATPase inhibitor protein of bovine heart mitochondria. Role in ATP synthesis and effect of Ca2+ Biochemistry. 1989;28:9714–9718. doi: 10.1021/bi00451a026. [DOI] [PubMed] [Google Scholar]
- 30.Denton R.M., Randle P.J., Martin B.R. Stimulation by calcium ions of pyruvate dehydrogenase phosphate phosphatase. Biochem. J. 1972;128:161–163. doi: 10.1042/bj1280161. [DOI] [PMC free article] [PubMed] [Google Scholar]
- 31.Rutter G.A., Denton R.M. Regulation of NAD+-linked isocitrate dehydrogenase and 2-oxoglutarate dehydrogenase by Ca2+ ions within toluene-permeabilized rat heart mitochondria. Interactions with regulation by adenine nucleotides and NADH/NAD+ ratios. Biochem. J. 1988;252:181–189. doi: 10.1042/bj2520181. [DOI] [PMC free article] [PubMed] [Google Scholar]
- 32.Rutter G.A., Denton R.M. The binding of Ca2+ ions to pig heart NAD+-isocitrate dehydrogenase and the 2-oxoglutarate dehydrogenase complex. Biochem. J. 1989;263:453–462. doi: 10.1042/bj2630453. [DOI] [PMC free article] [PubMed] [Google Scholar]
- 33.Williamson J.R., Cooper R.H. Regulation of the citric acid cycle in mammalian systems. FEBS Lett. 1980;117(Suppl):K73–K85. doi: 10.1016/0014-5793(80)80572-2. [DOI] [PubMed] [Google Scholar]
- 34.Talbot J., Barrett J.N., David G. Stimulation-induced changes in NADH fluorescence and mitochondrial membrane potential in lizard motor nerve terminals. J. Physiol. 2007;579:783–798. doi: 10.1113/jphysiol.2006.126383. [DOI] [PMC free article] [PubMed] [Google Scholar]
- 35.Haugland R.P. 9th ed. Molecular Probes; Eugene, OR: 2002. Handbook of Fluorescent Probes and Research Products. [Google Scholar]
- 36.Soibinet M., Souchon V., Valeur B. Rhod-5N as a fluorescent molecular sensor of cadmium(II) ion. J. Fluoresc. 2008;18:1077–1082. doi: 10.1007/s10895-008-0352-z. [DOI] [PubMed] [Google Scholar]
Associated Data
This section collects any data citations, data availability statements, or supplementary materials included in this article.