

Abstract
The development of high-throughput metabolic profiling and the study of the metabolome are particularly important in brain research where small molecules or metabolites play fundamental signalling roles: neurotransmitters, signalling lipids, osmolytes and even ions. Metabolic profiling has shown that metabolic perturbations in the brain go beyond alterations of neurotransmission and that variations in brain metabolic homeostasis are associated with neurological disorders. In this report, we will focus on recent developments in the field of metabolic phenotyping that have contributed to unravelling the pathophysiology of neurological diseases. Also, we will highlight the necessity of implementing systems biology approaches to integrate metabolic data and tackle the structural and functional complexity of the brain in normal and pathological conditions.
Introduction
The study of the metabolome is particularly suited for brain research as small molecules play fundamental roles. Among other metabolites, neurotransmitters are the chemical messengers between neurons via synapses, signalling lipids act as secondary messengers and relay information from the synapse to the neuronal soma, osmolytes are essential for maintaining osmotic balance in the brain, and ions play a crucial role in neurotransmission and as enzymes cofactors. Given the variety of neuronal pathways regulated by small molecules, it comes as no surprise that perturbations in the metabolic balance of the brain can provoke important neurological disorders. However, several studies have demonstrated that the importance of brain metabolism extends beyond neurotransmission and secondary messengers, and that neurological disease may be associated with variations in intermediary and energy metabolism [1-4].
In this report, we will review the recent developments in metabolic phenotyping that have contributed to unravelling the pathophysiology of neurological diseases. Also, we will introduce systems biology approaches to integrate metabolic data and tackle the structural and functional complexity of the brain in normal and pathological conditions. Importantly, we will show that metabolomics and systems biology might not only lead to a better understanding of diseases of complex aetiology but could also be key methodologies to predict neurological diseases and individual drug responses.
Metabonomics, metabolomics and neurodegenerative disorders, a recent affair
Metabonomics has been defined as understanding the metabolic responses of living systems to pathophysiological stimuli via multivariate statistical analysis of biological nuclear magnetic resonance (NMR) spectroscopic data [5,6]. This is essentially a differential profiling approach, whereas metabolomics was originally defined as the large-scale analysis of the entire complement of small molecules (<1KDa), or metabolome, produced by a biological system: cell, tissue, organ or organism [7], just like the term genome refers to the entire gene content of an individual. The distinction between these two terms has now faded and the use of the alternative terms ‘metabolic profiling’ or ‘metabolic phenotyping’ is increasing. Quantifying the metabolome is of great biological interest since metabolites are the endpoints of many biological processes in the body and their identity and abundance directly reflect biological perturbations originating from collective modifications of the genome, transcriptome and proteome [5]. While transcriptomic or proteomic data do not grant access to the physiological status of the analysed matrix, metabonomics provide a characteristic fingerprint of the metabolic state of a given sample. As such, metabonomics was originally applied to the study of a metabolic response to toxic stimuli [5,6], such as metabolic dysfunctions in systemic metabolic disorders, i.e. insulin resistance-associated non-alcoholic fatty liver disease [8], diabetes [9,10], hypertension [11] or coronary artery diseases [12]. Over the last decade, the study of the metabolome has driven considerable attention in the field of neurological disorders since it enables the quantification of neurochemicals with signalling properties, such as neurotransmitters and signalling lipids, osmolytes, oxidative stress markers and even ions. Furthermore, metabonomics can be applied to a variety of biological matrices: intact biopsies or post-mortem tissue, tissue or cell extracts and biofluids such as cerebrospinal fluid (CSF), plasma and urine (Figure 1A).
Figure 1. Typical metabonomics workflow.

Standardized samples collection (A) is followed by NMR or mass spectrometry data acquisition (B). Multivariate statistical analysis of spectral data enables classification and/or prediction of case and control samples based on statistical scores. Model coefficients or loadings (black triangles) are derived to highlight the single or group of peaks assigned to metabolites (here, to simplify representation, only 5 metabolites are represented: m1 to m5) whose variations maximize the discrimination between case and control samples (C). Pattern recognition statistical methods define disease-specific metabolic signatures (D), which correspond to the pattern of significantly affected metabolites (purple dots) representing candidate biomarkers of the disease.
Analytical and chemometric techniques used for metabonomics
Metabolic profiling is typically performed using two main analytical techniques: High Resolution proton NMR (1H NMR) and mass spectrometry, which undergo continual refinement (Figure 1B). 1H NMR spectroscopy has been widely used for structural identification purposes in organic chemistry for decades, and is now used extensively in metabolic applications, providing low-cost per sample, rapid, highly reproducible and high-throughput analyses with minimal preparation for liquid samples (biofluids, brain extracts). Developments in the NMR field now allow metabolic profiling directly on intact tissues using high-resolution magic-angle spinning NMR [13]. This preserves sample integrity that can be further analysed using other “omics”. The main advantage of mass spectrometry is its high sensitivity and therefore its ability to detect low concentration metabolites. Sample extraction is a prerequisite prior to mass spectrometry, which is usually coupled to a separation step using either gas or liquid chromatography depending on the type of matrix analysed. Metal ions such as zinc, copper or iron, or elements such as calcium, potassium or sodium with essential roles in neuronal functions can be identified and quantified using inductively coupled plasma mass spectrometry [14]. Over the past five years, the use of improved metabolomic and analytical techniques has doubled the known size of the human CSF metabolome [15]. A recent study has detected 476 distinct metabolites in normal human CSF, of which 36% are routinely detectable with a metabolomic NMR/mass spectrometry multi-platform [15].
Biological samples, such as brain tissue, display a great biochemical complexity reflecting the coexistence of hundreds or thousands of distinct metabolites. As a result, NMR and mass spectrometry spectra are very dense, with thousands of signals, and mathematical modelling is essential to highlight relevant metabolites (Figure 1B). Pattern recognition methods have been developed to facilitate spectral interpretation and statistical modelling of the metabolic response to pathological events [16]. These analyses are essential for disease prediction. Typically, principal component analysis (PCA) will be used to study total variance, whereas partial least squares (PLS) models will be used to highlight specific trends. In linear models, such as PCA and PLS, the original variables are used to generate a new set of coordinates: scores provide information about class separation and are used for adequate classification of samples on the new axes (Figure 1C). Model coefficients, or loadings, correspond to a combination of the initial spectral variables to compute the new axes and are used to determine the metabolites responsible for the discrimination between classes. It is generally unlikely that a single metabolite is perturbed, but rather a unique combination of changes in a subset of metabolites may provide a specific metabolic signature of the disease, resulting in a disease-specific pattern of significantly affected metabolites (Figure 1D). For example, neuronal osmolyte and neurotransmitter precursor N-acetyl-aspartate is the second most abundant metabolite in the brain, after the amino acid and neurotransmitter glutamate. Cerebral N-acetyl-aspartate levels are systematically decreased in a variety of neurological diseases, including Alzheimer's disease [17,18], schizophrenia [19] and fragile X syndrome [3]. As such, N-acetyl-aspartate decrease is now considered as a hallmark of brain dysfunction, although this variation is not specific to a disease in particular. When modelling the signature of a fragile X syndrome mouse model in the brain, a metabolic signature combining changes in the levels of eight metabolites, including N-acetyl-aspartate, was responsible for the accurate class prediction (diseased versus control) of cortical samples [3].
Metabolic phenotyping to study mouse models of neurological diseases
The applications of metabonomics to the neuroscience field are only beginning, notably with the characterization of the neurochemical and metabolic profile of murine models of neurological disorders [20], including neurodegenerative diseases such as spino-cerebellar ataxia [21], Huntington's disease [22] or Alzheimer's disease [18]. Recently, a neuroprotective treatment in a mouse model of epilepsy was proven to be effective in normalizing the brain metabolic signature of epilepsy using a 1H NMR-based metabonomic approach [23]. Using HR magic-angle spinning 1H NMR-based metabolic profiling, we have identified a metabolic signature and biomarkers associated with fragile X syndrome, the leading genetic cause of intellectual disability and autism-spectrum disorders, in various brain regions of its mouse model, the Fmr1-deficient mouse [3]. Our study has highlighted that Fmr1 gene inactivation has profound, albeit coordinated, consequences on 25 brain metabolites, notably leading to alterations in levels of neurotransmitters (e.g. γ-aminobutyric acid (GABA), glutamate, acetylcholine and aspartate) and their precursors (e.g. glutamate, acetate, choline), secondary messenger precursors (e.g. inositol), energy metabolism products (e.g. lactate, acetate and acetoacetate) and oxidative stress markers (e.g. lipid oxidised species). Metabonomic studies in a mouse model of Huntington's disease have identified characteristic metabolite profiles across several biological matrices (urine, plasma and intact brain tissue), suggesting that brain dysfunctions can also be detected in biofluids [24]; this is particularly timely as metabolic profiling holds promise for minimally invasive detection of brain disorders.
Metabonomics as a predictive and analytical tool to study human neurological diseases
Strikingly, the application of metabonomics to the analysis of biopsies and biofluids (e.g. plasma, urine, CSF) of patients affected by neurological diseases has seen tremendous developments in the last 10 years, highlighting the fact that metabonomics have a unique and specific potential for applications in the fields of physiological evaluation, diagnosis and drug therapy monitoring of neurological diseases.
CSF is a matrix of choice to study brain dysfunctions [15]. Given this, a seminal study used a metabonomics approach to detect a unique combination of subtle metabolic changes in the CSF of drug-naïve patients with first-onset schizophrenia, resulting in alterations in glucoregulatory processes [1]. Strikingly, the CSF metabolic profile was able to distinguish patients from healthy controls with a confidence of 85%. Further analysis revealed that early antipsychotic treatment normalizes the metabolic profile of treated subjects towards a control profile in half the patients well before a clinical improvement was observed [1]. A 1H NMR-based metabonomics study on ex vivo brain tissue indicated the molecular changes associated with the pathophysiology and drug treatment of bipolar disorder patients leading to the identification of biomarkers of this disorder in post-mortem brain samples, but also of secondary side effects associated with drug treatment [19]. A similar study has provided evidence for disease and antipsychotic medication effects in post-mortem brain from schizophrenia patients [25]. More recently, mass spectrometry-based metabonomics were used to predict the disease status of post-mortem Alzheimer's disease biopsies [17]. NMR-based metabonomics have also been used to define biomarkers and to grade malignancy of CNS cancers using oligodendroma [26] or meningioma [27] biopsies. One study has determined a metabolic signature of malignant glioma in human CSF, enabling accurate discrimination between affected patients and controls [28]. Quite strikingly, it appears that brain dysfunctions can be mirrored in other biofluids, such as plasma and urine. In fact, individuals with neurological disorders have distinct metabolic profiles that can contribute to accurate diagnosis using metabolic profiling of these easily accessible samples. Interestingly, an ultra performance liquid chromatography-mass spectrometry and NMR-based metabonomic study has even identified a metabolic signature in plasma samples from schizophrenia patients upon treatment with the anti-psychotic risperidone [4]. Also, plasma metabolic profiling of Parkinson's Disease patients differentiated between idiopathic and genetic forms of the disease [29]. Importantly, one study has reported that metabolic profiling of urine samples can discriminate between samples from children affected by autism spectrum disorders, their unaffected siblings and age-matched controls [30]. Lately, an NMR-based metabonomic analysis of the serum of first-trimester pregnant women reported novel metabolic markers for the prediction of foetal Down Syndrome [31].
These studies highlight the huge potential and versatility of metabolic phenotyping to identify biomarkers of neurological diseases across various biological matrices, including the easily collectable biological matrices such as plasma and urine. Also, metabonomics can be used to assess treatment efficacy and determine secondary side effects associated with the metabolic breakdown products of drugs with potential toxicity. This is particularly pertinent in the context of psychiatric conditions of complex aetiology, where patients are often subjected to heavy medication with metabolic secondary side effects, e.g. typical and atypical antipsychotics with associated metabolic syndromes.
The importance of systems biology for the interpretation and integration of metabolomic data in the context of neurological diseases
Once metabolic biomarkers of a disease of interest have been assigned and adequately quantified, systems biology can then be applied to enhance the biological interpretation of metabolic signatures. For example, mapping metabolic biomarkers onto biological networks enhances the understanding of complex metabolic signatures at the pathway level. The combination of metabonomics with systems biology in the field of neurological diseases is only beginning but has a very promising future. First, metabolite-set enrichment analysis (MSEA, [32]), an extension of the gene-set enrichment analysis (GSEA) [33], can be used to identify which metabolic pathways are enriched in the metabolic signature and highlight biologically relevant pathways. We used MSEA to highlight alterations of glutamate metabolism and oxidative stress response in the cortex of a fragile X syndrome mouse model [3]. However, to enhance our understanding of the mechanisms linking the disease-causing gene (Figure 2A) to the metabolic signature of fragile X syndrome, we developed a novel alternative strategy, named “integrated metabolome and interactome mapping” (iMIM). iMIM is based on mapping metabolic phenotypes (Figure 2B) directly onto protein-protein interactions, metabolite-enzyme interactions and ligand-receptor interactions networks extracted from literature and databases (Figure 2C) [3]. As the estimated number of protein-protein interactions approaches 650,000 [34], it has become necessary to analyse the topology of the resulting network to identify key proteins regulating the metabolic phenotype associated with the disease-causing genes (Figure 2D). In this type of network, the shortest paths between causal genes and the downstream metabolic consequences are computed and compiled to identify the central proteins (i.e. the busiest proteins) in the interaction network [3]. This is achieved using network statistics such as the “betweenness” [35], which can be used to highlight key proteins that relay the signal between the causal genes and the metabolites. Further developments of the iMIM methodology could introduce weighting factors integrating other “omics” data, for example, taking into account variations in transcriptomic or proteomic profiles could help in refining the bioinformatic predictions of key proteins and key pathways and increase biological relevancy towards the studied disease.
Figure 2. Principles of integrated metabolome and interactome mapping (iMIM): a biomolecular GPS to navigate the underlying signalling networks and understand metabolic signatures.
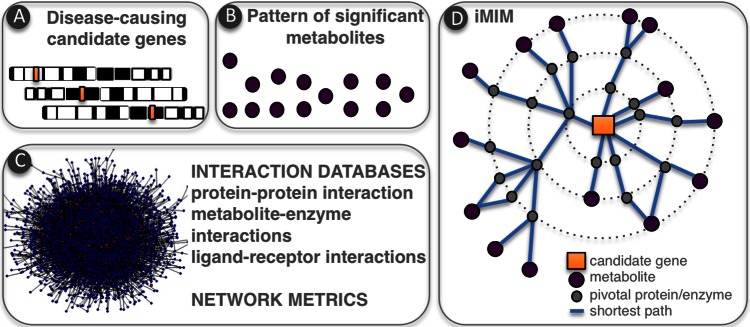
Disease-causing candidate genes (A) are analysed in relation to patterns of significant metabolites (B) via protein-protein and metabolite-protein interactions (C). In iMIM, network metrics are used to define shortest paths and pivotal proteins between metabolites and disease-causing genes (D).
When it comes to the integration of “omics” data, one important development is the statistical integration of multiple data levels (i.e. different “-omics”), which is commonly used in the field of metabolic diseases. A recent study used hierarchical clustering for the integration of metabolic and transcriptomic data to assess brain chemistry [36]; however, such an integrative approach has yet to be applied to neurological diseases. Such combined multi-omics platforms analysis should be developed using mouse models or clinical samples of neurological diseases to increase the confidence in disease prediction.
Future directions
In the future, one important development of metabonomics and systems biology and their application to the study of neurological diseases would be to search for genetic determinants of the observed metabolic signature. Brain metabolic profiles could be correlated to DNA polymorphisms and haplotypes to identify quantitative trait loci for metabolic traits (mQTL), following the mQTL approach originally applied to the study of metabolic diseases [9]. The affordability of next-generation sequencing methods holds promise for high-throughput acquisition of large-scale single nucleotide polymorphism (SNP) data which, in combination with corresponding metabolomic data, would enable mQTL applications to highlight susceptibility loci and genes for neurological diseases of complex aetiology, such as schizophrenia or autism-spectrum disorders in the near future.
Finally, another critical application of metabolic phenotyping is pharmacometabonomics, which predicts the response of an individual to a stimulus (e.g. drug, toxin, surgery, disease) prior to the treatment [37]. For example, pharmacometabonomics typically uses pre-dose measurements for prediction of toxicity or efficacy of specific drugs [38]. It is an integral part of predictive biology, aimed at understanding pre-existing phenotypic differences and their medium- to long-term beneficial or pathological impact on interventions. This is particularly suited for psychiatric conditions such as schizophrenia, in which treatment optimization and subsequent stabilization of patients can often be a complex and long process. The approach has major implications for improved efficiency in drug discovery efforts, for example, identifying non-responders and characterizing the molecular basis of their non-responsiveness in preclinical studies, or for better stratification of patients in drug clinical trials and for individualized therapies [37].
In conclusion, the use of state-of-the-art spectrometry, statistics and systems biology has initiated a shift in neurological sciences. There is now a body of evidence showing that brain metabolism goes beyond neurotransmitter synthesis and that intermediate metabolism contributes to complex brain disorders. It is now anticipated that from the availability of comprehensive profiling methods, coupled with innovative network biology approaches, will eventually emerge a high-precision mapping of metabolic phenotypes onto the genome and the interactome, enhancing our understanding of brain metabolism in health and disease.
Acknowledgments
Laetitia Davidovic acknowledges the generous support of the FRAXA Research Foundation, the Agence Nationale de la Recherche (ANR JCJC SVE6 MetaboXFra), the Conseil Général 06 and Fondation Jérôme Lejeune. MED is funded by EC-FP7 and Institut Merieux. Marc-Emmanuel Dumas and Laetitia Davidovic receive support of The Royal Society - CNRS International Exchange Program (IE120728).
Abbreviations
- CSF
cerebral spinal fluid
- GABA
γ-aminobutyric acid
- HR 1H NMR
high resolution proton nuclear magnetic resonance
- iMIM
integrated metabolome and interactome mapping
- mQTL
metabolic quantitative trait loci
- MSEA
metabolite set enrichment analysis
- NMR
nuclear magnetic resonance
- PCA
principal component analysis
- PLS
partial least squares
Disclosures
The authors declare that they have no disclosures.
The electronic version of this article is the complete one and can be found at: http://f1000.com/prime/reports/b/5/18
References
- 1.Holmes E, Tsang TM, Huang JT, Leweke FM, Koethe D, Gerth CW, Nolden BM, Gross S, Schreiber D, Nicholson JK, Bahn S. Metabolic profiling of CSF: evidence that early intervention may impact on disease progression and outcome in schizophrenia. PLoS Med. 2006;3:e327. doi: 10.1371/journal.pmed.0030327. [DOI] [PMC free article] [PubMed] [Google Scholar]; f1000.com/prime/718010567
- 2.Prabakaran S, Swatton JE, Ryan MM, Huffaker SJ, Huang JT, Griffin JL, Wayland M, Freeman T, Dudbridge F, Lilley KS, Karp NA, Hester S, Tkachev D, Mimmack ML, Yolken RH, Webster MJ, Torrey EF, Bahn S. Mitochondrial dysfunction in schizophrenia: evidence for compromised brain metabolism and oxidative stress. Mol Psychiatry. 2004;9:684–97. doi: 10.1038/sj.mp.4001532. 643. [DOI] [PubMed] [Google Scholar]; f1000.com/prime/718010568
- 3.Davidovic L, Navratil V, Bonaccorso CM, Catania MV, Bardoni B, Dumas ME. A metabolomic and systems biology perspective on the brain of the Fragile X syndrome mouse model. Genome Res. 2011;12:2190–202. doi: 10.1101/gr.116764.110. [DOI] [PMC free article] [PubMed] [Google Scholar]
- 4.Cai HL, Li HD, Yan XZ, Sun B, Zhang Q, Yan M, Zhang WY, Jiang P, Zhu RH, Liu YP, Fang PF, Xu P, Yuan HY, Zhang XH, Hu L, Yang W, Ye HS. Metabolomic analysis of biochemical changes in the plasma and urine of first-episode neuroleptic-naive schizophrenia patients after treatment with risperidone. J Proteome Res. 2012;11:4338–50. doi: 10.1021/pr300459d. [DOI] [PubMed] [Google Scholar]; f1000.com/prime/718010570
- 5.Nicholson JK, Lindon JC, Holmes E. ‘Metabonomics’: understanding the metabolic responses of living systems to pathophysiological stimuli via multivariate statistical analysis of biological NMR spectroscopic data. Xenobiotica. 1999;29:1181–9. doi: 10.1080/004982599238047. [DOI] [PubMed] [Google Scholar]
- 6.Nicholson JK, Lindon JC. Systems biology: Metabonomics. Nature. 2008;455:1054–1056. doi: 10.1038/4551054a. [DOI] [PubMed] [Google Scholar]; f1000.com/prime/10609959
- 7.Oliver SG, Winson MK, Kell DB, Baganz F. Systematic functional analysis of the yeast genome. Trends Biotechnol. 1998;16:373–8. doi: 10.1016/S0167-7799(98)01214-1. [DOI] [PubMed] [Google Scholar]
- 8.Dumas ME, Barton RH, Toye A, Cloarec O, Blancher C, Rothwell A, Fearnside J, Tatoud R, Blanc V, Lindon JC, Mitchell SC, Holmes E, McCarthy MI, Scott J, Gauguier D, Nicholson JK. Metabolic profiling reveals a contribution of gut microbiota to fatty liver phenotype in insulin-resistant mice. Proc Natl Acad Sci U S A. 2006;103:12511–6. doi: 10.1073/pnas.0601056103. [DOI] [PMC free article] [PubMed] [Google Scholar]
- 9.Dumas ME, Wilder SP, Bihoreau MT, Barton RH, Fearnside JF, Argoud K, D'Amato L, Wallis RH, Blancher C, Keun HC, Baunsgaard D, Scott J, Sidelmann UG, Nicholson JK, Gauguier D. Direct quantitative trait locus mapping of mammalian metabolic phenotypes in diabetic and normoglycemic rat models. Nat Genet. 2007;39:666–72. doi: 10.1038/ng2026. [DOI] [PubMed] [Google Scholar]
- 10.Wang TJ, Larson MG, Vasan RS, Cheng S, Rhee EP, McCabe E, Lewis GD, Fox CS, Jacques PF, Fernandez C, O'Donnell CJ, Carr SA, Mootha VK, Florez JC, Souza A, Melander O, Clish CB, Gerszten RE. Metabolite profiles and the risk of developing diabetes. Nat Med. 2011;17:448–53. doi: 10.1038/nm.2307. [DOI] [PMC free article] [PubMed] [Google Scholar]; f1000.com/prime/11069956
- 11.Holmes E, Loo RL, Stamler J, Bictash M, Yap IK, Chan Q, Ebbels T, De Iorio M, Brown IJ, Veselkov KA, Daviglus ML, Kesteloot H, Ueshima H, Zhao L, Nicholson JK, Elliott P. Human metabolic phenotype diversity and its association with diet and blood pressure. Nature. 2008;453:396–400. doi: 10.1038/nature06882. [DOI] [PMC free article] [PubMed] [Google Scholar]; f1000.com/prime/1105206
- 12.Brindle JT, Antti H, Holmes E, Tranter G, Nicholson JK, Bethell HW, Clarke S, Schofield PM, McKilligin E, Mosedale DE, Grainger DJ. Rapid and noninvasive diagnosis of the presence and severity of coronary heart disease using 1H-NMR-based metabonomics. Nat Med. 2002;8:1439–44. doi: 10.1038/nm1202-802. [DOI] [PubMed] [Google Scholar]; f1000.com/prime/718010571
- 13.Garrod S, Humpfer E, Spraul M, Connor SC, Polley S, Connelly J, Lindon JC, Nicholson JK, Holmes E. High-resolution magic angle spinning 1H NMR spectroscopic studies on intact rat renal cortex and medulla. Magn Reson Med. 1999;41:1108–18. doi: 10.1002/(SICI)1522-2594(199906)41:6<1108::AID-MRM6>3.0.CO;2-M. [DOI] [PubMed] [Google Scholar]; f1000.com/prime/718010572
- 14.van Heuveln F, Meijering H, Wieling J. Inductively coupled plasma-MS in drug development: bioanalytical aspects and applications. Bioanalysis. 2012;4:1933–65. doi: 10.4155/bio.12.141. [DOI] [PubMed] [Google Scholar]; f1000.com/prime/718010573
- 15.Mandal R, Guo AC, Chaudhary KK, Liu P, Yallou FS, Dong E, Aziat F, Wishart DS. Multi-platform characterization of the human cerebrospinal fluid metabolome: a comprehensive and quantitative update. Genome Med. 2012;4:38. doi: 10.1186/gm337. [DOI] [PMC free article] [PubMed] [Google Scholar]; f1000.com/prime/717597900
- 16.Fonville JM, Richards SE, Barton RH, Boulange CL, Ebbels TMD, Nicholson JK, Holmes E, Dumas ME. The evolution of partial least squares models and related chemometric approaches in metabonomics and metabolic phenotyping. J Chemometr. 2010;24:636–49. doi: 10.1002/cem.1359. [DOI] [Google Scholar]
- 17.Graham SF, Chevallier OP, Roberts D, Holscher C, Elliott CT, Green BD. Investigation of the human brain metabolome to identify potential markers for early diagnosis and therapeutic targets of Alzheimer's disease. Anal Chem. 2013;85:1803–11. doi: 10.1021/ac303163f. [DOI] [PubMed] [Google Scholar]; f1000.com/prime/718010574
- 18.Salek RM, Xia J, Innes A, Sweatman BC, Adalbert R, Randle S, McGowan E, Emson PC, Griffin JL. A metabolomic study of the CRND8 transgenic mouse model of Alzheimer's disease. Neurochem Int. 2010;56:937–47. doi: 10.1016/j.neuint.2010.04.001. [DOI] [PubMed] [Google Scholar]
- 19.Lan MJ, McLoughlin GA, Griffin JL, Tsang TM, Huang JT, Yuan P, Manji H, Holmes E, Bahn S. Metabonomic analysis identifies molecular changes associated with the pathophysiology and drug treatment of bipolar disorder. Mol Psychiatry. 2009;14:269–79. doi: 10.1038/sj.mp.4002130. [DOI] [PubMed] [Google Scholar]; f1000.com/prime/718010575
- 20.Holmes E, Tsang TM, Tabrizi SJ. The application of NMR-based metabonomics in neurological disorders. NeuroRx. 2006;3:358–72. doi: 10.1016/j.nurx.2006.05.004. [DOI] [PMC free article] [PubMed] [Google Scholar]; f1000.com/prime/718010576
- 21.Griffin JL, Cemal CK, Pook MA. Defining a metabolic phenotype in the brain of a transgenic mouse model of spinocerebellar ataxia 3. Physiol Genomics. 2004;16:334–40. doi: 10.1152/physiolgenomics.00149.2003. [DOI] [PubMed] [Google Scholar]
- 22.Tsang TM, Haselden JN, Holmes E. Metabonomic characterization of the 3-nitropropionic acid rat model of Huntington's disease. Neurochem Res. 2009;34:1261–71. doi: 10.1007/s11064-008-9904-5. [DOI] [PubMed] [Google Scholar]
- 23.Fauvelle F, Carpentier P, Dorandeu F, Foquin A, Testylier G. Prediction of neuroprotective treatment efficiency using a HRMAS NMR-based statistical model of refractory status epilepticus on mouse: a metabolomic approach supported by histology. J Proteome Res. 2012;11:3782–95. doi: 10.1021/pr300291d. [DOI] [PubMed] [Google Scholar]; f1000.com/prime/718010577
- 24.Tsang TM, Woodman B, McLoughlin GA, Griffin JL, Tabrizi SJ, Bates GP, Holmes E. Metabolic characterization of the R6/2 transgenic mouse model of Huntington's disease by high-resolution MAS 1H NMR spectroscopy. J Proteome Res. 2006;5:483–92. doi: 10.1021/pr050244o. [DOI] [PubMed] [Google Scholar]
- 25.Chan MK, Tsang TM, Harris LW, Guest PC, Holmes E, Bahn S. Evidence for disease and antipsychotic medication effects in post-mortem brain from schizophrenia patients. Mol Psychiatry. 2011;16:1189–202. doi: 10.1038/mp.2010.100. [DOI] [PubMed] [Google Scholar]; f1000.com/prime/718010578
- 26.Erb G, Elbayed K, Piotto M, Raya J, Neuville A, Mohr M, Maitrot D, Kehrli P, Namer IJ. Toward improved grading of malignancy in oligodendrogliomas using metabolomics. Magn Reson Med. 2008;59:959–65. doi: 10.1002/mrm.21486. [DOI] [PubMed] [Google Scholar]
- 27.Monleon D, Morales JM, Gonzalez-Darder J, Talamantes F, Cortes O, Gil-Benso R, Lopez-Gines C, Cerda-Nicolas M, Celda B. Benign and atypical meningioma metabolic signatures by high-resolution magic-angle spinning molecular profiling. J Proteome Res. 2008;7:2882–8. doi: 10.1021/pr800110a. [DOI] [PubMed] [Google Scholar]
- 28.Locasale JW, Melman T, Song S, Yang X, Swanson KD, Cantley LC, Wong ET, Asara JM. Metabolomics of human cerebrospinal fluid identifies signatures of malignant glioma. Mol Cell Proteomics. 2012;11:M111. doi: 10.1074/mcp.M111.014688. 014688. [DOI] [PMC free article] [PubMed] [Google Scholar]; f1000.com/prime/13489138
- 29.Johansen KK, Wang L, Aasly JO, White LR, Matson WR, Henchcliffe C, Beal MF, Bogdanov M. Metabolomic profiling in LRRK2-related Parkinson's disease. PLoS One. 2009;4:e7551. doi: 10.1371/journal.pone.0007551. [DOI] [PMC free article] [PubMed] [Google Scholar]; f1000.com/prime/718010579
- 30.Yap IK, Angley M, Veselkov KA, Holmes E, Lindon JC, Nicholson JK. Urinary metabolic phenotyping differentiates children with autism from their unaffected siblings and age-matched controls. J Proteome Res. 2010;9:2996–3004. doi: 10.1021/pr901188e. [DOI] [PubMed] [Google Scholar]; f1000.com/prime/718010580
- 31.Bahado-Singh RO, Akolekar R, Mandal R, Dong E, Xia J, Kruger M, Wishart DS, Nicolaides K. Metabolomic analysis for first-trimester Down syndrome prediction. Am J Obstet Gynecol. 2013 doi: 10.1016/j.ajog.2012.10.763. [DOI] [PubMed] [Google Scholar]; f1000.com/prime/718010581
- 32.Xia J, Wishart DS. MSEA: a web-based tool to identify biologically meaningful patterns in quantitative metabolomic data. Nucleic Acids Res. 2010;38(Suppl):W71–77. doi: 10.1093/nar/gkq329. [DOI] [PMC free article] [PubMed] [Google Scholar]
- 33.Subramanian A, Tamayo P, Mootha VK, Mukherjee S, Ebert BL, Gillette MA, Paulovich A, Pomeroy SL, Golub TR, Lander ES, Mesirov JP. Gene set enrichment analysis: a knowledge-based approach for interpreting genome-wide expression profiles. Proc Natl Acad Sci U S A. 2005;102:15545–50. doi: 10.1073/pnas.0506580102. [DOI] [PMC free article] [PubMed] [Google Scholar]; f1000.com/prime/1030064
- 34.Stumpf MP, Thorne T, de Silva E, Stewart R, An HJ, Lappe M, Wiuf C. Estimating the size of the human interactome. Proc Natl Acad Sci U S A. 2008;105:6959–64. doi: 10.1073/pnas.0708078105. [DOI] [PMC free article] [PubMed] [Google Scholar]; f1000.com/prime/1111122
- 35.Freeman LC. A set of measures of centrality based on betweenness. Sociometry. 1977;40:35–41. doi: 10.2307/3033543. [DOI] [Google Scholar]
- 36.Knolhoff AM, Nautiyal KM, Nemes P, Kalachikov S, Morozova I, Silver R, Sweedler JV. Combining Small-Volume Metabolomic and Transcriptomic Approaches for Assessing Brain Chemistry. Anal Chem. 2013 doi: 10.1021/ac3032959. [DOI] [PMC free article] [PubMed] [Google Scholar]; f1000.com/prime/718010582
- 37.Nicholson JK, Everett JR, Lindon JC. Longitudinal pharmacometabonomics for predicting patient responses to therapy: drug metabolism, toxicity and efficacy. Expert Opin Drug Metab Toxicol. 2012;8:135–9. doi: 10.1517/17425255.2012.646987. [DOI] [PubMed] [Google Scholar]
- 38.Clayton TA, Lindon JC, Cloarec O, Antti H, Charuel C, Hanton G, Provost JP, Le Net JL, Baker D, Walley RJ, Everett JR, Nicholson JK. Pharmaco-metabonomic phenotyping and personalized drug treatment. Nature. 2006;440:1073–7. doi: 10.1038/nature04648. [DOI] [PubMed] [Google Scholar]; f1000.com/prime/13779