

Abstract
Protein glycosylation has a major influence on functions of proteins. Studies have shown that aberrations in glycosylation are indicative of disease conditions. This has prompted major research activities for comparative studies of glycoproteins in biological samples. Multiple reaction monitoring (MRM) is a highly sensitive technique which has been recently explored for quantitative proteomics. In this work, MRM was adopted for quantification of glycopeptides derived from both model glycoproteins and depleted human blood serum using glycan oxonium ions as transitions. The utilization of oxonium ions aids in identifying the different types of glycans bound to peptide backbones. MRM experiments were optimized by evaluating different parameters that have a major influence on quantification of glycopeptides, which include MRM time segments, number of transitions, and normalized collision energies. The results indicate that oxonium ions could be adopted for the characterization and quantification of glycopeptides in general, eliminating the need to select specific transitions for individual precursor ions. Also, the specificity increased with the number of transitions and a more sensitive analysis can be obtained by providing specific time segments. This approach can be applied to comparative and quantitative studies of glycopeptides in biological samples as illustrated for the case of depleted blood serum sample.
Keywords: Glycoproteins, glycopeptides, quantification, LC-MS/MS
Introduction
Protein glycosylation is one of the most important and common post translational modifications. It has a major influence on various functional aspects of proteins which include structural and modulatory functions [1]. The glycan moiety on the glycoprotein also modifies its physiochemical properties such as solubility, stability, protease resistance etc., which has a major effect on the function [2]. Changes in glycosylation have been correlated to a number of diseases, including Alzheimer's disease [3, 4], diabetes mellitus [5, 6], rheumatoid arthritis [7, 8], and cancer [9–11]. For example, cancer leads to aberrant expression of N-Acetylneuramic acid (NeuAc), which is considered to be a result of a mutation in the enzyme hydroxylase [12]. There are two major types of glycosylation, namely N-glycosylation and O-glycosylation [13]. N-glycosylation involves the attachment of N-acetylglucosamine (GlcNAc) to a peptide motif NXT/NXS, where X is any amino acid except proline. Not all the potential sites of glycosylation would be glycosylated which adds to the complexity of glycopeptide analysis as it is challenging to determine the exact occupancy of (or lack of) protein glycosylation sites. On the other hand, O-glycosylation does not involve any specific motif. Structural microheterogeneity of glycopeptide, which is defined as the attachment of different glycan structures to the same glycosylation site, poses additional challenges for analysis and quantification.
Currently, liquid chromatography interfaced to mass spectrometry (LC-MS and LC-MS/MS) is considered to be the most routinely applied method for the identification and quantification of protein glycosylation. In this approach, glycoproteins are first enzymatically digested (i.e., trypsin), separated using LC, and then subjected to MS and tandem MS (MS/MS) analyses [14]. Several studies have shown that LC-MS and LC-MS/MS can be successfully used to identify glycoproteins [15–17]. Comparative studies on glycosylation using LC-MS and LC-MS/MS have demonstrated the applicability of these methods to decipher aberrations in glycosylation associated with diseased samples [18, 19]. Also, techniques like lectin affinity chromatography and peptide labeling are used in conjunction with LC-MS to enrich samples of interest [20–22]. Although LC-MS and LC-MS/MS are widely used to enable effective characterization of this posttranslational modification, they still suffer from several limitations originating from the ionization efficiency of glycopeptides and glycoforms associated with a single glycosylation site. The ionization efficiency of glycopeptides is weak as compared to those of peptides, thus suppressing the intensities of glycopeptides in LC-MS/MS analyses. Moreover, the same peptide possibly possesses multiple glycoforms (microheterogeneity) which are detected as separate glycopeptides, thus diminishing the signal intensity.
Multiple reaction monitoring (MRM) is an LC-MS/MS which has not been extensively explored as an option for the quantification of glycopeptides. In the MRM mode, the mass spectrometer scans for only specific precursor ions defined by the users. During MRM, the first quadrupole (Q1) scans for specific precursor ions which undergo collision induced dissociation (CID) in the second quadrupole (Q2), and result in fragments. Specific fragments of the precursor ions are scanned in the third quadrupole (Q3). These fragments are specific m/z originating from the precursor ion and are commonly referred to as transitions. This mode of analysis greatly reduces noise and enhances signal intensity since the number of precursor ions having identical product ions is limited. Selected reaction monitoring (SRM) involves a single transition to detect a precursor ion, whereas MRM involves multiple transitions. The selection of fragment ions that represent and characterize the precursor ion is an essential requirement for effective MRM quantification. MRM relies on the ionization efficiency as well as fragmentation efficiency; therefore, it is critical to attain optimum conditions that prompt efficient fragmentation. Previous studies have demonstrated MRM as a sensitive method for quantification of proteins [2, 14, 23–25].
The focus of this study is to quantify the glycosylation site thus providing information regarding the occupancy of glycosylation site and the extent of occupancy with a particular glycan structure. This will enable observation of quantitative changes associated with a glycosylation site. Quantification of glycopeptides was performed using MRM. Oxonium ions that are diagnostic of glycopeptides were used as transitions in MRM mode. This approach eliminates the need to select transitions from tandem MS data, thus minimizing time required to devise an MRM experiment for the quantification of glycopeptides. Precursor ion scan (PIS), determining all precursor ions generating oxonium ions, was used as a criterion for selection of glycopeptides. Optimization of MRM experimental conditions were performed by evaluating several parameters, including the number of transitions, MRM time segmentation, and normalized collision energies. The optimum normalized collision energy (CE) value allowed efficient fragmentation of glycopeptides, thus permitting effective MRM quantification. Model glycoproteins like fetuin and AGP were initially utilized to optimize the abovementioned parameters. Optimized conditions were then employed to quantify glycopeptides derived from depleted human blood serum.
Experimental
Materials
Fetuin, α1-acid glycoprotein (AGP) and human blood serum (BS) were obtained from Sigma-Aldrich (St. Louis, MO). DL-dithiothreitol (DTT), iodoacetamide (IAA), ammonium bicarbonate, and MS-grade formic acid were also purchased from Sigma-Aldrich. HPLC-grade solvents, including methanol and isopropanol, were procured from Fisher Scientific (Pittsburgh, PA). HPLC grade water was acquired from Mallinckrodt Chemicals (Phillipsburg, NJ). HPLC grade acetonitrile was acquired from J.T.Baker (Phillipsburg, NJ). Trypsin gold, mass spectrometry grade was obtained from Promega (Madison, WI).
Depletion of the 7-most abundant proteins in blood serum
Agilent Plasma 7 Multiple Affinity Removal Spin Cartridge from Agilent Technologies (Santa Clara, CA) was used to deplete the 7-most abundant human serum proteins, namely albumin, IgG, antitrypsin, IgA, transferin, haptoglobin and fibrinogen. A 15-μl aliquot of human blood serum was depleted as stated in the protocol recommended by the manufacturer. The buffer of the depleted sample was exchanged into 20 mM ammonium bicarbonate using 5kDa MWCO spin concentrators from Agilent Technologies. This buffer is needed for efficient tryptic digestion
Protein Assay
Prior to tryptic digestion, the protein concentration of depleted BS was determined through micro BCA protein assay (Thermo Scientific/Pierce, Rockford, IL). A bovine serum albumin (BSA) standard stock solution of 2.0 mg/ml concentration provided in the micro BCA assay kit was used to prepare a set of diluted BSA standard samples with concentrations of 200 μg/ml, 40 μg/ml, 20 μg/ml, 10 μg/ml, 5 μg/ml, 2.5 μg/ml and 1 μg/ml. Ammonium bicarbonate (20mM) buffer was used to prepare the BSA standard samples. The micro BCA working reagent required for the assay was prepared by mixing reagents A, B, and C (provided by the vendor) at a ratio of 50:48:3. Next, a 10-μl aliquot of depleted BS was diluted in 140 μl of 20 mM ammonium bicarbonate buffer. BSA standard samples and BS sample were then mixed with 150-μl aliquots of the working buffer and transferred to a 96-Well Plate prior to incubation at 37° C for 2 hours. The concentration was then measured at 620 nm wavelength on Multiskan plate-reader (Thermo Scientific, Rockford, IL). The calculated concentration was multiplied by the dilution factor to determine the original concentration of the depleted BS sample. These numbers suggest a 90.8 % depletion of high abundant proteins.
Tryptic digestion of model glycoproteins and blood serum proteins
Model glycoproteins fetuin and AGP were reduced by adding a 10-μl aliquot of 10 mM DTT prior to incubation at 60° C for 45 min. The reduced model glycoproteins were then alkylated with the addition of a 20-μl aliquot of 18.5 mM IAA and incubated at room temperature for 25 min in the dark. Unreacted IAA was consumed through the addition of a second 20-μl aliquot of 10 mM DTT. The reaction was allowed to proceed at room temperature for 25 min in the dark. This was followed by tryptic digestion involving the addition of a 4-μl aliquot of trypsin (enzyme/substrate ratio of 1:30 w/w) and overnight incubation at 37° C. To ensure complete enzymatic digestion, samples were subjected to microwave digestion at 45° C and 50W for 30min as previously described [26]. Tryptic digestion was quenched through the addition of a 7.4-μl aliquot of 0.1% aqueous formic acid solution to the samples.
In the case of the depleted BS sample, thermal denaturation was performed at 65° C for 5 min. A 1.25-μl aliquot of 200 mM DTT solution, which was prepared in 20 mM ammonium bicarbonate buffer, was then added to the sample prior to incubation at 60° C for 45 min. The sample was then alkylated through the addition of a 5-μl aliquot of 200 mM of IAA (prepared in the ammonium bicarbonate buffer) and incubation at room temperature for 45 min in the dark. Excess IAA was consumed through the addition of a second aliquot of DTT and incubation at room temperature for 30 min. The sample was then tryptically digested and incubated at 37 °C overnight followed by microwave digestion at 45° C and 50W for 30min. The amount of trypsin added to the samples (enzyme/substrate ratio of 1:25 w/w) was determined based on the protein concentration value calculated from micro BCA protein assay. Finally, the enzymatic digestion was terminated by adding 1 μl of neat formic acid.
LC-MSMS Conditions
The tryptically digested glycopeptides were subjected to the LC-MS/MS analysis using Dionex 3000 Ultimate nano-LC system from Dionex (Sunnyvale, CA) interfaced to TSQ Vantage triple stage quadrupole mass spectrometer from Thermo Scientific (San Jose, CA) equiped with nano-ESI source. Tryptically digested samples were initially online-purified on a PepMap 100 C18 cartridge (3 μm, 100Å, Dionex) and separated using a PepMap 100 C18 capillary column (75 μm id × 150 mm, 2 μm, 100Å, Dionex). The separation of model glycoproteins was achieved using a reversed-phase gradient, 20% solvent B (100% ACN with 0.1% formic acid) at 350 nl/min flow rate over 10 min, 10–45% over 35 min, 45–80% over 1 min, 80% over 4 min, 80–10% over 1 min, and 10% over 9min. Solvent A was an aqueous 2% ACN solution containing 0.1 % formic acid. In the case of the BS sample separation, LC gradient of solvent B was 10% over 10 min, 45% over 150 min, 45–80% over 5 min, 80% over 5min, 80–10% over 1 min, and 10% over 9 min. The separation and scan time for model glycoproteins was 60min. The BS samples were separated and analyzed for 180 min.
The TSQ Vantage mass spectrometer was operated in the data dependent acquisition (DDA) mode with two scan events. The first scan event was a full scan (300–1500 m/z) performed in the third quadrupole (Q3). The scan time and the peak width were 0.5 sec and 0.7 FWHM, respectively. In the second scan event (data dependant scan), 5 most intense ions based on masses determined from the first scan event were selected and subjected to tandem MSMS. PIS was also performed on the TSQ Vantage mass spectrometer after separating the glycopeptides using similar LC conditions as mentioned earlier. The PIS experiment consisted of 7 scan events each of which used an oxonium ion commonly observed in the tandem MS of glycopeptides. The glycopeptides identified in the PIS experiment were later on subjected to MRM experiments, using the oxonium ions utilized to generate PIS as transitions. The MRM experiments were performed at a scan time (dwell time) of 0.10 sec and peak width of 0.70 FWHM for 400–1500 m/z mass range. The normalized CE value was varied from 25–55% to determine the most conducive conditions. Peak areas/heights and S/N were determined using Xcalibur software ((Thermo Scientific, San Jose, CA). In the case of multiple transition experiments, the software generate a single chromatogram for each precursor ion generated by summing the intensities of all detected transitions.
The samples were also analyzed using Dionex 3000 Ultimate nano-LC system interfaced to LTQ Orbitrap Velos mass spectrometer (Thermo Scientific, San Jose, CA) in a data dependant mode with three scan events. The separation conditions were as mentioned above. The first scan event was a full MS scan of 380–2000 m/z at a resolution of 15,000. The second scan event was a CID tandem MS of precursor ions selected from the first scan event with an isolation width of 3.0 m/z, a normalized CE of 35%, and an activation Q value of 0.250. The third scan event was a higher energy collision dissociation (HCD) tandem MS on precursor ions selected from the first scan event. The isolation width was 3.0 m/z, while the normalized CE was 45% with an activation time of 0.1 ms. The CID and HCD tandem MS was performed on the 8 most intense ions observed in the first scan event. The LTQ orbitrap mass spectrometer offers high mass accuracy (2 ppm), thus permitting an unambiguous identification of glycopeptides.
Protein identification was accomplished using MASCOT database searching, and glycopeptides identification was performed using ExPASy GlycoMod tool. Proteome Discoverer version 1.2 software (Thermo Scientific, San Jose, CA) was used to generate mascot generic format file (*.mgf) which was subsequently employed for database searching using MASCOT version 2.3.2 (Matrix Science Inc., Boston, MA). Precursors were selected from a mass range of 350–5000 Da with a minimum peak count of 1. The parameters from Mascot Daemon were set to search against IPI-human database for AGP and human blood serum proteome and swissprot for fetuin. Iodoacetamide modification of cysteine was set as a fixed modification, while oxidation of methionine was set as a variable modification. An m/z tolerance of 5 ppm was set for the identification of peptide with 2 missed cleavages. Also, tandem MS ions were searched within 0.8 Da mass tolerance set with label-free quantification. ExPASy GlycoMod tool was utilized with searching parameters set to monoisotopic masses, 3 ppm mass tolerance and IAA modified cysteine.
Results and Discussion
MS Parameters Critical for MRM Quantification of Glycopeptides
Kuzyk et al. [14] have previously demonstrated the ability to use [13C]Arg or [13C]Lys isotopes to quantify 45 proteins in human plasma using MRM. This quantification was achieved by comparing peak area ratios. While they have focused on standard proteins, we are interested in the quantification of glycoproteins existing at low levels in biological samples. The high sensitivity and selectivity offered by MRM mode is expected to be advantageous for the quantification of glycopeptides. Quantification through MRM experiments can be performed with and without using time segments, which are termed here as segmented (SMRM) and non-segmented MRM (NSMRM), respectively. In the NSMRM mode, the triple quadrupole mass spectrometer is programmed to scan all the selected ions with specific transitions during any given time. This MRM mode is advantageous when the specific elution time of a particular peak is not known. In the SMRM mode, the mass spectrometer is programmed to scan for only those ions which elute during the predetermined time segment specified for that particular ion. Hence, the cycle time of the mass spectrometer for those ions decreases and more data points are collected, thus increasing measurement sensitivity.
The number of transitions selected for a specific ion also contributes to its quantification. The transitions enable a more certain and unequivocal identification and quantification of the glycopeptides. In the case of peptide quantification, transitions are representative of intense fragments ions that are unique for the peptide to be quantified, thus ensuring high sensitivity and reduced interference from other peptides [27]. Therefore, interrogation of individual tandem MS scans for selection of different transitions is required; however, several commercial software have somewhat eliminated the need for this step since they are capable of generating a list of peptides with their corresponding transitions. This is not true for glycopeptides; none of the commercially available software is able to generate a list of transitions for glycopeptides. Therefore, the use of oxonium ions can as transitions for glycopeptides in MRM experiments appears to be ideal and eliminate the need to interrogate tandem MS data to select appropriate transition. This is always true, since oxonium ions are invariably present as a result of glycan fragmentation of glycopeptides. Oxonium ion fragments originate from the glycan associated with a glycopeptide [33]. Figure 1 shows the fragmentation of glycopeptides in tandem MS acquired under different fragmentation mechanisms using different mass spectrometers. Figure 1A shows CID tandem MS of an ion with m/z 1039.565 (from depleted blood serum) acquired using triple quadrupole mass spectrometer, while Figure 1B and 1C show HCD and CID tandem MS of the same ion acquired using the orbitrap mass spectrometer. Red-labeled fragments correspond to the characteristic oxonium ions derived from the fragmentation of the glycans associated with this glycopeptide. CID tandem MS prompted an extensive fragmentation of the glycan moiety, since CID presents a lower energy fragmentation pathway and hence, results in a series of characteristic fragments associated with the glycopeptide [34]. As shown in Figure 1, unlike CID, HCD tandem MS using orbitrap mass spectrometer exhibits low m/z oxonium ions. As shown in Figure 1, the intensities of oxonium ions are at least 2-times higher than that of the other fragments observed in the CID tandem MS acquired by triple quadrupole mass spectrometer, thus suggesting that a better quantification of glycopeptides is attained when these ions are used as transitions in an MRM experiment. Moreover, we have observed that the intensities of glycopeptides are 2–3 times higher when using oxonium ions transitions relative to other fragments transitions (data not shown).
Figure 1.

Distribution of oxonium ion fragments. Tandem MS of an ion with m/z 1039.565 from depleted blood serum using CID from the triple quadrupole mass spectrometer (A), and using HCD (B) and using CID from the orbitrap mass spectrometer (C). Ions shown in red are oxonium ion fragments. In the case of the triple quadrupole mass spectrometer experiment, fragmentation was attained at 40% normalized collision energy and 1.0 mtorr Argon collision gas pressure. Orbitrap fragmentation experiments, 35% normalized collision energy and 0.1 ms reaction time was used in the case of HCD, while 35% normalized collision energy, 15 ms activation time and 0.25 Q-value were used in the case of CID.
To determine the most favorable number of transitions required for maximum quantification, a series of NSMRM and SMRM experiments was conducted. These included MRM experiments with 1 transition (274 m/z, selected reaction monitoring mode), 2 transitions (138 and 274 m/z), and 3 transitions (138, 274 and 657 m/z).
Additionally, optimum fragmentation contributes to maximum quantification. Collision energy determines the fragmentation patterns of the glycopeptides and hence, it is important to have adequate CE for sufficient and efficient fragmentation. If the CE supplied to the ions is high, it might result in excess fragmentation which leads to loss of integrity of diagnostic fragments. On the other hand, if the CE is inadequate, it might result in insufficient fragmentation of the glycopeptide.
Several optimization experiments were performed with different number of MRM segments and transitions. Also, experiments with different normalized CE values were conducted to determine the most optimum CE. These experiments were performed on model glycoproteins with the ultimate goal of determining universal conditions that can be effectively employed for the quantification of glycopeptides in general using MRM approach.
Optimization of MRM Conditions for the Quantification of Fetuin Glycopeptides
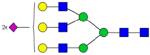
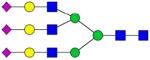
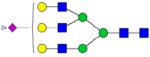
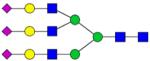
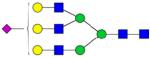
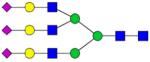
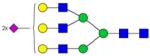
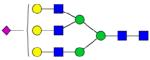
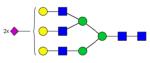
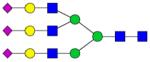
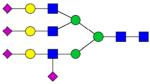
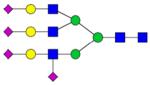
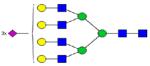
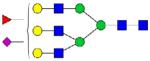
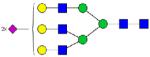
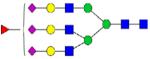
The glycopeptides listed in Table 1 were selected based on DDA and PIS. The PIS was conducted using oxonium ions characteristic of N-acetyl-hexosamine (HexNAc), N-acetylneuraminic acid (NeuAc, Sialic acid), and fucose (deoxyHex) as product ions. These included 138, 274, 657, 512, and 803 m/z which could aid in determining the N-glycan structures of the glycopeptides. The m/z value of 138 is that of an oxonium ion originating from HexNAc (HexNAc−2H2O−CH2O), while the ions with m/z values of 274 (NeuAc-H2O) and 657 (NeuAc+Hex+HexNAc) are diagnostic ions originating from sialylated glycopeptides with N-acetylneuraminc acid moiety (ies). The ions with m/z values of 512 (Hex+HexNAc+deoxyHex) and 803 (NeuAc+Hex+HexNAc+deoxyHex) are for fucosylated as well as fucosylated and sialylated glycopeptides, respectively. The chromatograms generated through PIS experiments were averaged and ions exhibiting an intensity of 103 or higher were selected and manually checked against the theoretical glycopeptide ions originating from fetuin. The identity of glycopeptides was also validated by comparing the fragmentation observed in the DDA acquired by both triple quadrupole and orbitrap mass spectrometers. As shown in Table 1, 17 glycopeptides were identified for fetuin. The glycan structures of these glycopeptides included monosialylated biantennary (1 glycopeptide), disialylated biantennary (4 glycopeptides), monosialylated triantennary (2 glycopeptides), disialylated triantennary (4 glycopeptides), trisialylated triantennary (4 glycopeptides), and tetrasialylated triantennary (2 glycopeptides). These glycopeptides were then selected for the MRM optimization experiments. Figure 2 illustrates selection of ions producing 274 m/z in PIS spectra. The PIS spectra originated from 274 m/z product ion was averaged over ~5 min as shown in Figure 2A. The m/z values, such as 1151.19, 1183.12, and 1315.85, were selected (Figure 2B). In the similar manner, ions with m/z values of 1176.15, 1249.19, and 1307.43 (Figure 2C), and 1176.26 and 1470.29 (Figure 2D) were selected. The ions shown in red (Figure 2) were manually validated against the theoretical glycopeptide ions originating from fetuin. Other sialylated glycopeptides were determined from the PIS spectra of 138 and 657 m/z product ions (data not shown).
Table 1.
List of glycopeptides selected for fetuin MRM experiments.
| Peptide | Peptide mass | Glycan | Theoretical m/z | Observed m/z (1 Da mass accuracy) | Observed m/z (2 ppm mass accuracy) |
|---|---|---|---|---|---|
| LCPDCPLL-APLNDSR | 1739.8334 |
|
[987.1592]+4 | [987.69]+4 | [987.6924]+4 |
|
|
[1315.876]+3 | [1316.45]+3 | [1315.4503]+3 | ||
|
[1437.587]+3 | [1437.76]+3 | [1437.7600]+3 | ||
|
[1151.216]+4 | [1151.77]+4 | [1151.7770]+4 | ||
| KLCPDCPL-LAPLNDSR | 1867.9284 |
|
[1358.575]+3 | [1359.14]+3 | [1358.1371]+3 |
|
[1480.285]+3 | [1480.6]+3 | [1480.6000]+3 | ||
|
[1183.2399]+4 | [1183.75]+4 | [1183.7639]+4 | ||
| VVHAVEVA-LATFNAE-SNGSYLQL-VEISR | 3015.5665 |
|
[1324.6017]+4 | [1324.16]+4 | [1324.1619]+4 |
|
[1176.5227]+5 | [1176.77]+5 | [1176.7700]+5 | ||
|
[1470.1494]+4 | [1470.83]+4 | [1470.7120]+4 | ||
| RPTGEVYD-IEIDTLETT-CHVLDPTP-LANCSVR | 3760.7606 |
|
[1176.316]+5 | [1176.77]+5 | [1176.7700]+5 |
|
|
[1469.8911]+4 | [1470.83]+4 | [1469.7120]+4 | ||
|
[1191.1233]+5 | [1190.3]+5 | [1190.3111]+5 | ||
|
[1249.3424]+5 | [1249.86]+5 | [1249.8580]+5 | ||
|
[1307.5615]+5 | [1308.12]+5 | [1308.1224]+5 | ||
|
[1365.7806]+5 | [1366.35]+5 | [1365.3447]+5 | ||
| VWPRRPT-GEVYDIEID-TLETTCHV-LDPTPLA-NCSVR | 4209.0622 |
|
[1473.4409]+5 | [1474.86]+5 | [1473.8453]+5 |
Figure 2.

Precursor ion-scan (PIS) chromatogram for the 274 m/z product ion of tryptic digest of fetuin glycoprotein (A). PIS averaged spectra from 36–40 min (B), 40–45 min (C), and 45–49 min (D). Ions shown in red are selected for subsequent MRM quantification experiments.
Each of the MRM experiments was performed in triplicate to allow statistical evaluation of the data. The peak height of the glycopeptides was assessed and the average peak height along with standard deviation (STD) was calculated. The data suggest that the average peak height for all the observed glycopeptides, except for an ion with m/z values of 987.69, increased as the number of MRM segments and transitions increased (see supplemental information). Figure 3 represents the bar graphs of the individual peak heights and the extracted ion chromatograms (EICs) of 1308.12 m/z (possessing a trisialylated triantennary glycan) acquired under different conditions. Figures 3A, 3B, and 3C correspond to EICs obtained for NSMRM with 1 transition (274 m/z), 2 transitions (138 m/z and 274 m/z), and 3 transitions (138 m/z, 274 m/z, and 657 m/z), respectively. Figures 3D, 3E, and 3F correspond to EICs obtained for SMRM with 1 transition (274 m/z), 2 transitions (138 m/z and 274 m/z) and 3 transitions (138 m/z,274 m/z, and 657 m/z), respectively. The SMRM experiment with 3 transitions (Figure 3F) resulted in maximum peak height and least STD values as shown in bar graphs. Employing multiple transitions for quantification is expected to prompt higher specificity of analysis. This is due to the fact that all three transitions would be generated with high intensities only in the case of precursor ions chosen for quantification. The increased specificity can also be demonstrated by the fact that the intensities of non specific peaks were found to be significantly lower in the case of NSMRM experiments with multiple transitions as compared to NSMRM experiments with single transition. Moreover, the increase in S/N ratios observed for glycopeptides is 3 fold higher than that of peptides when three transitions are used (supplementary Figure 1).
Figure 3.

Effect of MRM segmentation and number of transitions on the quantification of glycopeptides depicted for m/z 1308.12. Extracted ion chromatograms (EIC) of NSMRM with 1 transition (A), NSMRM with 2 transitions (B), NSMRM with 3 transition (C), SMRM with 1 transition (D), SMRM with 2 transitions (E), and SMRM with 3 transitions (F). The inset represents quantifications data of 3 MRM LC-MS/MS experiments.
Additionally, data points, cycle time, and the number of transitions affect the quality of MRM quantification. As the number of transitions increases, the cycle time increases leading to lower data points acquired across a peak since the dwell time is constant at 0.1 sec. The optimum number of data points for quantification is expected to be more than 10 across a peak [37]. Thus, NSMRM experiments with 3 transitions ensure a minimum of 6 data points at FWHM which is set at 0.7. If the number of transitions exceeds 3, the number of data points acquired will be less than 5 across the half width of a peak, thus compromising the quality of data collected.
Also, segmenting the MRM experiments according to the elution time of glycopeptides increases the sensitivity of the analysis, since the mass spectrometer scans only these ions during that specific time interval. Higher specificity and sensitivity observed when employing MRM segmentation and multiple transitions is expected to allow in better quantification.
Quantification of fetuin glycopeptides was also evaluated at different normalized CEs, including 25, 30, 35, 40, 45, and 55%. As shown in Figure 4, the triply charged ion with m/z 1316.45 (possessing disialylated biantennary glycan structure, Figure 4A) and the quadruply charged ion with m/z 1151.77 (possessing trisialylated triantennary glycan structure, Figure 4B) exhibit higher peak height at 40% normalized CE. The ion with charge state of 5 at m/z value of 1308.12 (possessing trisialylated triantennary glycan structure, Figure 4C) exhibits higher peak height at normalized CEs of 35% and higher. Although glycopeptides have different glycan structure (Figure 4A and 4B) associated with the same peptide backbone, the fragmentation efficiency observed for different normalized CEs appeared to be comparable. Also, the glycopeptides with same glycan structure on different peptide backbone (Figure 4B and 4C) exhibited comparable fragmentation efficiency for different normalized CE values. Accordingly, normalized CE of 40 % was adopted as the optimum CE needed to prompt efficient fragmentation for all glycopeptides.
Figure 4.

Comparison of normalized collision energies required to attain optimum quantification of glycopeptides. Bar graphs summarizing the distribution of peak heights for glycopeptides with m/z values of 1316.45 (A), 1151.77 (B), and 1308.12 (C).
Andersen et al [35] and Green et al. [36] have shown that the most abundant glycan structure associated with fetuin glycopeptides was the trisialylated triantennary glycans. The second most abundant structure associated was the disialylated triantennary structure. The results in this study agreed with the relative abundances of most fetuin glycans although with slight variations which can be attributed to the differences in sample preparation, method of analysis, etc. Additionally, the concentration linear dynamic range associated with fetuin glycopeptides was on average extending over more than 3 orders of magnitude with limiting of detection less than 1.4 fmole (linear plots of four fetuin glycopeptides are shown in supplementary Figure 2)
MRM Quantification of AGP Glycopeptides
Like fetuin glycopeptides, AGP glycopeptides subjected to MRM quantification were selected from the acquired PIS spectrum averaged for 8–10 minutes (Figure 5). The selected ions were determined to be glycopeptides as described for the case of fetuin. As shown in Figure 5B, ions with m/z 1000.92 and 1335.11 were observed in the PIS spectrum averaged from 16 to 23 min. Similarly, ions with m/z values of 1231.06, 1374.37 and 1495.97 (Figure 5C) were selected. Similar to fetuin, the ions shown in red (Figure 5) were manually checked against the theoretical glycopeptide ions originating from AGP. Selected glycopeptides were subsequently subjected to MRM quantification.
Figure 5.

Precursor ion-scan (PIS) chromatogram for the 274 m/z product ion of tryptic digest of AGP glycoprotein (A). PIS averaged spectra from 16–23 min (B), 24–36 min (C), and 36–47 min (D). Ions shown in red are selected for subsequent MRM quantification experiments.
The SMRM experiment with 3 transitions appeared to be optimum in the case of fetuin glycopeptides. We attempted to determine if these conditions are also valid for other glycopeptides derived from other glycoproteins. Hence, we conducted another set of SMRM and NSMRM with 3 transitions using 40% CE for glycopeptides originating from AGP. The data suggested that the SMRM experiment gave the highest peak heights with low STD values as compared to NSMRM (Table 2). The ions with m/z values of 1232.217 and 1396.366 exhibited higher peak heights for the NSMRM experiment as compared to SMRM. However, the SMRM experiment had lower STD values. Except these ions, most other ions resulted in the higher peak heights and lower STD values for SMRM experiment. Accordingly, it can be concluded that SMRM employing 3 transitions is the most suitable parameters for quantification of glycopeptides.
Table 2.
List of glycopeptides selected for AGP MRM experiments, and summary of results.
| Peptide | m/z | Glycan structure | NSMRM 3 Transitions | SMRM 3 Transitions | ||
|---|---|---|---|---|---|---|
| Average (xE3) | STD (xE3) | Average (xE3) | STD (xE3) | |||
| ENGTISR | 1335.592 |
|
2.76 | 0.9 | 4.46 | 0.7 |
| NEEYNK | 1001.61 |
|
5.89 | 1.4 | 9.50 | 1.5 |
| QIPLCANL-VPVPITNAT-LDQITGK | 1251.823 |
|
0.29 | 0.0 | 0.37 | 0.0 |
| QDQCIYNTT-YLNVQR | 1375.041 |
|
5.08 | 0.5 | 5.18 | 0.6 |
| 1496.82 |
|
12.98 | 1.4 | 13.53 | 1.0 | |
| 1232.217 |
|
2.59 | 0.3 | 2.54 | 0.3 | |
| 1396.366 |
|
2.56 | 0.3 | 2.14 | 0.2 | |
MRM Quantification of Depleted BS Glycopeptides
Since MRM experiment was effective for the quantification of glycopeptides derived from model glycoproteins, the applicability of this method to quantify human blood serum glycopeptides was also explored, especially for the glycoproteins in serum samples depleted from the top 7 most abundant proteins. Kurogochi et al. [28] have demonstrated the MRM quantification of pyridyl aminated (PA)-labeled sialylated glycopeptide (deglycosylated and non-depleted) from blood serum of mice enriched using reverse glycoblotting technique. Also, Li et al. [29] have previously shown the utility of SRM for the quantification of glycopeptide from serum samples spiked with different amounts of PSA (Prostrate-specific antigen). The optimum transitions used in their SRM experiments were fragments of heavy-isotope-labeled-peptide (deglycosylated) selected from tandem MS after performing multiple experiments. Unlike those studies, our approach is label free based on using oxonium ions as MRM transitions. Moreover, the use of oxonium ions eliminates the need for performing multiple experiments to determine the most optimum transitions for each specific glycopeptide.
In the case of the MRM quantification of depleted BS experiments, ions were selected from PIS spectrum as mentioned above. Although we identified more than 11 glycopeptides, we focused on these glycopeptides since they were easily identified and assigned to a known protein. As shown in Table 3, out of 11 glycopeptides, 9 were determined to possess mono/disialylated biantennary glycan structures, and 2 possess monofucosylated mono/disialylated biantennary glycan structures. This is expected since the most predominant glycan structure derived from human blood serum is disialylated biantennary [30]. Four of these glycopeptides originated from α-2-macroglobulin, two from hemopexin, and two from vitronectin. The other glycopeptides originated from antithrombin-III, complement component C9, and cDNA FLJ55606, highly similar to α-2-HS-glycoprotein. Figure 6 illustrates EIC of 2 glycopeptides and the bar graphs corresponding to their peak heights. The ion with m/z 1092.983 (Figure 6A) is a glycopeptide with disialylated biantennary glycan structure, while that of m/z 1408.430 (Figure 6B) is a glycopeptide with monofucosylated monosialylated biantennary glycan structure. Both glycopeptides originated from α-2-macroglobulin. As the data suggest, these transitions are optimum for characterization of glycopeptides resulting in peaks with good intensities. Wang et al. [31] have previously demonstrated an approach for characterization of glycopeptides from CID/ETD (electron transfer dissociation) using oxonium ions on the LTQ orbitrap mass spectrometer. Theoretical characterization of glycopeptides was based on averaged MS of the retention time of oxonium ions. Although they have suggested the use of MRM to validate their approach, no data were presented. On the other hand, our study mainly involves the identification and quantification of glycopeptides from minor proteins which collectively represent 9.2% of the total protein in blood serum. Also, Zhao et al [32] have shown the site-specific quantification of core fucosylated glycoprotein from hepatocellular carcinoma (HCC) samples adopting MRM technique using 3 optimum transitions which included a peptide backbone attached to GlcNAc and 2 other y-series ions. However, this technique only achieved the quantification of seven glycopeptides from six proteins. Out of the six, only three proteins were significantly different according to their study. On the other hand, with the technique mentioned in our study, we could quantify 11 glycopeptides from 6 proteins with minimal standard deviation.
Table 3.
List of glycopeptides selected for depleted BS MRM experiments, and summary of results.
| Protein | Peptide | Peptide mass | m/z | Glycan | SMRM 3 transitions | |
|---|---|---|---|---|---|---|
| Average (xE5) | STD (xE5) | |||||
| Alpha-2-macroglobulin | VSNQTLSL-FFTVLQDV-PVR | 2162.174 | 1092.983 |
|
12.59 | 2.5 |
| 1129.547 |
|
1.47 | 0.2 | |||
| 1360.26 |
|
3.57 | 1.2 | |||
| 1408.43 |
|
1.45 | 0.4 | |||
| Antithrombin-lll | SLTFNETY-QDISELVY-GAK | 2177.053 | 1462.158 |
|
1.48 | 0.5 |
| Complement component C9 | AVNITSENL-IDDVVSLIR | 1970.068 | 1044.426 |
|
0.98 | 0.2 |
| Hemopexin | SWPAVG-NCSSALR | 1403.662 | 1204.091 |
|
22.62 | 5.4 |
| ALPQPQNVT-SLLGCTH | 1734.872 | 1314.647 |
|
7.25 | 3.0 | |
| cDNA FLJ55606, highly similar to Alpha-2-HS-glycoprotein | VCQDCPLL-APLNDTR | 1770.839 | 1327.165 |
|
10.09 | 2.0 |
| Vitronectin | NGSLFAFR | 910.466 | 1039.565 |
|
4.83 | 0.6 |
| NISDGFDGIP-DNVDAALAL-PAHSYSGR | 2771.315 | 1245.473 |
|
4.46 | 1.8 | |
Figure 6.

MRM quantification of glycopeptides derived from depleted human blood serum sample. Extracted ion chromatograms of glycopeptides with m/z values of 1092.983 (sialylated glycopeptide, A) and 1408.430 (fucosylated sialyated glycopeptide, B). The insets represent bar graphs summarizing the quantification of the glycopeptides resulting from three experiments.
Conclusions
The enhanced sensitivity and selectivity of MRM makes it a better tool for quantification. To optimize conditions for MRM, we performed SMRM and NSMRM experiments on model glycoprotein fetuin evaluating the different number of transitions. The transitions were oxonium ions characteristic of glycopeptides. The results suggested that the SMRM with 3 transitions experiment exhibited maximum peak heights and reliable STD values. Also, 40% normalized CE produced better results with more efficient fragmentation. These conditions were validated using AGP and applied to blood serum and the results were found to be consistent with those for fetuin. These conditions appeared to be reliable for efficient glycopeptide quantification. We are currently utilizing this approach at its optimum conditions in comparative studies between disease and disease free samples of esophageal adenocarcinoma.
Supplementary Material
Acknowledgments
This work was supported by the office of the vice president for research at Texas Tech University and partially by an NIH grant from the National Institute of General Medical Sciences (1R01 GM093322-01).
References
- [1].Varki A, Cummings R, Esko J, Freeze H, Hart G, Marth J. Essentials of Glycobiology. Cold Spring Harbor; New York: 1999. [PubMed] [Google Scholar]
- [2].Kay RG, Gregory B, Grace PB, Pleasance S. The application of ultra-performance liquid chromatography/tandem mass spectrometry to the detection and quantitation of apolipoproteins in human serum. Rapid Commun. Mass Spectrom. 2007;21:2585. doi: 10.1002/rcm.3130. [DOI] [PubMed] [Google Scholar]
- [3].A-Manya K, Manya H, Sakurai Y, Wojczyk BS, Spitalnik SL, Endo T. Increased bisecting and core-fucosylated N-glycans on mutant human amyloid precursor proteins. Glycoconj J. 2008;25:775. doi: 10.1007/s10719-008-9140-x. [DOI] [PubMed] [Google Scholar]
- [4].Sihlbom C, Davidsson P, Nilsson CL. Prefractionation of cerebrospinal fluid to enhance glycoprotein concentration prior to structural determination with FT-ICR mass spectrometry. J Proteome Res. 2005;4:2294. doi: 10.1021/pr050210g. [DOI] [PubMed] [Google Scholar]
- [5].Poland DCW, Schalkwijk CG, Stehouwer CDA, Koeleman CAM, Van Het Hof B, Van Dijk W. Increased α3-fucosylation of α1-acid glycoprotein in Type I diabetic patients is related to vascular function. Glycoconjugate J. 2001;18:261. doi: 10.1023/a:1012412908983. [DOI] [PubMed] [Google Scholar]
- [6].Higai K, Azumaa Y, Aoki Y, Matsumoto K. Altered glycosylation of a1-acid glycoprotein in patients with inflammation and diabetes mellitus. Clinica Chimica Acta. 2003;329:117. doi: 10.1016/s0009-8981(02)00427-8. [DOI] [PubMed] [Google Scholar]
- [7].Elliott MA, Elliott HG, Gallagher K, McGuire J, Field M, Smith KD. Investigation into the concanavalin A reactivity, fucosylation and oligosaccharide microheterogeneity of α1-acid glycoprotein expressed in the sera of patients with rheumatoid arthritis. J of Chrom B Biomed Appl. 1997;688:229. doi: 10.1016/s0378-4347(96)00309-x. [DOI] [PubMed] [Google Scholar]
- [8].Smith KD, Pollacchi A, Field M, Watson J. The heterogeneity of the glycosylation of alpha-1-acid glycoprotein between the sera and synovial fluid in rheumatoid arthritis. Biomed Chromatogr. 2002;16:261. doi: 10.1002/bmc.158. [DOI] [PubMed] [Google Scholar]
- [9].Lau KS, Dennis JW. N-Glycans in cancer progression. Glycobiology. 2008;18:750. doi: 10.1093/glycob/cwn071. [DOI] [PubMed] [Google Scholar]
- [10].Block TM, Comunale MA, Lowman M, Steel LF, Romano PR, Fimmel C, Tennant BC, London WT, Evans AA, Blumberg BS, Dwek RA, Mattu TS, Mehta AS. Use of targeted glycoproteomics to identify serum glycoproteins that correlate with liver cancer in woodchucks and humans. Proc Natl Acad Sci USA. 2005;102:779. doi: 10.1073/pnas.0408928102. [DOI] [PMC free article] [PubMed] [Google Scholar]
- [11].Eda Machado, Sebastian Kandzia, Rita Carilho, Peter Altevogt, Harald S Conradt, Júlia Costa. N-Glycosylation of total cellular glycoproteins from the human ovarian carcinoma SKOV3 cell line and of recombinantly expressed human erythropoietin. Glycobiology. 2011;21:376. doi: 10.1093/glycob/cwq170. [DOI] [PubMed] [Google Scholar]
- [12].Lesley J, Hyman R, English N, Catterall JB, Turner GA. CD44 in inflammation and metastasis. Glycoconj. J. 1997;14:611. doi: 10.1023/a:1018540610858. [DOI] [PubMed] [Google Scholar]
- [13].An HJ, Froehlich JW, Lebrilla CB. Determination of Glycosylation Sites and Site-specific Heterogeneity in Glycoproteins. Current Opin. Chem. Biol. 2009;13:421. doi: 10.1016/j.cbpa.2009.07.022. [DOI] [PMC free article] [PubMed] [Google Scholar]
- [14].Kuzyk MA, Smith D, Yang J, Cross TJ, Jackson AM, Hardie DB, Leigh Anderson N, Borchers CH. Multiple Reaction Monitoring-based, Multiplexed, Absolute Quantitation of 45 Proteins in Human Plasma. Mol. Cell. Proteomics. 2009;8:1860. doi: 10.1074/mcp.M800540-MCP200. [DOI] [PMC free article] [PubMed] [Google Scholar]
- [15].Bond MR, Kohler JJ. Chemical methods for glycoprotein discovery. Curr. Opin. Chem. Biol. 2007;11:52. doi: 10.1016/j.cbpa.2006.11.032. [DOI] [PubMed] [Google Scholar]
- [16].Harazono A, Kawasaki N, Itoh S, Hashii N, I-Watabe A, Kawanishi T, Hayakawa T. Site-specific N-glycosylation analysis of human plasma ceruloplasmin using liquid chromatography with electrospray ionization tandem mass spectrometry. Anal. Biochem. 2006;348:259. doi: 10.1016/j.ab.2005.10.036. [DOI] [PubMed] [Google Scholar]
- [17].Mechref Y, Muzikar J, Novotny MV. Comprehensive assessment of N-glycans derived from a murine monoclonal antibody: a case for multimethodological approach. Electrophoresis. 2005;26:2034. doi: 10.1002/elps.200410345. [DOI] [PMC free article] [PubMed] [Google Scholar]
- [18].Balog CIA, Mayboroda OA, Wuhrer M, Hokke CH, Deelder AM, Hensbergen PJ. Mass Spectrometric Identification of Aberrantly Glycosylated Human Apolipoprotein C-IIIPeptides in Urine from Schistosoma mansoni-infected Individuals. Mol Cell Proteomics. 2010;9:667. doi: 10.1074/mcp.M900537-MCP200. [DOI] [PMC free article] [PubMed] [Google Scholar]
- [19].Whelan SA, Lu M, He J, Yan W, Saxton RE, Faull KF, Whitelegge JP, Chang HR. Mass Spectrometry (LC-MS/MS) site-mapping of N-glycosylated membrane proteins for breast cancer biomarkers. J. Proteome Res. 2009;8:4151. doi: 10.1021/pr900322g. [DOI] [PMC free article] [PubMed] [Google Scholar]
- [20].Madera M, Mann B, Mechref Y, Novotny MV. Efficacy of glycoprotein enrichment by microscale lectin affinity chromatography. J. Sep. Sci. 2008;31:2722. doi: 10.1002/jssc.200800094. [DOI] [PMC free article] [PubMed] [Google Scholar]
- [21].Nilsson J, Rüetschi U, Halim A, Hesse C, Carlsohn E, Brinkmalm G, Larson G. Enrichment of glycopeptides for glycan structure and attachment site identification. Nature Methods. 2009;6:809. doi: 10.1038/nmeth.1392. [DOI] [PubMed] [Google Scholar]
- [22].Wohlgemuth J, Karas M, Eichhorn T, Hendriks R, Andrecht S. Quantitative site-specific analysis of protein glycosylation by LC-MS using different glycopeptide-enrichment strategies. Anal Biochem. 2009;395:178. doi: 10.1016/j.ab.2009.08.023. [DOI] [PubMed] [Google Scholar]
- [23].-Zeng JS, Lange V, Ossola R, Eckhard K, Krek W, Aebersold R, Domon B. High sensitivity detection of plasma proteins by multiple reaction monitoring of N-glycosites. Mol. Cell. Proteomics. 2007;6:1809. doi: 10.1074/mcp.M700132-MCP200. [DOI] [PubMed] [Google Scholar]
- [24].Keshishian H, Addona T, Burgess M, Kuhn E, Carr SA. Quantitative, multiplexed assays for low abundance proteins in plasma by targeted mass spectrometry and stable isotope dilution. Mol. Cell. Proteomics. 2007;6:2212. doi: 10.1074/mcp.M700354-MCP200. [DOI] [PMC free article] [PubMed] [Google Scholar]
- [25].Addona TA, Abbatiello SE, Schilling B, Skates SJ, Mani DR, Bunk DM, Spiegelman CH, Zimmerman LJ, Ham AJ, Keshishian H, Hall SC, Allen S, Blackman RK, Borchers CH, Buck C, Cardasis HL, Cusack MP, Dodder NG, Gibson BW, Held JM, Hiltke T, Jackson A, Johansen EB, Kinsinger CR, Li J, Mesri M, Neubert TA, Niles RK, Pulsipher TC, Ransohoff D, Rodriguez H, Rudnick PA, Smith D, Tabb DL, Tegeler TJ, Variyath AM, Vega-Montoto LJ, Wahlander A, Waldemarson S, Wang M, Whiteaker JR, Zhao L, Anderson NL, Fisher SJ, Liebler DC, Paulovich AG, Regnier FE, Tempst P, Carr SA. Multi-site assessment of the precision and reproducibility of multiple reaction monitoring-based measurements of proteins in plasma. Nat. Biotechnol. 2009;27:633. doi: 10.1038/nbt.1546. [DOI] [PMC free article] [PubMed] [Google Scholar]
- [26].Segu ZM, Hammad LA, Mechref Y. Rapid and Efficient Glycoprotein Identification through Microwave-assisted Enzymatic Digestion. Rapid Commun. Mass Spectrom. 2010;24:3461. doi: 10.1002/rcm.4774. [DOI] [PubMed] [Google Scholar]
- [27].Yocum AK, Chinnaiyan AM. Current affairs in quantitative targeted proteomics: multiple reaction monitoring mass spectrometry. Brief. Funct. Genomic Proteomic. 2009;8:145. doi: 10.1093/bfgp/eln056. [DOI] [PMC free article] [PubMed] [Google Scholar]
- [28].Kurogochi M, Matsushista T, Amano M, Furukawa J, Shinohara Y, Aoshima M, Nishimura S-I. Sialic Acid-focused quantitative mouse serum glycoproteomics by multiple reaction monitoring assay. Mol. Cell. Proteomics. 2010;9:2354. doi: 10.1074/mcp.M110.000430. [DOI] [PMC free article] [PubMed] [Google Scholar]
- [29].Li Y, Tian Y, Rezai T, Prakash A, Lopez MF, Chan DW, Zhang H. Simultaneous analysis of glycosylated and sialylated prostate-specific antigen revealing differential distribution of glycosylated prostate-specific sntigen isoforms in prostate cancer tissues. Anal. Chem. 2011;83:240. doi: 10.1021/ac102319g. [DOI] [PMC free article] [PubMed] [Google Scholar]
- [30].Mechref Y, Novotny MV. Structural investigations of glycoconjugates at high sensitivity. Chem. Rev. 2002;102:321. doi: 10.1021/cr0103017. [DOI] [PubMed] [Google Scholar]
- [31].Wang D, Hincapie M, Rejtar T, Karger BL. Ultrasensitive characterization of site-specific glycosylation of affinity-purified haptoglobin from lung cancer patient plasma using 10 μm i.d. porous layer open tubular liquid chromatography-linear ion trap collision-induced dissociation/electron transfer dissociation mass spectrometry. Anal. Chem. 2011;83:2029. doi: 10.1021/ac102825g. [DOI] [PMC free article] [PubMed] [Google Scholar]
- [32].Zhao Y, Wei J, Wang J, Ying W, Zhang Y, Qian X. Fragmentation and site-specific quantification of core fucosylated glycoprotein by MRM-MS. Anal. Chem. 2011 doi: 10.1021/ac201676a. just accepted. [DOI] [PubMed] [Google Scholar]
- [33].Mayampurath AM, Wu Y, Segu ZM, Mechref Y, Tang H. Improving confidence in detection and characterization of protein N glycosylation sites and microheterogeneity. Rapid Commun. Mass Spectrom. 2011;25:2007. doi: 10.1002/rcm.5059. [DOI] [PubMed] [Google Scholar]
- [34].Alley WR, Jr., Mechref Y, Novotny MV. Characterization of glycopeptides by combining collision-induced dissociation and electron-transfer dissociation mass spectrometry data. Rapid Commun. Mass Spectrom. 2009;23:161. doi: 10.1002/rcm.3850. [DOI] [PubMed] [Google Scholar]
- [35].T.-Andersen M, Mysling S, Hojrup P. Site-specific glycoprofiling of N-linked glycopeptides using MALDI-TOF MS: strong correlation between signal strength and glycoform quantities. Anal Chem. 2009;81:3933. doi: 10.1021/ac900231w. [DOI] [PubMed] [Google Scholar]
- [36].Green ED, Adelt G, Baenziger JU. The asparagines-linked oligosaccharides on bovine fetuin. J of Biol Chem. 1988;263:18253. [PubMed] [Google Scholar]
- [37].Boyd RK, Basic C, Bethem RA. Trace Quantitative Analysis by Mass Spectrometry. John Wiley and Sons; New York: 2008. [Google Scholar]
Associated Data
This section collects any data citations, data availability statements, or supplementary materials included in this article.