Summary
For decades, the association between aberrant glycosylation and many types of cancers has been shown. However, defining the changes of glycan structures has not been demonstrated until recently. This has been facilitated by the major advances in mass spectrometry and separation science which allowed the detailed characterization of glycan changes associated with cancer. Mass spectrometry glycomics methods have been successfully employed to compare the glycomic profiles of different human specimen collected from disease-free individuals and patients with cancer. Additionally, comparing the glycomic profiles of glycoproteins purified from specimen collected from disease-free individuals and patients with cancer has also been performed. These types of glycan analyses employing mass spectrometry or liquid-chromatography mass spectrometry allowed the characterization of native, labeled, and permethylated glycans. This review discusses the different glycomic and glycoproteomic methods employed for defining glycans as cancer biomarkers of different organs, including breast, colon, esophagus, liver, lung, ovarian, pancreas and prostate.
Keywords: Cancer Biomarkers, Glycans, Glycoproteins, Glycomics, MALDI-MS, ESI-MS
Glycosylation of proteins is one of the most common protein posttranslational modifications (PTM), responsible for modulating and controlling many of the biological roles of glycoproteins. For example, cell communication, adhesion, and signaling depend on interactions between a glycan and its target protein(s)/glycoprotein(s) [1–4]. Protein glycosylation also plays a role in protein folding, stability, and localization [5]. Aberration in the glycan moieties of glycoproteins has been implicated in many mammalian diseases, including hereditary disorders, immune deficiencies, cardiovascular disease, and cancer [6, 7] The ability to utilize these changes to detect diseases at early stages have been the subject of many research efforts.
The glycans of glycoproteins are classified into N- or O-glycans. Glycans attached to an asparagine amino acid residue of an N-X (any amino acid but proline)-S/T motif are defined as N-glycans, while those that are commonly linked to either serine or threonine amino acid residues are labeled as O-glycans. O-Glycans attached to other amino acids, such as lysine, are also defined as O-type [8, 9]. The term “glycoform” is used to refer to proteins/peptides that have the same amino acid sequence but different glycan structures or compositions. The formation of glycoforms is prompted by the template-free nature of the glycosylation process, and controlled by the availability of several enzymes (transferases and/or exoglycosidases), protein transporters, and sugar nucleotides (building blocks) [10]. Accordingly, the glycosylation of glycoconjugates defines the development or disease states of organisms and cells. An example of the latter is malignant transformation [11, 12].
Glycans associated with glycoconjugates in biological specimen are routinely analyzed after chemical or enzymatic release. Native glycans do not ionize efficiently in MS. They also possess exceptionally low UV/VIS absorption coefficients, preventing efficient spectroscopic detection. Therefore, sensitive HPLC, CE, MS and LC-MS analyses [13–18] of released glycans is only attained after derivatization, such as methylation [19–23] or labeling with chromophores/fluorophores [14]. These analytical methods are routinely employed to generate both qualitative (structural) and quantitative information. MS and LC-MS are currently the method of choice for the characterization of glycans. Several recent reviews have described the use of both MALDI-MS [24–27] and LC-ESI-MS in glycan biomarker discovery in general [24–26, 28–30]. This review is concerned with highlighting the use of MS and LC-MS in defining N- and O-glycans structures as “putative” cancer biomarkers of different organs, including breast, colon, esophagus, liver, lung, ovarian, pancreas and prostate.
N-Glycans as Putative Cancer Biomarkers
MALDI and ESI have been employed to characterize glycans derived from purified glycoproteins and biological specimen (serum, plasma, and tissues). Changes associated with the development and progression of different cancers have been demonstrated using these techniques, including breast, colon, esophagus, liver, lung, ovary, pancreas and prostate. The ultimate goal of these research activities has been defining putative glycan biomarkers permitting the diagnosis and prognosis of cancer at high sensitivity and specificity. These studies have mainly focused on N-glycans, since several enzymes, permitting the efficient release of this type of glycans, are commercially available.
Breast Cancer
A statistically significant increase in sialylation and fucosylation of glycan structures associated with breast cancer progression was recently determined from the MALDI-MS glycomic profiles of permethylated N-glycans [31]. Different disease stages (12, stage I; 11, stage II; 9, stage III; and 50, stage IV) were distinguished with defined trends for many glycans. This was also true for breast cancer cell lines representing invasive breast cancer (MDA-MB-231 and MDA-MB-435), non-invasive breast cancer (578T, NCI/ADR-RES, BT549 and T47D) and normal epithelial breast cells (MCF10A) [31, 32].
HPLC glycomic profiling with fluorescence detection coupled with exoglycosidases and MS was employed (i) to determine glycomic changes of different breast cancer cohorts [33], (ii) to identify women with an aggressive form of breast cancer at an early stage[34] and (iii) to identify cancer patients with higher circulating tumor cell counts (CTCs) [35]. Enzymatically released N-glycans were labeled with 2-aminobenzamide prior to HPLC on a TSK gel Amide-80 or anion exchange columns. A significant increase (2-folds) in the abundance of trisialylated triantennary glycan containing α1,3-linked fucose (part of the Sialyl Lewis x (SLex) epitope) was observed in breast cancer patients (18 breast cancer patients with advanced disease state and 18 disease-free individuals) [33]. Lymph node-positive breast cancer patients (N=20) had significantly higher levels of agalactosyl fucosylated biantennary glycan and glycans containing the SLex epitope relative to lymph node-negative patients.
In another study employing the same analytical method, the abundance levels of several glycans representing SLex epitope in the blood serum of 13 healthy women and 27 breast cancer patients with advanced disease states determined by CTC levels (16 patients with CTCs <5/7.5 ml and 11 patients with CTCs >5/7.5 ml) were compared [35]. The individual and combined levels of core fucosylated triantennary with one terminal galactose (A3F1G1), and core fucosylated tetraantennary with one and two terminal galactose (A4F1G1 and A4F2G2, respectively) were found significantly higher in breast cancer patients with CTCs >5/7.5 ml than those of patients with CTCs <5/7.5 ml. The increase in the levels of A4F1G1 was more significant than that of A3F1G1. Glycans containing one SLex epitope but more antennae were more prevalent in breast cancer patients with CTCs ≥5/7.5 ml (A4F1G1 > A3F1G1 > A2F1G1). The results presented in all of these breast cancer studies were intriguing and interesting; however, the number of samples was rather small.
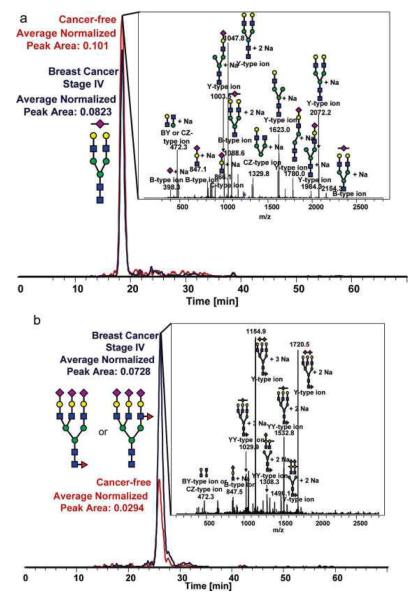
Reduced and permethylated N-linked glycans derived from breast cancer samples were also profiled employing a chip-based reversed-phase LC-ESI-MS method [36]. Similar to the other breast cancer studies, it was shown that breast cancer progression is correlated to increased branching and sialylation of glycans (Figure 1). Although the approach appeared to be attractive, it offers limited sensitivity because of the small sample loading capacity of the chip. Only 20 glycan structures were detected. This number is substantially lower than the number of structures observed in LC-MS [33]or MALDI-MS [31] analyses.
Figure 1.
Representative extracted-ion chromatograms for two statistically different N-linked glycans between cancer-free samples and Stage IV breast cancer samples derived from human blood serum glycoproteins. (a) The extracted-ion chromatogram for an N-linked biantennarymonosialylated glycan showing a decrease in relative abundance in the late-stage breast cancer sample and (b) the extractedion-chromatogram for an N-linked fucosylated triantennary-trisialylated glycan, showing a significant increase in this N-linked glycan's relative abundance in the pathological sample. Symbols: red triangle, fucose; blue square, HexNAc; green circle, mannose; yellow circle, galactose. Magenta diamond, sialic acid. Reproduced with permission from [36].
All of the breast cancer studies suggested the feasibility of utilizing glycomic profiling to assess breast cancer development and progression irrespective of the technique used. Interestingly, all studies agreed that an increase in the expression of glycans with multiple antenna, fucosylation and sialylation is correlated to different states of breast cancer. Although statistical validation of the results was reported, no clinical validation of the reported results was presented or discussed.
Colorectal Cancer
MALDI-MS glycomic profiling of permethylated N-glycans was also recently employed to evaluate proliferating and differentiated HT-29 human colon carcinoma cells [37]. High man structures (Hex5–9HexNAc2) and complex-type glycans (NeuAc0–4Fuc0–2Hex3–7HexNAc4–7) were observed in both proliferating and differentiated HT-29 cells. However, the latter exhibited significantly elevated levels of four m/z values (1836, 2082, 2286 and 2327) corresponding to monosaccharide compositions of Hex3–4HexNAc4–6DeoxyHex. Additionally, four GlcNAc-terminated N-glycans constituted nearly 25% of total glycans in differentiated cells, but were almost undetectable in proliferating cells [37].
Esophageal Adenocarcinoma
MALDI-MS profiling of permethylated N-glycans was utilized to delineate differences in glycosylation between esophagus diseases [38]. Glycomic profiles acquired for N-glycans derived from blood serum donated by 18 disease-free individuals, five Barrett's disease patients, 11 high grade dysplasia (HGD) patients and 50 esophageal adenocarcinoma (EAC) patients were compared. This was very effective not only in distinguishing cancer from disease-free, but also in differentiating between the other cohorts. This study demonstrated for the first time the possibility of using glycan biomarkers for the prediction of different esophagus diseases. This aspect of glycomic profiling suggests that the changes observed in the glycomic profile are disease-type specific and not related to immune response.
Liver Cancer
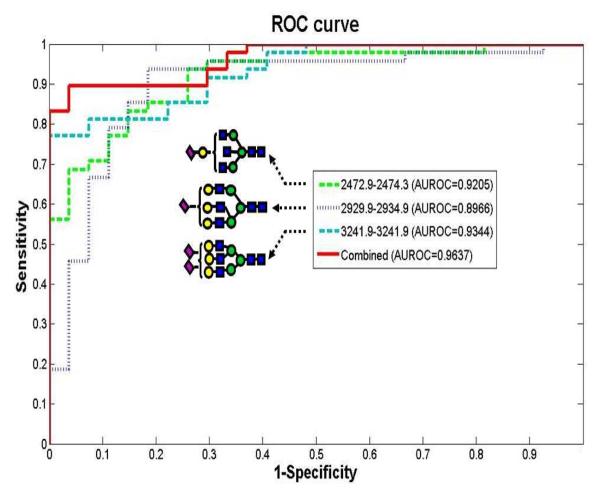
MALDI-MS profiling of permethylated N-glycans was also successful in distinguishing 73 hepatocellular carcinoma (HCC) patients, 77 age- and gender-matched cancer-free controls, and 52 chronic liver disease patients [39]. This study demonstrated for the first time an enhanced sensitivity and specificity when combining the distribution of several glycans. The trends of disialylated triantennary, monosialylated triantennary with terminal galactose, and trisialylated tetraantennary when considered togather was sufficient to classify HCC with 90% sensitivity and 89% specificity in an independent validation set of patients with chronic liver disease (Figure 2). Adjustment for chronic viral infection and other known covarites did not influence the association of the three N-glycans with HCC.
Figure 2.
Area under the receiver operating characteristics (ROC) curve (AuROC) for three glycans comparing a blinded validation set of hepatocellular carcinoma (HCC) cases (n = 47) and CLD controls (n = 27). Symbols: as in Figure 1. Reproduced with permission from [39].
Lung Cancer
The LC with fluorescence approach, described above for breast cancer, was recently employed to analyze he N-glycans of serum samples donated by 100 lung cancer patients (20 from each stage I, II, IIIA, IIIB, and IV) and 84 age- and sex-matching disease-free donors [40]. The levels of SLex, mono-antennary, and trisialylated glycans are significantly high in lung cancer. Also, the alteration in glycosylation of haptoglobin isolated from blood serum resembled that of the whole blood serum sample N-glycans. A significant increase in the levels of SLex structures in squamous cell carcinoma (N=22) relative to adenocarcinoma (N=40) was also reported in this study. A correlation between glycan alterations and smoking among the samples analyzed was also determined. The levels of SLex structures were higher in smokers and former smokers relative to nonsmokers, while the levels of triantennary glycan were higher in smokers relative to nonsmokers. Moreover, glycomic profiling was also dependent on age and gender. Considering a combination of glycans that exhibited a significant increase in cancer samples improved the sensitivity and specificity of disease detection [40]. It appears that SLex epitope containing structures are exhibiting the same trend in both breast and lung cancer (Table 1). The same trend was also observed for ovarian cancer as described next[41].
Table 1.
List of N-glycan structures derived from blood serum samples which have demonstrated a change in expression as a consequence of cancer development or progression.
| N-Glycans | Breast Cancer | Colorectal Cancer | Esophageal Adenocarci nomao | Liver Cancer | Lung Cancer | Ovarian Cancer | Pancreatic Cancer | Prostate Cancer |
|---|---|---|---|---|---|---|---|---|
|
|
↑ | Observed only in differentiated cells | ↑ ↑ in HBS | ↑ | ||||

|
↑ | ↑ | ||||||

|
↑ | ↑ | ||||||

|
↑ | Observed only in differentiated cells | ↑ | |||||

|
↓ | ↑ | ↑ | |||||
|
|
↓ | ↑ | ||||||
|
|
↑ | ↑ | ||||||

|
↑ | in Isolated αl-acid glycoprotcin | ||||||
|
|
↑ | ↑ | ||||||
| 4HexNAc6Hex1deoxyHex1NeuAc | ↑ | |||||||

|
↑ | |||||||

|
↑ | |||||||

|
↑ | |||||||

|
↑ | |||||||
|
|
Observed only in differentiated cells | |||||||

|
Observed only in differentiated cells | |||||||

|
↑ | |||||||
|
|
↑ | |||||||
|
|
↑4 drift times | |||||||
|
|
↑ | |||||||
|
|
↓ | |||||||
|
|
↑ | |||||||

|
↑ | |||||||

|
↑ | in isolated αl-acid glycoprotein | ||||||

|
↑ | |||||||

|
↑2 drift times | |||||||
|
|
↑ ↑ in HBS | |||||||

|
in isolated αl-acid glycoprotein | |||||||

|
in isolated αl-acid glycoprotein | |||||||

|
↑ | in isolated αl-acid glycoprotein | ||||||

|
in isolated αl-acid glycoprotein | |||||||

|
in isolated αl-acid glycoprotein | |||||||

|
↑ | |||||||
|
↑ | |||||||

|
↑ | |||||||

|
↑ | |||||||

|
↓ | |||||||

|
↑ | |||||||
|
|
↑ | |||||||

|
↑ |
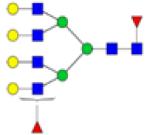
Symbols: blue square, N-acetylglucosamine; green circle, mannose; yellow circle, galactose; purple diamond, sialic acid; red triangle, fucose. ↑ depicts an increase in abundance levels in cancer samples while ↓ depicts a decrease in the abudnace levels in cancer samples.
Ovarian Cancer
The LC with fluorescence detection described above for breast and lung cancer was also employed to assessed glycomic alterations associated with ovarian cancer. The ovarian samples included benign gynecological conditions or other gynecological cancers [41]. The levels of core fucosylated, agalactosyl biantennary glycans (FA2), and SLex were determined to be significantly high among ovarian cancer patients. The levels of SLex structures were in acute-phase glycoproteins such as haptoglobin and α1-antichymotrypsin while the immunoglobulin G (IgG) contained FA2 glycans with increased core fucosylation. The same results were also observed in an independent study employing MALDI-MS profiling of permethylated glycans [42].
The levels of glycosylation of glycoproteins of ovarian cancer blood serum and ovarian cancer cell lines were assessed by MALDI-FTICR-MS in conjunction with gel-electrophoresis [43]. Two forms of apolipoprotein B-100, fibronectin, and immunoglobulin A1 from serum samples were bands in gel electrophoresis at approximately 517, 370, 250, 163 kDa, respectively. Apolipoprotein B-100 (517 kD) glycans consisted of small, specific O-glycans. O- and N-glycans were determined in the case of fibronectin (250 kD) and immunoglobulin A1 (163 kD). These glycans were determined to be significantly different from the normal serum sample counterparts. This study suggested that cancer development prompt simultaneous misglycosylation of many blood sera proteins.
The glycomic profiles of other purified glycoproteins were also employed to assess differences between ovarian cancer samples and their matching control [44]. MALDI-MS analyses in the positive and negative modes were employed to profile N-glycans of α1-acid glycoprotein purified by immunoprecipitation [44]. The levels of fucosylation and branching of glycans associated with α1-acid glycoprotein isolated from the blood serum collected from 12 disease free individuals and 16 ovarian cancer patients were assessed. Although the observed aberration in glycan was not statistically significant, they were pronounced enough to be distinguished by linear discriminant analysis. Nevertheless, the results agreed with the study of Saldova et al [41], which again indicate that the determined aberrant glycosylation are endogenous and are ondeependent of the analytical methods.
Profiling of N-glycans derived from SKOV3 ovarian carcinoma cells and from a recombinantly expressed secretory glycoprotein, erythropoietin (EPO), was attained by both MALDI-MS and high-performance anion exchange chromatography with pulsed amperometric detection [45]. The study aimed at depicting the differences/similarities in the glycosylation of membrane-bound glycoprotein and secreted glycoproteins derived from the SKOV3 ovarian carcinoma cells. The total cellular N-glycans of these cells consisted predominantly of high-mannose and partially agalactosylated fucosylated complex structures while those of the recombinant human EPO expressed in SKOV3 cells were predominantly core-fucosylated tetraantennary structures partially lacking one or two galactose residues. Additionally, the LacdiNAc (GalNAcbeta1-4GlcNAc) motif were observed in the human EPO expressed in SKOV3 cells [45]. This motif was also observed in the endogenous glycoproteins. However, the results were not supported by any statistical evaluations.
Pancreatic Cancer
The glycomics and glycoproteomics efforts of Lubman and coworkers have been primarily focused on defining the glycans and glycoproteins biomarkers of pancreatic cancer [46–48]. They initially employed chromatographic separation to isolate intact glycoproteins enriched by lectin media specific for sialic acid glycoproteins [46]. The N-glycans associated with the lectin-enriched glycoproteins were then characterized employing MALDI-QIT-MS. On the other hand, glycopeptidomic analysis of the same samples was achieved by μLC-ESI-TOF-MS. These analyses permitted the elucidation of both carbohydrate structures and the microheterogeneity of glycosylation sites. Applying this approach to serum of disease free individuals and pancreatic cancer patients suggested that sialylated plasma protease C1 inhibitor and IgG were down regulated in pancreatic cancer, while the N83 glycosylation site of α1-was also down regulated. Additionally, the major glycan structures of these three glycoproteins were determined to be biantennary glycans, fucosylated biantennary glycans and triantennary glycans by MALDI-QIT-MS. However, the number of samples employed in this study was small (N =1), and no validation of results was performed.
In another study, the immunprecipitation of haptoglobin from a 10-μl aliquot of serum was conducted prior to enzymatic cleavage and desialylation of the glycans associated with this glycoprotein. Subsequently, the released glycans were permethylated and analyzed by MALDI-QIT-TOF-MS [48]. This approach was employed to compare the glycomic profiles of haptoglobin isolated from both disease-free and pancreatic cancer sera. This analysis allowed for the first time detection of difucosylated triantennary glycan structure derived from haptoglobin isolated from pancreatic cancer serum samples. Glycomic profiling of haptoglobin isolated from the serum of 5 disease-free individuals, 5 chronic pancreatitis patients, and 16 pancreatic cancer patients (1 stage IA, 3 stage IIA, 4 stage IIB, 4 stage III, and 4 stage IV) indicated that both core and antennary fucosylation were elevated in pancreatic cancer relative to benign conditions. The number of samples analyzed using this approach did not present a population; therefore, the results are yet to be validated with a larger set of samples.
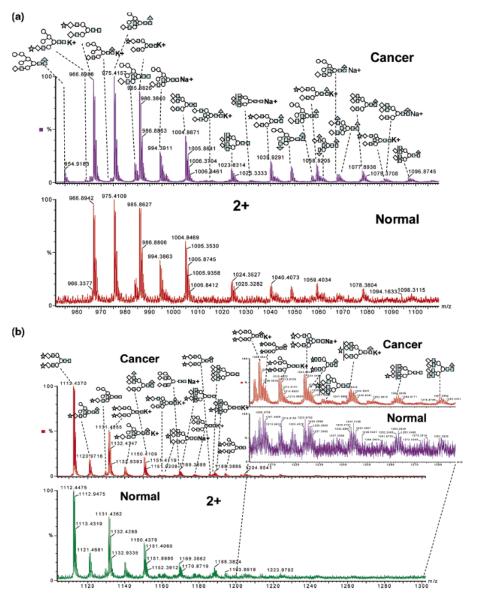
Lectin was also employed, by the same group, to isolate glycopeptides originating from blood serum tryptic digest [47]. The glycan associated with enriched glycopeptides were then characterized by nanoRP-LC-ESI-MS/MS or by capillary hydrophilic interaction liquid chromatography interfaced to ESI-TOF-MS after enzymatic cleavage (Figure 3). Ninety-two individual glycosylation sites and 202 glycan peaks with 105 unique carbohydrate structures of which 44 structures were characteristic of pancreatic cancer serum were assigned. Increase branching of N-linked oligosaccharides and increased fucosylation and sialylation was shown to be the overall change in the glycosylation of pancreatic cancer serum proteins was [47]. Although the results were very interesting, only one disease free and one pancreatic cancer serum samples were analyzed. The reported results need to be validated using a large set of samples.
Figure 3.
N-linked carbohydrates were separated by microhydrophilic interaction LC and online detected by ESI-TOF MS. The combined mass spectra of retention time 27–28 min and retention time 28–29 min are shown in (a) and (b). All of the peaks presented here are doubly charged. The spectrum for cancer sample is shown above the normal sample. The zoomed spectrum depicts the differences between cancer and control. Symbols: black triangle, fucose; black star, N-acetyl neuraminic acid (sialic acid); black square, HexNAc; white circle, mannose; white diamond, galactose. Reproduced with permission from [47].
Prostate Cancer
MALDI-MS profiling of permethylated N-glycans, derived from 10-μl aliquots of blood sera donated by 10 disease-free individuals and 24 prostate cancer patients, suggested that fucosylation of glycan structures is generally higher in cancer samples (ANOVA test p-value of 0.0006) [49]. This MALDI-MS profiling allowed the detection of 50 N-glycan structures of which 12 were significantly different between the two sample sets (Table 1). Six of these glycan structures were fucosylated. Ten of the 12 glycan structures were significantly higher in prostate cancer samples relative to control samples, while the other two were less abundant. These results were independently confirmed by Lebrilla and coworkers using MALDI-FT-ICR-MS [50].
Isomeric N-Glycans as Putative Cancer Biomarkers
The fact that the glycosylation of glycoconjugates is a template-free process involving many transferases and exoglycosidases, accounts for the production of multiple glycan isomers sharing the same monosaccharide composition but different linkages and sequences. However, none of the above mentioned studies paid any attention to the role of glycan isomers. Thus far, this is an area of research that has attracted very limited interest. However, isomeric separation of glycans has been recently demonstrated using either ion mobility mass spectrometry (IMS-MS) or porous graphitized carbon chromatography interfaced to MS.
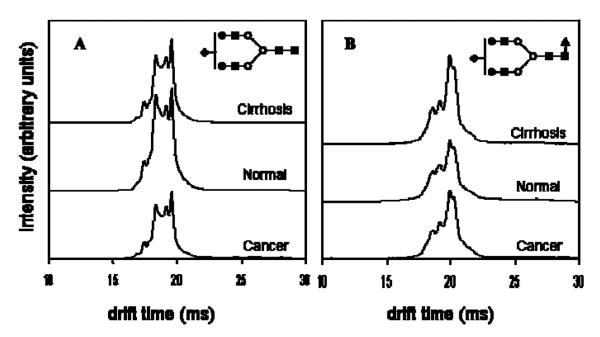
A subset of the liver samples analyzed by MALDI-MS as described above (22 disease-free control individuals, 20 with liver cirrhosis and 19 with liver cancer) [39] were analyzed by IMS-MS to delineate differences among the cohorts originating from glycan conformations or isomers [51, 52]. It appears that ion mobility distributions for individual m/z value permits distinguishing patients with HCC or cirrhosis (Figure 4). Accordingly, IMS-MS permits the separation of different isomeric structures, existing at different abundances among the different cohorts. IMS-MS enables the discrimination between the liver diseases using the drift times of glycan isomers, which are not resolved through MS analysis alone. Although IMS-MS appears to be promising since it permits separation of isomers, the low resolution of this technique (commercial and in-house build instruments) currently does not allow the separation of closely related isomeric structures (Figure 4).
Figure 4.
Average drift time profiles of (A) [S1H5N4+3Na]3+ and (B) [S1F1H5N4+3Na]3+ glycans showing both conformational and intensity differences with respect to disease state. Note that in the case of S1H5N4, the disease states exhibit lower overall intensities than the healthy state, while S1F1H5N4 shows higher overall drift time intensities in the case of diseased states than in the healthy state. This might be due to increased fucosylation of glycans with cancer and cirrhosis. Additionally, for both ions, careful inspection of drift time profiles show variances in intensities of finer features between the three groups. Symbols: as in Figure 3. Reproduced with permission from [51].
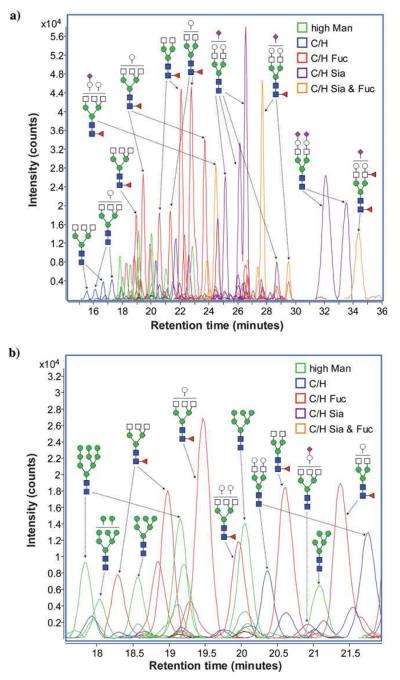
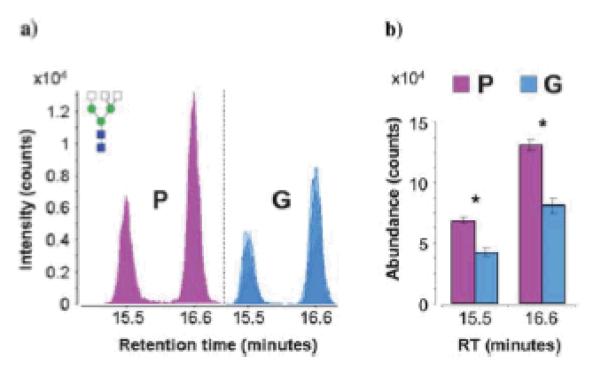
Isomeric separation of N-glycans derived from serum sample of two groups of prostate cancer patients was recently attained using porous graphitized carbon (PGC) material packed in a microfluidic chip part of a nano-LC-MS setup [53]. More than 300 N-glycan structures (including isomeric structures) were identified [53]. Although the authors indicated that up to six different isomers for each N-glycan composition were resolved (Figure 5), no tandem MS supported this finding. This method permitted the distinctions between different clinical samples donated by patients with poor prognoses based on elevated PSA levels post-radical retropubic prostatectomy (group P, N=4), and patients with good prognoses based on undetectable PSA levels post- radical retropubic prostatectomy (group G, N=4) (Figure 6). The separation on PGC media allowed the separation of many isomers which distinguished the different prostate cancer cohorts. These differences were not observed when the relative abundance of individual isomers was not considered. Accordingly, isomeric separation is providing additional information, aiding in understanding the biological attributes of glycan isomerism.
Figure 5.
(a) Extracted compound chromatograms (ECCs) of glycans found in a representative serum sample. (b) Magnified view of a short segment of the glycan elution profile, showing the high sensitivity and resolution achieved by nano-LC separation. Colors denote different glycan classes. Symbols: red triangle, fucose; blue square and white square, HexNAc; green circle, mannose; white circle, galactose. magenta diamond, sialic acid. Reproduced with permission from [53].
Figure 6.
(a) Overlaid chromatograms of the isomers of complex triantennary glycan composition Hex3-HexNAc5. Overlaps are represented by varying degrees of translucency. (b) Bar graph representation of average abundances and standard error for the isomers of Hex3-HexNAc5. Asterisks denote statistically significant differences between patient groups. Group P represents patients with poor prognoses based on elevated PSA levels post-radical retropubic prostatectomy (N=4), while Group G represents patients with good prognoses based on undetectable PSA levels post-radical retropubic prostatectomy (N=4). Symbos: as in Figure 5. Reproduced with permission from [53].
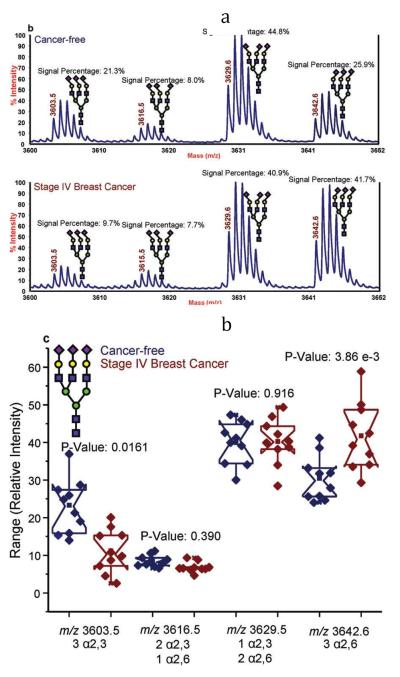
Distinguishing between isomeric glycans with α2,3- or α2-6-linked sialic acids can be achieved through amidation prior to permethylation [54]. Only glycans with α2,6-linked sialic acids are amenable to amidation reaction [55]. Accordingly, an amidated and permethylated glycan possessing α2,6-linked sialic acid residue will have a MALDI-MS peak at an m/z value different by 13 m/z unit per sialic acid residue from that with α2,3-linked sialic acid residues (Figure 7). The permethylated trisialylated triantennary structure is observed at m/z 3603.5 in MALDI mass spectrum. The amidation and permethylation of the same structure resulted in the detection of four structural isomers (Figure 7a); a structure possessing three α2-3 linked sialic acids (m/z 3603.5), a structure possessing three α2-6 linked sialic acids (m/z 3642.6), a structure possessing one α2-3 and two α2-6 linked sialic acids (m/z 3616.5), and a structure possessing two α2-3 and one α2-6 linked sialic acids (m/z 3629.6). The increase in the relative abundance of the trisialylated triantennary glycan with three α2-6 linked sialic acids among cancer samples is statistically significant (Figure 7b). This increase in the relative abundance is supported by the increase in the expression levels of ST6Gal-1 transferase observed in several tumor tissue or cell lines [56–59]. Although the results were very interesting and demonstrated a distinct difference in the abundance of glycans with the same composition but different linkages, the number of samples analyzed (10 cancer-free and 10 late stage breast cancer) was very small. Analyzing of a larger set of samples is needed to confirm the reported findings.
Figure 7.
(a) Representative MALDI-TOF-MS spectra of a cancer-free patient (top) and a breast cancer patient (bottom); and (b) notched-box plots for the different isomers associated with the triantennary-trisialylated glycan structures derived from the blood sera of the 10 cancer-free patients and 10 breast cancer patients. Symbols: as in Figure 1. In this figure, sialic acid directed toward the left are linked α2,3 while those directed toward the right are linked α2,6. Reproduced with permission from [54].
O-Glycans as Putative Cancer Biomarkers
The lack of enzymes permitting the efficient release of all O-glycans has rendered O-glycan analysis difficult, insensitive and time consuming. O-glycans are chemically released from glycoconjugates and the process usually entails multiple reaction and cleaning steps, thus substantially hindering the sensitive analysis of these glycans. Therefore, O-glycan profiling in cancer has been limited.
Breast Cancer
Profiling of O-glycans chemically derived from four cultured breast cancer tumor cells (BT 474, MDA-MB-468, MDA-MB-361, and MDAMB-453) and normal epithelial breast cells (MCF10A) has been shown employing MALDI-FTICR MS [60]. The profiles of all MDA-MB cell lines were highly comparable and different than those of the precancerous BT 474 or normal epithelial breast MCF10A cell lines. Differences might have been due to the fact that the BT 474 is a precancerous ductal carcinoma cell line. Sialylation or fucosylation was not associated with any of the observed O-glycans. The results were supported independently by another laboratory [32]. However, the second study reported an increase in the expression of fucosylated O-glycans which appeared to substantially higher in the case of breast cancer cells.
The O-glycans of serum collected from PyMT mouse model of metastatic breast cancer during the growth of tumors were profiled by MALDI-MS analysis [60]. O-glycomic profiling was performed over three time points during the development of memory tumor (weeks 0, 2, and 6) for 4 mice. Several glycan structures were only detected in samples collected at weeks 2 and 6 with an increase in the abundance of glycans in the case of the latter, relative to the former. O-glycomic profiling was also performed for blood serum collected from four patients previously tested for CA27-29 and four disease-free subjects. The glycomic profiles of breast cancer patients was comparable to those of the breast cancer cell lines and model mouse [60]. This resemblance is extremely surprising despite the fact that the transferases and exoglycosidases of the two species are not the same. Conclusions drawn in this study were not very definitive, considering the small number of samples analyzed in this study.
Ovarian Cancer
O-Glycans were also profiled employing MALDI-FTICR-MS for both glycoproteins shed by ovarian cancer cells (Caov-3, OVCAR-3, ES-2 and SKOV3) and those found in the conditioned media of the cultured cells. These profiles were also compared to human serum samples collected from both disease-free individuals (N=5) and ovarian cancer patients (N=5) [61]. Although many of the oligosaccharides were common to the four cell lines, there were some distinct glycans found in each cell line. Moreover, more oligosaccharides were observed in cell lines OVCAR-3 and ES-2 relative to those of Caov-3 and SK-OV-3. O-Glycomic profiling of serum samples from both disease free and ovarian cancer patients indicated the presence of several oligosaccharides common to both the serum samples and the conditioned media. These O-glycans were similar to the ones observed in breast cancer study with comparable trends [60]. Therefore, their use to discriminate between different cancer types is not possible. They are not useful cancer biomarkers. Some of the observed structures were composed of several series of hexuronic acid which have not been previously described in the literature. They are believed to be detected because of the use of chemical cleavage [60].
Future and Perspective of Glycomics in Cancer Biomarker Studies
The correlation of changes in glycan (qualitative and quantitative) to cancer development and progression has been recently facilitated by the development of new methods focused on the use of both mass spectrometry and separation science. Such methods have been employed in many studies by different groups to illustrate the direct correlation between glycan aberration and different cancer types. Nevertheless, clinical translation of such findings has not been yet demonstrated. Additionally, it is yet to be shown that the changes observed in all of the abovementioned studies are cancer-type specific. There is also a need to demonstrate the biological role (or the lack of for that matter) of the glycan isomers in the development and progression of cancer. Thus far, the endogenous distributions of glycan isomers appear to be directly related to some cancers, such as breast and liver [52–54]. Mass spectrometry or separation based methods enabling the distinction between different isomers might provide an insight to better understand differences between cancer types and/or subtypes.
Executive Summary
Increase in fucosylation, sialylation, and branching is directly correlated to cancer development and progression (Table 1).
• Fucosylated biantennary glycans with one and two terminal galactose were unique for esophageal adenocarcinoma (Table 1).
Some glycans exhibited opposite trends in different cancers. For example, hybrid glycans decreased in expression in breast cancer but increased in liver cancer.
All the reported studies involved comparing the glycomic profiles of one type of cancer at different stages to disease-free control.
The utility of glycomic profiles in distinguishing different cancer types has not been yet demonstrated.
Nevertheless, glycomic profiles have permitted the distinction between, for example, esophageal cancer and other esophagus diseases. Glycomic profiles also distinguished liver cancer from liver cirrhosis. Accordingly, the glycan changes observed in these studies are illustrating changes related to cancer development and progression and not immune response.
Although statistical evaluation of many of the data summarized in Table 1 has been demonstrated, no clinical validation of any of data has been shown. The majority of the studies involved a small number of samples (N=1•10).
It appears that the glycomic changes observed in human blood serum are also reflected in the glycans of some glycoproteins isolated from human blood serum. However, it does not appear that additional information could justify the time and effort associated with the isolation of such glycoproteins.
It is still not clear if the observed glycomic changes are a cause or an effect.
The lack of an enzyme permitting efficient release of O-glycans has limited the Oglycomic studies.
The same O-glycan changes (summarized in Table 2) were observed in both breast cancer [31] and ovarian cancer [59,61]. Accordingly, these changes appear to be more related to immune response than cancer.
Table 2.
List of O-glycan structures which have demonstrated a change in expression as a consequence of cancer development or progression.
| O-Glycan Structures | Breast Cancer | Ovarian Cancer | ||||||
|---|---|---|---|---|---|---|---|---|
| MDA-MB-361* | MDA-MB-468* | MDA-MB-453* | MDA-MB-435# | 578T# | Human Blood Serum* | Apo B-100¥ | Human Blood Serum§ | |
| 2Hex | - | - | - | - | - | - | ↑ | ↑ |
| 3Hex | ↑ | ↑ | ↑ | - | - | - | - | ↑ |
| 5Hex | - | - | - | - | - | - | ↑ | - |
| 6Hex | - | - | - | - | - | - | ↑ | - |
| 7Hex | - | - | - | - | - | - | ↑ | - |
| 1HexNAc1Hex | ↑ | ↑ | ↑ | - | - | - | ↑ | ↑ |
| 1HexNAc2Hex | ↑ | ↑ | ↑ | - | - | - | - | ↑ |
| lHexNAc3Hex | ↑ | ↑ | ↑ | ↑ | ↓ | ↑ | - | ↑ |
| 1HexNAc4Hex | ↑ | ↑ | ↑ | ↑ | ↑ | - | - | ↑ |
| 1HexNAc1HexNeuGc | - | - | - | - | - | - | ↑ | - |
| 2HexNAc | - | - | - | - | - | - | ↑ | - |
| 2HexNAc1Hex | - | - | - | - | - | - | ↑ | - |
| 2HexNAc2Hex | - | - | - | - | - | - | ↑ | - |
| 2HexNAc3Hex | ↑ | ↑ | ↑ | ↑ | ↑ | ↑ | ↑ | ↑ |
| 2HexNAc4Hex | ↑ | ↑ | ↑ | - | - | ↑ | - | ↑ |
| 2HexNAc5Hex | - | - | - | ↑ | ↑ ↑ | - | - | ↑ |
| 2HexNAc6Hex | - | - | - | ↑ | ↑ ↑ | - | - | - |
| 3HexNAc1Hex | - | - | - | - | - | - | ↑ | - |
| 3HexNAc4Hex | - | - | - | - | - | - | - | ↑ |
| 3HexNAc5Hex | ↑ | ↑ | ↑ | - | - | ↑ | - | ↑ |
| 1HexNAc1Hex*2Hex | ↑ | ↑ | ↑ | - | - | ↑ | - | ↑ |
| 1HexNAc2Hex*3Hex | - | - | - | - | - | - | - | ↑ |
| 2HexNAc1Hex*2Hex | - | - | - | - | - | - | - | ↑ |
| 2HexNAc2Hex*3Hex | - | - | - | - | - | ↑ | - | ↑ |
| 3HexNAc1Hex*4Hex | ↑ | ↑ | ↑ | - | - | - | - | ↑ |
| 2HexNAc2Hex1Fuc | - | - | - | ↑ ↑ | ↑ | - | - | - |
| 2HexNAc3Hex1Fuc | - | - | - | ↑ ↑ | ↑ ↑ | - | - | - |
| 3HexNAc3Hex1Fuc | - | - | - | ↑ ↑ | ↑ ↑ | - | - | - |
| 4HexNAc3Hex1Fuc | - | - | - | ↑ ↑ | ↑ ↑ | - | - | - |
Acknowledgments
This work was supported by the office of the vice president for research at Texas Tech University and partially by an NIH grant (1R01 GM093322-02).
Abbreviations
- (APTS)
1-aminopyrene-3,6,8-trisulfonate
- (CID)
collision induced dissociation
- (ESI)
electrospray ionization
- (FT-ICR-MS)
Fourier transform ion cyclotron resonance mass spectrometry
- (HPLC)
high-performance liquid chromatography
- (HPAEC)
high-pH anion exchange chromatography
- (HILIC)
hydrophilic interaction chromatography
- (MS)
mass spectrometry
- (MALDI)
matrixassisted laser desorption ionization
- (QIT-MS)
quadrupole ion trap mass spectrometry
- (TOF-MS)
time-of-flight mass spectrometry
REFERENCES
- 1.Helenius A, Aebi M. Intracellular functions of N-linked glycans. Science. 2001;291(5512):2364–2369. doi: 10.1126/science.291.5512.2364. [DOI] [PubMed] [Google Scholar]
- 2.Rudd PM, Woods RJ, Wormald MR, et al. The effects of variable glycosylation on the functional activities of ribonuclease, plasminogen and tissue plasminogen activator. Biochem. Biophys. Acta. 1995;1248(1):1–10. doi: 10.1016/0167-4838(94)00230-e. [DOI] [PubMed] [Google Scholar]
- 3.Rudd PM, Wormald MR, Stanfield RL, et al. Roles for glycosylation of cell surface receptors involved in cellular immune recognition. J. Mol. Biol. 1999;293(2):351–366. doi: 10.1006/jmbi.1999.3104. [DOI] [PubMed] [Google Scholar]
- 4.Varki A. Biological roles of oligosaccharides: all of the theories are correct. Glycobiology. 1993;3(2):97–130. doi: 10.1093/glycob/3.2.97. [DOI] [PMC free article] [PubMed] [Google Scholar]
- 5.Dwek RA. Glycobiology: Toward understanding the function of sugars. Chem. Rev. 1996;96(2):683–720. doi: 10.1021/cr940283b. [DOI] [PubMed] [Google Scholar]
- 6.Dennis JW, Granovsky M, Warren CE. Protein glycosylation in development and disease. Bioassays. 1999;21(5):412–421. doi: 10.1002/(SICI)1521-1878(199905)21:5<412::AID-BIES8>3.0.CO;2-5. [DOI] [PubMed] [Google Scholar]
- 7.Lowe JB, Marth JD. A genetic approach to Mammalian glycan function. Annu. Rev. Biochem. 2003;72:643–691. doi: 10.1146/annurev.biochem.72.121801.161809. [DOI] [PubMed] [Google Scholar]
- 8.Colley KJ, Baenziger JU. Identification of the post-translational modifications of the core-specific lectin. J. Biol. Chem. 1987;262(21):10290–10295. [PubMed] [Google Scholar]
- 9.Shinkai H, Yonemasu K. Hydroxylysine-linked glycosides of human complement subcomponent C1q and various collagens. Biochem. J. 1979;177(3):847–852. doi: 10.1042/bj1770847. [DOI] [PMC free article] [PubMed] [Google Scholar]
- 10.Bertozzi CR, Kiessling LL. Chemical Glycobiology. Science. 2001;291(5512):2357–2364. doi: 10.1126/science.1059820. [DOI] [PubMed] [Google Scholar]
- 11.Hakomori S. Tumor malignancy defined by aberrant glycosylation and sphingo(glyco)-lipid metabolism. Cancer Res. 1996;56(23):5309–5318. [PubMed] [Google Scholar]
- 12.Kobata A. A retrospective and prospective view of glycopathology. Glycoconj. J. 1998;15(4):323–331. doi: 10.1023/a:1006961532182. [DOI] [PubMed] [Google Scholar]
- 13.Gohlke M, Blanchard V. Separation of N-glycans by HPLC. Methods. Mol. Biol. 2008;446:239–254. doi: 10.1007/978-1-60327-084-7_17. [DOI] [PubMed] [Google Scholar]
- 14.Rudd PM, Colominas C, Royle L, et al. A high-performance liquid chromatography based strategy for rapid, sensitive sequencing of N-linked oligosaccharide modifications to proteins in sodium dodecyl sulphate polyacrylamide electrophoresis gel bands. Proteomics. 2001;1(2):285–294. doi: 10.1002/1615-9861(200102)1:2<285::AID-PROT285>3.0.CO;2-G. [DOI] [PubMed] [Google Scholar]
- 15.Wada Y, Azadi P, Costello CE, et al. Comparison of the methods for profiling glycoprotein gly-cans—HUPO Human Disease Glycomics/Proteome Initiative multi-institutional study. Glycobiology. 2007;17(4):411–422. doi: 10.1093/glycob/cwl086. [DOI] [PubMed] [Google Scholar]
- 16.Mechref Y, Novotny M. Structural investigations of glycoconjugates at high sensitivity. Chem. Rev. 2002;102(2):321–369. doi: 10.1021/cr0103017. [DOI] [PubMed] [Google Scholar]
- 17.Mechref Y, Novotny MV. Miniaturized Separation Techniques in Glycomic Investigations. J. Chromatogr. B Analyt Technol Biomed Life Sci. 2006;841(1–2):65–78. doi: 10.1016/j.jchromb.2006.04.049. [DOI] [PubMed] [Google Scholar]
- 18.Mechref Y. Analysis of glycans derived from glycoconjugates by capillary electrophoresis-mass spectrometry. Electrophoresis. 2011;32(24):3467–3481. doi: 10.1002/elps.201100342. [DOI] [PMC free article] [PubMed] [Google Scholar]
- 19.Ciucanu I, Costello CE. Elimination of oxidative degradation during the perOmethylation of carbohydrates. J. Am. Chem. Soc. 2003;125(52):16213–16219. doi: 10.1021/ja035660t. [DOI] [PubMed] [Google Scholar]
- 20.Ciucanu I, Kerek F. A simple and rapid method for the permethylation of carbohydrates. Carbohydrate Res. 1984;131(2):209–217. [Google Scholar]
- 21.Kang P, Mechref Y, Klouckova I, Novotny MV. Solid-phase permethylation of glycans for mass spectrometric analysis. Rapid Commun. Mass Spectrom. 2005;19(23):3421–3428. doi: 10.1002/rcm.2210. [DOI] [PMC free article] [PubMed] [Google Scholar]
- 22.Kang P, Mechref Y, Novotny MV. Solid-phase permethylation of glycans for mass spectrometric analysis. Rapid Commun. Mass Spectrom. 2008;22(5):721–734. doi: 10.1002/rcm.3395. [DOI] [PubMed] [Google Scholar]
- 23.Mechref Y, Kang P, Novotny MV. Solid-phase permethylation for glycomic analysis. Methods Mol. Biol. 2009;534:53–64. doi: 10.1007/978-1-59745-022-5_4. [DOI] [PubMed] [Google Scholar]
- 24.Zaia J. Mass Spectrometry and the Emerging Field of Glycomics. Chem Biol. 2008;15(9):881–892. doi: 10.1016/j.chembiol.2008.07.016. [DOI] [PMC free article] [PubMed] [Google Scholar]
- 25.An HJ, Kronewitter SR, De Leoz MLA, Lebrilla CB. Glycomics and Disease Markers. Curr Opin Chem Biol. 2009;13(5–6):601–607. doi: 10.1016/j.cbpa.2009.08.015. [DOI] [PMC free article] [PubMed] [Google Scholar]
- 26.Tousi F, Hancock WS, Hincapie M. Technologies and strategies for glycoproteomics and glycomics and their application to clinical biomarker research. Anal. Methods. 2011;3:20–32. doi: 10.1039/c0ay00413h. [DOI] [PubMed] [Google Scholar]
- 27.Jankovic M. Glycans as biomarkers: status and perspectives. J. Med. Biochem. 2011;30(3):213–223. [Google Scholar]
- 28.Adamczyk B, Tharmalingam T, Rudd PM. Glycans as cancer biomarkers. Biochim. Biophys. Acta. 2012;1820(9):1347–1353. doi: 10.1016/j.bbagen.2011.12.001. [DOI] [PubMed] [Google Scholar]
- 29.Arnold JN, Saldova R, Hamid UMA, Rudd PM. Evaluation of the serum N-linked glycome for the diagnosis of cancer and chronic inflammation. Proteomics. 2008;8(16):3284–3293. doi: 10.1002/pmic.200800163. [DOI] [PubMed] [Google Scholar]
- 30.Hua S, Lebrilla C, An HJ. Application of nano-LC-based glycomics towards biomarker discovery. Bioanalysis. 2011;3(22):2573–2585. doi: 10.4155/bio.11.263. [DOI] [PubMed] [Google Scholar]
- 31.Kyselova Z, Mechref Y, Kang P, et al. Breast cancer diagnosis/prognosis through quantitative measurements of serum glycan profiles. Clin. Chem. 2008;54(7):1166–1175. doi: 10.1373/clinchem.2007.087148. [DOI] [PubMed] [Google Scholar]
- 32.Goetz JA, Mechref Y, Kang P, Jeng M-H, Novotny MV. Glycomic profiling of invasive and non-invasive breast cancer cells. Glycoconj J. 2009;26(2):117–131. doi: 10.1007/s10719-008-9170-4. [DOI] [PubMed] [Google Scholar]
- 33.Abd Hamid UM, Royle L, Saldova R, et al. A strategy to reveal potential glycan markers from serum glycoproteins associated with breast cancer progression. Glycobiology. 2008;18(12):105–1118. doi: 10.1093/glycob/cwn095. [DOI] [PubMed] [Google Scholar]
- 34.Pierce A, Saldova R, Abd Hamid UM, et al. Levels of specific glycans significantly distinguish lymph node-positive from lymph node-negative breast cancer patients. Glycobiology. 2010;20(10):1283–1288. doi: 10.1093/glycob/cwq090. [DOI] [PubMed] [Google Scholar]
- 35.Saldova R, Reuben JM, Abd Hamid UM, Rudd PM, Cristofanilli M. Levels of specific serum N-glycans identify breast cancer patients with higher circulating tumor cell counts. Annals Oncol. 2011;22(5):1113–1119. doi: 10.1093/annonc/mdq570. [DOI] [PubMed] [Google Scholar]
- 36.Alley WR, Madera M, Mechref Y, Novotny MV. Chip-based Reversed-phase Liquid Chromatography-Mass Spectrometry of Permethylated N-Linked Glycans: A Potential Methodology for Cancer-biomarker Discovery. Anal. Chem. 2010;82(12):5095–5106. doi: 10.1021/ac100131e. [DOI] [PMC free article] [PubMed] [Google Scholar]
- 37.Vercoutter-Edouart A-S, Slomianny M-C, Dekeyzer-Beseme O, Haeuw J-F, Michalski J-C. Glycoproteomics and glycomics investigation of membrane N-glycosylproteins from human colon carcinoma cells. Proteomics. 2008;8(16):3236–3256. doi: 10.1002/pmic.200800151. [DOI] [PubMed] [Google Scholar]
- 38.Mechref Y, Hussein A, Bekesova S, et al. Quantitative Serum Glycomics of Esophageal Adenocarcinoma and Other Esophageal Disease Onsets. Journal of Proteome Research. 2009;8(6):2656–2666. doi: 10.1021/pr8008385. [DOI] [PMC free article] [PubMed] [Google Scholar]
- 39.Goldman R, Ressom HW, Varghese RS, et al. Detection of Hepatocellular Carcinoma Using Glycomic Analysis. Clin. Cancer Res. 2009;15(5):1808–1813. doi: 10.1158/1078-0432.CCR-07-5261. [DOI] [PMC free article] [PubMed] [Google Scholar]
- 40.Arnold JN, Saldova R, Galligan MC, et al. Novel Glycan Biomarkers for the Detection of Lung Cancer. J. Proteome Res. 2011;10(4):1755–1764. doi: 10.1021/pr101034t. [DOI] [PubMed] [Google Scholar]
- 41.Saldova R, Royle L, Radcliffe CM, et al. Ovarian cancer is associated with changes in glycosylation in both acute-phase proteins and IgG. Glycobiology. 2007;17(12):1344–1356. doi: 10.1093/glycob/cwm100. [DOI] [PubMed] [Google Scholar]
- 42.Alley WR, Vasseur JA, Goetz JA, et al. N-linked glycan structures and their expressions change in the blood sera of ovarian cancer patients. J. Proeome Res. 2012;11(4):2282–2300. doi: 10.1021/pr201070k. [DOI] [PMC free article] [PubMed] [Google Scholar]
- 43.Li B, An HJ, Kirmiz C, Lebrilla CB, Lam KS, Miyamoto S. Glycoproteomic Analyses of Ovarian Cancer Cell Lines and Sera from Ovarian Cancer Patients Show Distinct Glycosylation Changes in Individual Proteins. J. Proeome Res. 2008;7(9):3776–3788. doi: 10.1021/pr800297u. [DOI] [PubMed] [Google Scholar]
- 44.Imrea T, Kremmer T, Héberger K, et al. Mass spectrometric and linear discriminant analysis of N-glycans of human serum alpha-1-acid glycoprotein in cancer patients and healthy individuals. J. Proteomics. 2008;71(2):186–197. doi: 10.1016/j.jprot.2008.04.005. [DOI] [PubMed] [Google Scholar]
- 45.Machado E, Kandzia S, Carilho R, Altevogt P, Conradt HS, Costa J. N-Glycosylation of total cellular glycoproteins from the human ovarian carcinoma SKOV3 cell line and of recombinantly expressed human erythropoietin. Glycobiology. 2011;21(3):376–386. doi: 10.1093/glycob/cwq170. [DOI] [PubMed] [Google Scholar]
- 46.Zhao J, Simeone DM, Heidt D, Anderson MA, Lubman DM. Comparative Serum Glycoproteomics Using Lectin Selected Sialic Acid Glycoproteins with Mass Spectrometric Analysis: Application to Pancreatic Cancer Serum. J. Proeome Res. 2006;5(7):1792–1802. doi: 10.1021/pr060034r. [DOI] [PubMed] [Google Scholar]
- 47.Zhao J, Qiu WL, Simeone DM, Lubman DM. N-linked glycosylation profiling of pancreatic cancer serum using capillary liquid phase separation coupled with mass spectrometric analysis. J. Proeome Res. 2007;6(3):1126–1138. doi: 10.1021/pr0604458. [DOI] [PubMed] [Google Scholar]
- 48.Lin Z, Simeone DM, Anderson MA, et al. Mass Spectrometric Assay for Analysis of Haptoglobin Fucosylation in Pancreatic Cancer. J. Proeome Res. 2011;10(5):2602–2611. doi: 10.1021/pr200102h. [DOI] [PMC free article] [PubMed] [Google Scholar]
- 49.Kyselova Z, Mechref Y, Al Bataineh MM, et al. Alterations in the Serum Glycome Due to Metastatic Prostate Cancer. J. Proeome Res. 2007;6(5):1822–1832. doi: 10.1021/pr060664t. [DOI] [PMC free article] [PubMed] [Google Scholar]
- 50.De Leoz MLA, An HJ, Kronewitter S, et al. Glycomic approach for potential biomarkers on prostate cancer: Profiling of N-linked glycans in human sera and pRNS cell lines. Dis. Markers. 2008;25(4–5):243–258. doi: 10.1155/2008/515318. [DOI] [PMC free article] [PubMed] [Google Scholar]
- 51.Isailovic D, Plasencia MD, Gaye MM, et al. Delineating diseases by IMS-MS profiling of serum N-linked glycans. J. Proteome Res. 2012;11(2):576–585. doi: 10.1021/pr200777u. [DOI] [PMC free article] [PubMed] [Google Scholar]
- 52.Isailovic D, Kurulugama RT, Plasencia MD, et al. Profiling of Human Serum Glycans Associated with Liver Cancer and Cirrhosis by IMS-MS. J. Proteome Res. 2008;7(3):1100–1117. doi: 10.1021/pr700702r. [DOI] [PMC free article] [PubMed] [Google Scholar]
- 53.Hua S, An HJ, Ozcan S, et al. Comprehensive native glycan profiling with isomer separation and quantitation for the discovery of cancer biomarkers. Analyst. 2011;136(18):3663–3671. doi: 10.1039/c1an15093f. [DOI] [PMC free article] [PubMed] [Google Scholar]
- 54.Alley WR, Novotny MV. Glycomic Analysis of Sialic Acid Linkages in Glycans Derived from Blood Serum Glycoproteins. J. Proeome Res. 2010;9(6):3062–3072. doi: 10.1021/pr901210r. [DOI] [PMC free article] [PubMed] [Google Scholar]
- 55.Sekiya S, Wada Y, Tanaka K. Derivatization for stabilizing sialic acids in MALDI-MS. Anal. Chem. 2005;77(15):4962–4968. doi: 10.1021/ac050287o. [DOI] [PubMed] [Google Scholar]
- 56.Wang PH, Lee WL, Juang CM, et al. Enhanced expression of alpha 2,6-sialyltransferase ST6Gal I in cervical squamous cell carcinoma. Gynecol. Oncol. 2003;89(3):395–401. doi: 10.1016/s0090-8258(03)00127-6. [DOI] [PubMed] [Google Scholar]
- 57.Recchi MA, Hebber M, Hornez L, Harduin-Lepers A, Peyrat JP, Delannoy P. Multiplex reverse transcription polymerase chain reaction assessment of sialyltransferase expression in human breast cancer. Cancer Res. 1998;58(18):4066–4070. [PubMed] [Google Scholar]
- 58.Dall'olio F, Chiricolo M, D'errico A, et al. Expression of β-galactoside α1,6 sialyltransferase and of α2-6-sialylated glyconjugates in normal human liver, hepatocarcinoma, and cirrhosis. Glycobiology. 2004;14(1):39–49. doi: 10.1093/glycob/cwh002. [DOI] [PubMed] [Google Scholar]
- 59.Lin S, Kemmer W, Grigull S, Schlag PM. Cell surface alpha 2,6 sialylation affects adhesion of breast carcinoma cells. Exp. Cell. Res. 2002;276(1):101–110. doi: 10.1006/excr.2002.5521. [DOI] [PubMed] [Google Scholar]
- 60.Kirmiz C, Li B, An HJ, et al. A Serum Glycomics Approach to Breast Cancer Biomarkers. Mol. Cell. Proteomics. 2007;6(1):43–55. doi: 10.1074/mcp.M600171-MCP200. [DOI] [PubMed] [Google Scholar]
- 61.An HJ, Miyamoto S, Lancaster KS, et al. Profiling of Glycans in Serum for the Discovery of Potential Biomarkers for Ovarian Cancer. J. Proeome Res. 2006;5(7):1626–1635. doi: 10.1021/pr060010k. [DOI] [PubMed] [Google Scholar]


