

Abstract
A model of reservoir activation and viral replication is introduced accounting for the production of 2-LTR HIV-1 DNA circles following antiviral intensification with the HIV integrase inhibitor raltegravir, considering contributions of de novo infection events and exogenous sources of infected cells, including quiescent infected cell activation. The model shows that a monotonic increase in measured 2-LTR concentration post intensification is consistent with limited de novo infection primarily maintained by sources of infected cells unaffected by raltegravir, such as quiescent cell activation, while a transient increase in measured 2-LTR concentration is consistent with significant levels of efficient (R0 > 1) de novo infection. The model is validated against patient data from the INTEGRAL study and is shown to have a statistically significant fit relative to the null hypothesis of random measurement variation about a mean. We obtain estimates and confidence intervals for the model parameters, including 2-LTR half-life. Seven of the 13 patients with detectable 2-LTR concentrations from the INTEGRAL study have measured 2-LTR dynamics consistent with significant levels of efficient replication of the virus prior to treatment intensification.
Keywords: HIV, mathematical biology, cryptic viremia
1. Introduction
Highly active antiretroviral therapy (HAART) is able to suppress HIV viral replication below the limit of detection in many patients. The rapid rebound of viremia following treatment interruption indicates that HAART is unable to eradicate the virus [1–5]. Low levels of viremia have also been detected in many patients using ultrasensitive viral load assays with sensitivity down to 1 virion per millilitre of plasma [6–12]. It is accepted that low-level viremia persists during effective suppression by HAART; it is unclear whether this viremia derives primarily from the activation of stable viral reservoirs such as the latently infected memory-phenotype CD4+ T cells, or ongoing rounds of successful infection of active CD4+ T cells, or a combination of the two [13–16]. Furthermore, some evidence exists for continued replication of the virus in cryptic reservoirs despite suppression below the standard limit of detection [17]. This may be due to tissue-dependent distribution and efficacy of the antiviral agents [18].
Understanding the origin of cryptic and residual viremia under suppressed conditions is important for a number of reasons. HIV mutations arise primarily during the process of reverse transcription during the de novo infection of active CD4+ T cells [15]. If the viremia is driven primarily by the de novo infection of active CD4+ T cells, it represents an ongoing source of viral mutants that could eventually result in mutational escape from antiviral therapy. The activation of reservoir cells, which does not involve a new round of reverse transcription, does not result in the production of new viral mutants and cannot by itself drive the evolution of antiviral resistance [16,19].
We will frequently refer to two important quantities, the basic reproductive ratio R0 and the effective reproductive ratio R [20]. R0 is the average number of uninfected cells infected by a single infected cell during its lifetime when target cells are assumed to be abundant. This quantity is always greater than 1 in untreated patients, allowing the establishment of infection. The goal of treatment is to reduce this quantity below 1, resulting in exponential decline in infected cell populations. R0 does not change with time, but it may change with experimental condition (i.e. treated versus untreated) or anatomic location (as in a sanctuary site). The effective reproductive ratio R is defined as the average number of uninfected cells infected by an infected cell during its lifetime under the current experimental conditions. This quantity may change with time. If R0 > 1, then R will initially equal R0, but will decline as target cells are depleted. This will continue until the production of infected cells exactly equals the replenishment rate of target cells. At this equilibrium condition, R = 1 if there are no other sources of infected cells, or slightly less than 1 if there are exogenous sources of infected cells. If R0 < 1, then R will be approximately equal to R0 for all time.
Genotypic studies of the residual plasma viremia have shown little or no development of new resistance mutations [9,10,21–24], which has been interpreted as evidence that residual viremia is primarily the result of activation of quiescent reservoirs. Recent analysis of HIV envelope proteins in the gut-associated lymphoid tissue has likewise shown no evidence of evolution during suppressive therapy [25]. Treatment intensification has consistently shown no significant decrease in the residual plasma viremia [26–28]. Conversely, a genotypic study focused on episomal cDNA collected prior to viral rebound indicated that the episomal cDNA showed evidence of recent evolution, implying de novo replication as the source [17].
Many authors have suggested using episomal artefacts of HIV infection as surrogate markers of replication, including linear unintegrated DNA, 1-LTR and 2-LTR circular DNA [29–31]. 2-LTR artefacts are especially useful as the 2-LTR region of the genome is unique to the episomal artefact when compared with linear integrated DNA. However, the use of 2-LTR as a surrogate marker is controversial, primarily due to controversy regarding the half-life of the episomes. 2-LTR circles have been shown to be stable in vitro, leading to the conclusion that they are not an effective surrogate measurement of recent infection [32–34]. Studies estimating the half-life of the circles in vivo, however, indicate that they are highly labile, with half-lives of only a few days, consistent with the results in our study [29,31,35]. One possible explanation is that the host cells may have significantly shorter half-lives in vivo than in vitro, possible due to a high likelihood of programmed proliferation in 2-LTR-containing cells.
In the recently published INTEGRAL study, 45 patients on HAART who had maintained plasma viremia undetectable by standard assays for at least 1 year received standard HAART intensified by the addition of raltegravir for 48 weeks [36,37]. During this time, peripheral-blood mononuclear cell (PBMC) samples were analysed for the presence of cells containing 2-LTR circles. 2-LTR circles are formed when the linear viral DNA is prevented from integrating into the host cell genome, either through failed integration or through the action of integrase inhibitors, such as raltegravir. It is expected, therefore, that the numbers of 2-LTR-containing cells would increase if the raltegravir was interrupting otherwise successful infection events. 2-LTR-containing cells were observed in 13/45 patients receiving raltegravir intensification, compared with 1/22 patients in the control group; this was interpreted as indicating de novo infection and reverse transcription, which strongly suggests that active viral replication persists despite HAART in these individuals.
In this study, we further analyse these data through the use of a mathematical model of 2-LTR formation during virus replication. Analysis of this model shows that increase in 2-LTR-containing cells is not, by itself, evidence of significant levels of ongoing replication. Instead, the model shows that rapid increase followed by a decrease in 2-LTR cells is evidence of significant levels of ongoing infection, while a moderate monotonic increase in 2-LTR cells would be consistent with low levels of ongoing infection.
Intuitively, this is because when there is very little ongoing replication, raltegravir intensification will increase the rate of 2-LTR formation, but will not significantly decrease the number of infection events, as the success rate of infection events was already very low. As a result, we would expect to see a sustained increase in 2-LTR count in this case. Conversely, if there is a significant amount of ongoing replication, raltegravir intensification will increase the rate of 2-LTR infection, but it will also significantly decrease the success rate of infection events. In this case, we expect an initial spike in 2-LTR count, followed by a drop in 2-LTR count as the raltegravir dramatically decreases the incidence of new infection events. This second case is what was seen experimentally in the clinical trial [36,37].
When analysed using this model, it becomes clear that the data from seven patients in the INTEGRAL study are consistent with significant levels of ongoing efficient (R0 > 1) viral replication in a sanctuary site prior to raltegravir intensification. Median estimates of the infected cell turnover rate for these seven patients range from 10 million to 310 million infected cells per day. This ongoing replication rate may be high enough to allow for evolution of resistant virus. The number of patients in the study, however, is insufficient to determine whether these levels of viral replication are typical of HIV patients under effective suppressive therapy, or if they are an anomaly.
2. Material and methods
2.1. Experimental methods
2.1.1. Ethics statement
The previously published clinical study [36,37] was carried out in accordance with a human subjects protocol approved by the institutional ethics review committee at each clinical site. Written informed consent was obtained from all study participants. Patient data were shared in de-identified form in accordance with a protocol approved by the University of Delaware Institutional Review Board.
2.1.2. Study design
This study uses data from a previously published study. The 2-LTR measurement results which are the focus of this work have been previously described in [36,37]. Briefly, a three-site clinical study performed in Barcelona (Spain) enrolled 69 HIV-seropositive patients on suppressive HAART regimens with undetectable viremia for at least 1 year prior to the study. Informed consent was obtained from all study subjects. Twenty-four were randomized to a control group which continued standard HAART, and 45 to a treatment group which continued HAART with the intensification of raltegravir. An average of 6 × 10⁷ PBMCs were sampled and purified from all patients at weeks 0, 2, 4, 12, 24 and 48. The number of HIV 2-LTR circles in these samples were quantified using single-step real-time polymerase chain reaction (PCR). 2-LTR circles were detected in 13 of the 45 patients in the experimental group; the data from these 13 patients are used in this study, and are shown as reported in [36,37] in table 1, corrected for theoretical censoring limits.
Table 1.
Parameter definitions and units, equation (2.1).
| parameter | definition | units |
|---|---|---|
| y | concentration of actively infected cells in the site of 2-LTR formation | infected cells/106 PBMC |
| c | concentration of 2-LTR circles as measured in the blood | 2-LTR circles/106 PBMC |
| R | probability, at the pre-intensification equilibrium, of an actively infected cell successfully infecting a target cell in a single generation | unitless |
| a | death rate of actively infected cells | day−1 |
| ye | rate of production of actively infected cells by processes other than infection, including quiescent cell activation | infected cells/106 PBMC × day |
| ηII | the ratio-reduction in R following raltegravir intensification. Equivalent to the drug efficacy of raltegravir | unitless |
| uII | a binary variable which is 1 when raltegravir is applied and 0 when it is not applied | unitless |
| ϕ | the ratio of the probability of 2-LTR circle formation during an infection event when raltegravir is not present to the probability of 2-LTR formation when raltegravir interrupts an infection event | unitless |
| kII | the probability of 2-LTR circle formation when raltegravir interrupts an infection event | 2-LTR circles/infected cells |
| δ | decay rate of 2-LTR circles | day−1 |
2.2. Modelling 2-LTR formation following raltegravir intensification
Previous work has been done on identifying HIV model parameters from experiments involving the use of integrase inhibitors [38,39]. These models, however, considered only standard viral load measurements, not measurements of 2-LTR circle frequency. We introduce a simple model of the dynamics of the concentrations of actively infected cells y(t) and cells containing 2-LTR episomes c(t) in the site of episome formation. We model the behaviour both in the absence of raltegravir uII = 0 and in the presence of raltegravir uII = 1.
We consider two possible sources of active compartment infected cells: de novo replication events that are inhibited by raltegravir, and exogenous sources of infected cells that are unaffected by raltegravir (ye). This exogenous source includes the activation of quiescent infected cells, but may also include any source of efficient de novo replication which is not suppressed by the addition of raltegravir.
The reproductive ratio of the virus prior to raltegravir intensification is R, and the reproductive ratio after raltegravir intensification is (1 − ηII)R, where ηII is the effectiveness of raltegravir at interrupting infection events that would otherwise have occurred without intensification. The reproductive ratios are defined as the average number of infected cells created per infected cell in a single generation. If the virus was replicating efficiently prior to intensification (R0 > 1), then the measured R would be approximately equal to 1 at equilibrium, as the efficient replication would necessarily be target cell limited. If the infection is controlled prior to intensification (R0 < 1), then the measured reproductive ratio R will be approximately equal to R0.
Infected cells are killed by the virus at a rate ay. Successful infection of target cells by free virus occurs at a rate aRy prior to intensification or at a rate (1 − ηII)Ray post-intensification. Intrinsic formation of 2-LTR cells (unenhanced by raltegravir) is assumed to occur at a rate proportional to the successful infection rate, with a proportionality constant of ϕkII. This is the rate of formation in all cells prior to intensification, and the rate of formation in the cells unaffected by raltegravir following intensification. Intrinsic formation, therefore, occurs prior to intensification at a rate ϕkIIRay, and post-intensification at a rate ϕkII(1 − ηII)Ray.
2-LTR circles may also be formed at an integrase inhibitor-enhanced rate in the presence of raltegravir. The rate at which infection events are interrupted by raltegravir after intensification is ηIIRay which, when multiplied by the probability 0 < kII < 1 that the interruption of an infection even leads to the formation of a 2-LTR episome, gives us the rate of integrase inhibitor-enhanced 2-LTR formation kIIηIIRay. Here, ϕ ≥ 0 is the ratio between the intrinsic rate and the raltegravir-enhanced rate of 2-LTR formation.
Cells containing 2-LTR circles decay at a rate δc; the model does not distinguish whether this is owing to death of the cell, as suggested by [32,33], or decay of episomal DNA, as suggested by [30]. These dynamics can be written in the form of equation (2.1):
 |
2.1 |
This is the simplest form in which the expected 2-LTR dynamics can be written, but it is also the correct simplification of the dynamics illustrated in figure 1, if it is assumed that the target cell concentrations are approximately constant and that free virus has a relatively short half-life. The intermediate steps of entry, reverse transcription, and integration are considered to be part of the life cycle of the infected cells y. If the exogenous sources of infected cells are non-zero, then by definition R < 1 at equilibrium. Assuming that the dynamics have reached equilibrium prior to raltegravir intensification, the measured concentration of 2-LTR after raltegravir intensification is described by
 |
2.2 |
with initial and final values
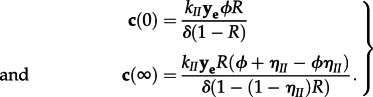 |
2.3 |
The expected 2-LTR concentrations following raltegravir intensification are shown in figure 2, both for the case of controlled replication prior to intensification and for efficient replication prior to intensification. This model is consistent with both the experimental and null hypotheses, as defined in §2.3.
Figure 1.

Virus life cycle. In the site of 2-LTR formation, free virus enters target cells, then undergoes reverse transcription and integration. The infected cell then produces virus and lyses, completing the cycle with a turnover rate of ayR before raltegravir intensification and ay(1 − ηII)R after raltegravir intensification. Active infected cells may also come from exogenous sources not affected by raltegravir at a rate ye; these sources include but are not limited to activation of quiescent reservoir cells and efficient replication in sites unaffected by raltegravir. Integration failure and 2-LTR formation occur at an intrinsic rate which is proportional to the successful infection rate ayϕkIIR before raltegravir intensification or ayϕkII(1 − ηII)R after intensification. The rate of 2-LTR formation in cells affected by raltegravir is proportional to the inhibitory effect of raltegravir, akIIηIIR. 2-LTR-containing cells decay at a rate δ.
Figure 2.

2-LTR responses predicted by the model for varying effective reproduction rates. Either with efficient viral replication (R = 0.9982), intermediate viral replication (R = 0.95) or with little ongoing viral replication (R = 0.7). ye is scaled to provide identical levels of pre-intensification turnover. The median measured data and the measured data points are shown for comparison.
2.3. Hypotheses
H0. The null hypothesis H0 is the hypothesis that the addition of raltegravir does not affect the dynamics of 2-LTR formation. In our model, this is equivalent to setting ηII = 0, which would lead to the solution following intensification of c(t) = c(0). This hypothesis has 1 d.f. per patient, which is the constant, average measured value of 2-LTR circles, for a total of 13 d.f.
H1. The experimental hypothesis H1 is that the addition of raltegravir does affect the dynamics of 2-LTR formation, which follow the dynamics of equation (2.2). We assume that the decay rate of 2-LTR-containing cells δ and the ratio of intrinsic to integrase inhibitor-enhanced 2-LTR formation ϕ do not vary significantly from patient to patient, while the reproductive ratio R, the raltegravir efficacy ηII and the scaled exogenous infected cell rate kIIye may vary significantly from patient to patient, giving us a total of 41 d.f. for the experimental hypothesis.
2.4. Relationship to previously published models
To show that this reduced model is consistent with previously published models of virus dynamics, we introduce an adaptation of the standard model of HIV dynamics [40] that accounts for the formation of 2-LTR cells in the presence and absence of the integrase inhibitor raltegravir, assuming the patient is already on an apparently effective antiviral regimen. The model takes the form
 |
2.4 |
where x is the local concentration of target cells, y is the local concentration of actively infected cells, v is the local concentration of free virus and c is the local concentration of cells containing 2-LTR episomes. As in the standard model, λ is the regeneration rate of target cells, d is the per capita death rate of target cells, β* is the infection rate constant of target cells, corrected for the activity of the pre-intensification antiviral regimen, a is the per capita death rate of actively infected cells, γ is the per capita production rate of free virus by actively infected cells and ω is the per capita decay rate of free virus. A more extensive model of virus dynamics in the presence of raltegravir, including the intermediate events before integration, is presented in [41].
The efficacy of raltegravir at further inhibiting infection events is ηII, and the input uII takes a value of 0 or 1 depending on whether raltegravir is being applied. If a virus entry event is not interrupted by raltegravir, there is a small probability ϕkII that the virus entry event will result in an aborted infection and the formation of a 2-LTR episome. The rate at which virus entry events occur is assumed to be proportional to the successful infection rate β*xv. The addition of raltegravir interferes with the infection process with an efficacy ηII; the cells which are prevented from successful infection are assumed to form 2-LTR episomes at a much higher probability kII. The cells containing 2-LTR decay at a rate δ.
Actively infected cells are created by exogenous processes (including activation of quiescent infected cells) at a rate ye.
If the activity of the existing antivirals in the site is sufficient to contain the virus (i.e. the basic reproductive ratio R0 = β*λγ/daω < 1), then the target cell concentrations will remain very close to the virus-free equilibrium λ/d. Assuming also that  the virus dynamics reduce to the linear form:
 |
2.5 |
which is exactly the form of equation (2.1), with R = R0. When the local activity of the antivirals is sufficiently weak that R0 = β*λγ/daω > 1, then the model describes the target cell limited replication of the virus in a sanctuary site. The dynamics have been explored numerically for a spatially discretized reaction–diffusion partial differential equation model in [42]. It was shown that the simple model of equation (2.5) accurately and robustly reproduces the 2-LTR curves of the full spatial model across the feasible set of assumed diffusion equation parameters. A summary of the numerical results for the spatially discretized version of these results can be found in the electronic supplementary material.
2.5. Calculating pre-intensification de novo infection rate
From equation (2.2), the turnover rate of actively infected cells prior to intensification (normalized to units of cells per 106 PBMCs per day) obeys the inequality given by
| 2.6 |
This equation for ay(0) has units of infected cells per 106 PBMCs per day. In order to convert this into an estimate of the total number of de novo infected cells generated per day, we need an estimate of the number of PBMCs per millilitre and an estimate of the effective total patient volume. There are between 1.1 × 10⁶ and 3.7 × 10⁶ PBMCs per millilitre [43]. A standard estimate for effective patient volume is 30 l (corresponding to a total patient volume of 100 l) as in [44]. These estimates give a minimum conversion factor of
| 2.7 |
from measured peak 2-LTR concentration to minimum de novo infection rate prior to intensification.
2.6. Modelling measurement uncertainty
The measurement techniques used in this experiment are novel, and the number of replicates is insufficient to experimentally assign detection thresholds or standard deviations [45]. We therefore estimate the measurement uncertainty from a probabilistic analysis of the measurement techniques and comparison with similar methods.
The technique first purifies an average of 6 × 10⁷ PBMCs, and uses 70 per cent of these cells to quantify episomal DNA. This leads to an average of 4.2 × 10⁷ PBMCs per sample, which means that one cell containing episomal DNA in the sample would correspond to a measurement of 0.0242 − LTR/106 PBMC. The purified sample is then amplified using a standard PCR assay. When this assay is used to amplify HIV-1 RNA, it has a very conservative published limit of quantification of 50 virions per millilitre from a 1 ml sample. Using this same 50 copy sensitivity limit, we arrive at an equivalent limit of detection for the 2-LTR assay of 1.2(2-LTR/106 PBMC). The reported data from [36] included four non-zero measurements below this limit—we treated these measured values as censored for our analysis.
The PCR process introduces lognormal uncertainty in the 2-LTR estimates, which has been shown to increase as the expected copy number decreases [46–48]. We interpolated between the measured standard deviations for viral loads from 50 copies per millilitre and 104 copies per millilitre as reported in [46] using the theoretical relationship between expected copy number and lognormal standard deviation derived in [47], arriving at a the formula for density-dependent lognormal standard deviation in log10 units:
| 2.8 |
As shown in [48], this interpolation function fits all measured data points from the study of Perrin et al. [46] to within two significant digits. This gives a lognormal standard deviation that ranges from 0.24 log10 at the limit of detection of 1.2 2-LTR × (106 PBMC)−1 to 0.09 log10 for the highest measured value of 72 2-LTR × (106 PBMC)−1. The values of σ are truncated outside of the range 0.08−0.24 log10.
Given the model for limit of quantification and lognormal standard deviation described earlier, we arrive at a likelihood function for a measured 2-LTR concentration m given a modelled 2-LTR concentration c:
| 2.9 |
where fLN is the lognormal probability distribution function and FLN is the lognormal cumulative distribution function. This follows the standard Tobit model for censored measurements [49].
2.7. Identifiability analysis
With prior knowledge of a, the parameter set {R, ηII, ϕ, δ, kIIye} is identifiable from c [50]. The current best estimate for the value of a based on in vivo experiments is 1 ± 0.3 day−1 [51]; we use a nominal value of a = 1 day–1. It is shown in the electronic supplementary material that the estimates of the other parameters are insensitive to variation of a within the range described.
2.8. Model fit
We identified the parameters of equation (2.2) subject to the experimental data using a nonlinear mixed-effects model. Nonlinear mixed-effects models are useful for identifying parameter values for repeated experiments when there is a reasonable expectation that certain parameters have consistent values between trials; they also allow us to borrow information across subjects to compensate when sparse data are available for individual subjects [52,53]. These formulations have been used many times previously for HIV model parameter estimation [54–59].
To reduce the parametric covariance, we introduced a re-parametrized parameter A = kIIye/δ to replace kIIye. While all five parameters are identifiable in theory, the sparsity of the measurements required considering two parameters to be fixed effects, with a common value for all patients. There is no reason to assume that either the decay rate of 2-LTR-containing cells or the ratio of 2-LTR production in the presence versus the absence of raltegravir would vary significantly between patients, so the parameters {ϕ, δ} were considered fixed effects, with no inter-patient variation, and the parameters {R, ηII, A} were considered random effects, subject to inter-patient variation, yielding the nonlinear mixed-effects problem formulation:
 |
2.10 |
where mi(ti,k) is the ith patient's measured 2-LTR count at time ti,k, ei,k is lognormally distributed zero-mean measurement variance, c(·) is equation (2.2) evaluated for the parameter set for the given patient and σ(c) is given by equation (2.8).
The posterior distribution of the parameter likelihood given the measured 2-LTR values was computed using a Bayesian Markov chain Monte Carlo method with Gibbs sampling, as in [57,60–62], with non-informative prior distributions for the parameters as follows:
 |
2.11 |
where LN is the lognormal distribution, U is the uniform distribution and μi is a patient-specific mean arrived at through simulated-annealing-based optimization. The histograms of the posterior distribution were analysed to obtain the median, mode and confidence interval estimates reported in table 3. Additional details of the method are shown in the electronic supplementary material.
Table 3.
Fitted parameter values.
| patient no. | parameter | units | median | MLE | 95% CI |
|---|---|---|---|---|---|
| all | ϕ | — | 0.0019 | 0.0018 | (0.0011, 0.0037) |
| δ | day–1 | 0.47 | 0.46 | (0.36,0.83) | |
| 001-23 | R | — | 0.9995 | 0.9999 | (0.9975,1.0000) |
| ηII | — | 0.12 | 0.08 | (0.04,0.26) | |
| kIIye | 2-LTR circles × (106 PBMC)−1 × day−1 | 0.15 | 0.21 | (0.01,0.62) | |
| 001-33 | R | — | 0.9985 | 0.9990 | (0.9895,0.9996) |
| ηII | — | 0.78 | 0.01 | (0.002,0.99) | |
| kIIye | 2-LTR circles × (106 PBMC)−1 × day−1 | 0.59 | 0.51 | (0.23,2.24) | |
| 001-35 | R | — | 0.9988 | 0.9994 | (0.9901,0.9998) |
| ηII | — | 0.21 | 0.19 | (0.12,0.37) | |
| kIIye | 2-LTR circles × (106 PBMC)−1 × day−1 | 0.37 | 0.39 | (0.06,1.41) | |
| 001-43 | R | — | 0.9994 | 0.9997 | (0.9970,0.9999) |
| ηII | — | 0.02 | 0.02 | (0.01,0.13) | |
| kIIye | 2-LTR circles × (106 PBMC)−1 × day−1 | 0.55 | 0.68 | (0.09,1.68) | |
| 001-44 | R | — | 0.9999 | 0.9999 | (0.9997,1.0000) |
| ηII | — | 0.53 | 0.49 | (0.36,0.92) | |
| kIIye | 2-LTR circles × (106 PBMC)−1 × day−1 | 1.10 | 1.27 | (0.53,2.22) | |
| 006-69 | R | — | 0.9999 | 0.9999 | (0.9997,1.0000) |
| ηII | — | 0.74 | 0.77 | (0.43,0.99) | |
| kIIye | 2-LTR circles × (106 PBMC)−1 × day−1 | 0.90 | 0.87 | (0.42,1.84) | |
| 023-25 | R | — | 0.7633 | 0.9940 | (0.0425,0.9972) |
| ηII | — | 0.38 | 0.05 | (0.03,0.97) | |
| kIIye | 2-LTR circles × (106 PBMC)−1 × day−1 | 1.58 | 1.08 | (0.36,55.5) | |
| 023-68 | R | — | 0.9994 | 0.9999 | (0.9976,0.9999) |
| ηII | — | 0.04 | 0.03 | (0.02,0.07) | |
| kIIye | 2-LTR circles × (106 PBMC)−1 × day−1 | 0.21 | 0.29 | (0.02,0.84) | |
| 001-13 | R | — | 0.4822 | 0.1748 | (0.0241,0.9670) |
| ηII | — | 0.39 | 0.01 | (0.01,0.97) | |
| kIIye | 2-LTR circles × (106 PBMC)−1 × day−1 | 5.11 | 2.14 | (0.96,387.2) | |
| 001-42 | R | — | 0.4923 | 0.6345 | (0.0234,0.9588) |
| ηII | — | 0.53 | 0.79 | (0.06,0.97) | |
| kIIye | 2-LTR circles × (106 PBMC)−1 × day−1 | 1.92 | 0.80 | (0.47,83.6) | |
| 006-48 | R | — | 0.4790 | 0.2843 | (0.0270,0.9558) |
| ηII | — | 0.50 | 0.01 | (0.02,0.98) | |
| kIIye | 2-LTR circles × (106 PBMC)−1 × day−1 | 3.11 | 1.73 | (0.70,160.2) | |
| 006-52 | R | — | 0.4893 | 0.9017 | (0.0260,0.9543) |
| ηII | — | 0.55 | 0.81 | (0.04,0.98) | |
| kIIye | 2-LTR circles × (106 PBMC)−1 × day−1 | 2.79 | 1.41 | (0.70,106.4) | |
| 023-47 | R | — | 0.4997 | 0.5138 | (0.0262,0.9639) |
| ηII | — | 0.53 | 0.99 | (0.05,0.98) | |
| kIIye | 2-LTR circles × (106 PBMC)−1 × day−1 | 2.00 | 1.14 | (0.50,68.1) |
3. Results
3.1. Experimental results
The experimental results have been previously published in [36,37]. The measured 2-LTR concentrations from the 13 patients in the experimental group with non-zero 2-LTR measurements are shown in table 2, corrected for a limit of quantification of 1.2 2-LTR per 106 PBMCs (see §2 for details). The plasma viral load remained below the standard limit of detection for the duration of the experiment.
Table 2.
Experimental 2-LTR quantification data for the 13 patients with units 2-LTR per 106 PBMC, as reported in [36,37], adjusted for theoretical censoring limits.
| patient no. | week post-intensification |
|||||
|---|---|---|---|---|---|---|
| 0 | 2 | 4 | 12 | 24 | 48 | |
| 001-23 | <1.20 | 23.69 | — | <1.20 | <1.20 | <1.20 |
| 001-33 | 2.99 | 1.98 | 3.03 | — | <1.20 | <1.20 |
| 001-35 | <1.20 | 21.47 | <1.20 | — | — | — |
| 001-43 | 1.76 | 48.16 | — | 10.38 | 2.73 | <1.20 |
| 001-44 | 38.62 | 72.77 | <1.20 | 7.38 | 2.20 | — |
| 006-69 | 35.30 | 30.55 | 9.07 | 1.26 | <1.20 | — |
| 023-25 | <1.20 | 5.84 | 5.37 | <1.20 | 1.88 | <1.20 |
| 023-68 | 9.98 | 12.98 | 13.42 | 1.61 | <1.20 | <1.20 |
| 001-13 | <1.20 | 3.05 | 3.19 | <1.20 | 1.29 | 7.04 |
| 001-42 | — | <1.20 | <1.20 | 9.55 | <1.20 | <1.20 |
| 006-48 | <1.20 | <1.20 | 2.68 | 39.64 | <1.20 | <1.20 |
| 006-52 | <1.20 | <1.20 | 24.75 | 30.11 | <1.20 | <1.20 |
| 023-47 | <1.20 | <1.20 | 21.07 | <1.20 | <1.20 | <1.20 |
3.2. Model fit
Markov chain Monte Carlo methods were used to fit equation (2.2) to the experimental data for 13 patients, with shared parameters {ϕ, δ} and patient-specific parameters {R, ηII, kIIye}, using the measurement uncertainty model described in §2. Hypothesis H1 had a statistically significant fit to the data, with p < 10−5 from the log-likelihood ratio test and a ΔAICc of –143 compared with the null hypothesis H0 of random variation about the mean value, giving the null hypothesis H0 a residual likelihood of less than 10−5. The maximum-likelihood predicted 2-LTR concentrations for each patient, together with the 95% prediction interval, are shown compared with the measured data in figure 3. The maximum-likelihood (posterior mode), median and 95% CI values for the parameters for each patient are shown in table 3.
Figure 3.

Maximum-likelihood prediction and 95% credible prediction intervals compared with measured data for 13 patients.
3.3. Parameter estimates
The estimated decay rate δ of the measured 2-LTR had a median estimate of 0.47 and a 95% CI of 0.36–0.83 day−1, slightly faster than the previously estimated in vivo rates of 0.04–0.4 day−1 [29,31,35].
The ratio ϕ between the likelihood of 2-LTR formation during an infection event uninterrupted by raltegravir to the likelihood of 2-LTR formation if raltegravir interrupted the infection event had a median estimate of 0.002 and a 95% CI of 0.001–0.004; interruption of integration by raltegravir makes 2-LTR formation approximately 250–1000 times more likely. These estimates are consistent with the increased production of 2-LTR in the presence of raltegravir both in vitro [63] and in vivo [64].
For seven patients (patients 001-23, 001-33, 001-35, 001-43, 001-44, 006-69 and 023-68), the median, maximum likelihood and 95% CIs for the pre-intensification reproductive ratio R are lower-bounded by 0.99, implying the presence of uncontrolled, cryptic replication of the virus in these patients prior to raltegravir intensification. For patient 023-25, the maximum-likelihood estimate of R = 0.9940 is consistent with cryptic replication, but the data do not sufficiently constrain this estimate, resulting in a long-tailed posterior distribution and broad confidence intervals. For the remaining five patients, the posterior distribution of R is not significantly different from the prior uniform distribution between 0 and 1, demonstrating that there was very little information about this parameter in the measured data for these patients.
The scaled rate of exogenous infected cell entry kIIye was remarkably consistent, with median estimates bounded between 0.2 and 2.1 2-LTR circles (106 PBMC)−1 day−1 for all 13 patients. The probability kII is upper-bounded by 1, so these rates provide a lower bound on the median estimate of ye of 0.2 infected cells per million PBMCs per day, a rate consistent with quiescent cell activation. Since kII is not uniquely identifiable from the data, an upper bound cannot be obtained.
The residual efficacy of raltegravir ηII was poorly constrained by the data, with tight credible intervals available only for five of the 13 patients. The sampling rate in this experiment is too low to obtain tight bounds on this parameter for most patients in the study.
4. Discussion
We have introduced a new model to account for the formation of 2-LTR circles in the presence and absence of raltegravir intensification, and validated this model against patient data from a raltegravir intensification study [36,37]. The data were shown to overwhelmingly favour our model when compared with the null hypothesis. Tightly bounded estimates were obtained for the shared parameters ϕ and δ. Tightly bounded estimates for the patient-specific parameters R, ηII and kIIye were obtained for a subset of the patients, with broader confidence intervals obtained for the other patients. Since all parameters are theoretically identifiable from the data, the broad confidence intervals for these patients do not in any way reduce the confidence in the tight intervals found for the other patients [65–68]. The primary reason for the broad confidence intervals appears to be a relatively low sampling rate. If the experiment were repeated with higher frequency measurements, tighter confidence intervals on all five parameters could be obtained. Conversely, experiments that sample 2-LTR concentrations less frequently following intensification (i.e. 12 week intervals [28] and four week intervals [69]) are likely to miss the observed peaks altogether.
Tight bounds on the infection success ratio R were obtained for seven of the 13 patients, showing that good fits to the data for these patients were only consistent with R in the range 0.99 < R < 1. As discussed previously, a finding that the measured reproductive ratio is essentially equal to 1 is consistent with the hypothesis that ongoing efficient replication is occurring in a sanctuary site with poor antiviral drug penetration. Many candidates for potential sanctuary sites have previously been identified [70–73]. For these seven patients, the measured data are also inconsistent with the alternative hypothesis that the measured 2-LTR were formed through limited rounds of infection primarily sourced from the activation of quiescently infected cells. If this was the case, then measured R would range between 0.1 and 0.8 [60,61] and the increase in measured 2-LTR would be followed by little or no decrease, as shown in figure 2. This alternative hypothesis is not ruled out for the other six patients in the study.
The observed dynamics of 2-LTR circles in the blood allow us to calculate minimum turnover rates for the efficient replication occurring in these patients. As seen in table 4, the median estimates for pre-intensification infected cell turnover in the seven patients exhibiting efficient replication range from 10 million infected cells per day up to 310 million infected cells per day. If the virus produced by this level of ongoing infection diffused freely through the patient, this would correspond to measured plasma viremia well above the standard limit of detection; this is not observed, consistent with the cryptic replication hypothesis, with replication occurring in a sanctuary site. To explain the data, the sanctuary site would have to reside in an anatomical location where the average diffusion time to the blood of a free virus was longer than its 30 min half-life, the average diffusion time to the blood of an infected cell was longer than its 0.7 day half-life, but the average diffusion time to the blood of a 2-LTR-containing cell was shorter than its approximately 1.5 day half-life.
Table 4.
Estimated pre-intensification infected cell turnover rates in units of cells day−1, assuming kII = 1 and an effective patient volume of 30 l.
| patient no. | median | MLE | 95% CI |
|---|---|---|---|
| 001-23 | 1.0 × 10⁷ | 1.1 × 10⁷ | (4.0 × 10⁶, 2.6 × 10⁷) |
| 001-33 | 1.3 × 10⁷ | 1.3 × 10⁷ | (3.1 × 10⁶, 5.1 × 10⁷) |
| 001-35 | 9.7 × 10⁶ | 1.1 × 10⁷ | (2.4 × 10⁶, 2.8 × 10⁷) |
| 001-43 | 3.0 × 10⁷ | 3.3 × 10⁷ | (1.2 × 10⁷, 6.3 × 10⁷) |
| 001-44 | 3.1 × 10⁸ | 2.8 × 10⁸ | (1.1 × 10⁸, 8.3 × 10⁸) |
| 006-69 | 2.5 × 10⁸ | 2.9 × 10⁸ | (8.2 × 10⁷, 7.2 × 10⁸) |
| 023-25 | 4.9 × 10⁵ | 2.5 × 10⁵ | (1.1 × 10⁵, 7.1 × 10⁶) |
| 023-68 | 1.2 × 10⁷ | 1.1 × 10⁷ | (6.8 × 10⁶, 2.4 × 10⁷) |
| 001-13 | 4.5 × 10⁵ | 2.5 × 10⁵ | (1.2 × 10⁵, 1.6 × 10⁷) |
| 001-42 | 1.8 × 10⁵ | 1.0 × 10⁵ | (6.1 × 10⁴, 3.1 × 10⁶) |
| 006-48 | 2.7 × 10⁵ | 2.0 × 10⁵ | (9.0 × 10⁴, 6.6 × 10⁶) |
| 006-52 | 2.4 × 10⁵ | 1.7 × 10⁵ | (8.7 × 10⁴, 3.9 × 10⁶) |
| 023-47 | 1.9 × 10⁵ | 1.2 × 10⁵ | (6.5 × 10⁴, 2.6 × 10⁶) |
4.1. Clinical significance
The level of efficient replication indicated by the patterns of measured 2-LTR in circulating PBMCs following treatment intensification by raltegravir is quite high. Replication rates of 1 × 10⁷ cells day−1 are high enough to make it probable that important resistance mutations are generated, and the fact that the replication is occurring in a site that allows for efficient replication makes it possible for the mutated cells to persist long enough to acquire additional mutations. This would provide a mechanism for sequentially acquiring the multi-drug resistance necessary to escape therapy, and would explain the experimental results showing evidence of such a lineage of acquired mutations in episomal DNA recovered from patients who experience treatment failure [17].
It is also interesting that this level of replication is occurring in patients who have measured plasma viral loads persistently below the detection threshold. This implies that this replication is cryptic, unobservable from standard viral load assays. The existence of cryptic, efficient replication of HIV in patients with plasma viremia persistently below the limit of detection is a troubling result.
The data seem to indicate that the addition of raltegravir reduces the level of cryptic replication to undetectable levels. There are a number of possible explanations for this. The addition of raltegravir could cause the residual activity of the antiviral drugs to cross a threshold of efficacy, bringing the basic reproductive ratio of the virus in the site of 2-LTR formation below 1. In this case, the effect is not unique to raltegravir, but is instead merely a result of using four antiviral drugs simultaneously. It is also possible that the properties of raltegravir allow it to penetrate the site of 2-LTR formation better than the other antiviral drugs. The experiment does not provide sufficient data to distinguish between these hypotheses.
It is important to remember that of the 45 patients in the experimental group, only 13 had any non-zero measurements of 2-LTR-containing cells. This proportion is consistent with previous studies showing the existence of non-overlapping 2-LTR-positive and 2-LTR-negative patient subgroups [31]. Of these 13, only seven had dynamics consistent with efficient cryptic viremia. This is consistent with efficient cryptic viremia rates in the treated HIV patient population of between 6 and 29 per cent. Therefore, these findings may only apply to a small subset of patients; further study will be necessary to determine whether cryptic viremia is more widespread.
Finally, the limited data available in this experiment forced us to use a reduced model of 2-LTR dynamics following raltegravir intensification. While this reduced model exhibited excellent fit to the measured data, it neglects many sources of more complicated dynamics in the system, including the dynamics of target cell recovery and the spatial dynamics of diffusion from the sanctuary site to the blood. While we believe that the model simplifications used in this study are valid, it is clear that a follow-up experiment, with a significantly higher frequency of measurement of 2-LTR concentrations, will be necessary to further validate the model and explore the higher-order dynamics introduced by the phenomena neglected in this study. This will allow us to determine whether efficient cryptic replication remains the best explanation of the observed transient peaks in measured 2-LTR following raltegravir intensification, or whether more complicated models can provide a better explanation.
Acknowledgements
The project described was supported by award nos. R21AI078842, RO1 AI087135 and P30 AI078498 from the National Institute of Allergy and Infectious Diseases. The content is solely the responsibility of the authors and does not necessarily represent the official views of the National Institute of Allergy and Infectious Diseases or the National Institutes of Health. The funders had no role in study design, data collection and analysis, decision to publish, or preparation of the manuscript. Dr Zurakowski is named on a provisional patent filing concerning the results reported here. Dr Zurakowski has received lecture sponsorships from Merck. Dr Martinez-Picado has received research funding, consultancy fees, or lecture sponsorships from GlaxoSmithKline, Merck and Roche. The authors would like to thank Dr Zvi Grossman for his very helpful comments on an early version of the manuscript.
References
- 1.Hatano H, Vogel S, Yoder C, Metcalf JA, Dewar R, Davey RT, Polis MA. 2000. Pre-HAART HIV burden approximates post-HAART viral levels following interruption of therapy in patients with sustained viral suppression. AIDS 14, 1357–1363 10.1097/00002030-200007070-00008 (doi:10.1097/00002030-200007070-00008) [DOI] [PubMed] [Google Scholar]
- 2.Chun TW, Davey RT, Ostrowski M, Shawn Justement J, Engel D, Mullins JI, Fauci AS. 2000. Relationship between pre-existing viral reservoirs and the re-emergence of plasma viremia after discontinuation of highly active anti-retroviral therapy. Nat. Med. 6, 757–761 10.1038/77481 (doi:10.1038/77481) [DOI] [PubMed] [Google Scholar]
- 3.Chun TW, Davey RT, Engel D, Lane HC, Fauci AS. 1999. Re-emergence of HIV after stopping therapy. Nature 401, 874–875 10.1038/44755 (doi:10.1038/44755) [DOI] [PubMed] [Google Scholar]
- 4.Davey R, et al. 1999. HIV-1 and T cell dynamics after interruption of highly active antiretroviral therapy (HAART) in patients with a history of sustained viral suppression. Proc. Natl Acad. Sci. USA 96, 15 109–15 114 10.1073/pnas.96.26.15109 (doi:10.1073/pnas.96.26.15109) [DOI] [PMC free article] [PubMed] [Google Scholar]
- 5.Wong JK, Hezareh M, Günthard HF, Havlir DV, Ignacio CC, Spina CA, Richman DD. 1997. Recovery of replication-competent HIV despite prolonged suppression of plasma viremia. Science 278, 1291–1295 10.1126/science.278.5341.1291 (doi:10.1126/science.278.5341.1291) [DOI] [PubMed] [Google Scholar]
- 6.Palmer S, et al. 2003. New real-time reverse transcriptase-initiated PCR assay with single-copy sensitivity for human immunodeficiency virus type 1 RNA in plasma. J. Clin. Microbiol. 41, 4531–4536 10.1128/JCM.41.10.4531-4536.2003 (doi:10.1128/JCM.41.10.4531-4536.2003) [DOI] [PMC free article] [PubMed] [Google Scholar]
- 7.Trono D, Van Lint C, Rouzioux C, Verdin E, Barré-Sinoussi F, Chun TW, Chomont N. 2010. HIV persistence and the prospect of long-term drug-free remissions for HIV-infected individuals. Science 329, 174–180 10.1126/science.1191047 (doi:10.1126/science.1191047) [DOI] [PubMed] [Google Scholar]
- 8.Hatano H, et al. 2010. Evidence of persistent low-level viremia in long-term HAART-suppressed, HIV-infected individuals. AIDS 24, 2535–2539 10.1097/QAD.0b013e32833dba03 (doi:10.1097/QAD.0b013e32833dba03) [DOI] [PMC free article] [PubMed] [Google Scholar]
- 9.Nettles RE, et al. 2005. Intermittent HIV-1 viremia (Blips) and drug resistance in patients receiving HAART. JAMA 293, 817–829 10.1001/jama.293.7.817 (doi:10.1001/jama.293.7.817) [DOI] [PubMed] [Google Scholar]
- 10.Persaud D, et al. 2004. Continued production of drug-sensitive human immunodeficiency virus type 1 in children on combination antiretroviral therapy who have undetectable viral loads. J. Virol. 78, 968–979 10.1128/JVI.78.2.968-979.2004 (doi:10.1128/JVI.78.2.968-979.2004) [DOI] [PMC free article] [PubMed] [Google Scholar]
- 11.Maldarelli F, et al. 2007. ART suppresses plasma HIV-1 RNA to a stable set point predicted by pretherapy viremia. PLoS Pathogens 3, e46. 10.1371/journal.ppat.0030046 (doi:10.1371/journal.ppat.0030046) [DOI] [PMC free article] [PubMed] [Google Scholar]
- 12.Dornadula G, et al. 1999. Residual HIV-1 RNA in blood plasma of patients taking suppressive highly active antiretroviral therapy. JAMA 282, 1627–1632 10.1001/jama.282.17.1627 (doi:10.1001/jama.282.17.1627) [DOI] [PubMed] [Google Scholar]
- 13.Josefsson L, Dahl V, Palmer S. 2010. Can HIV infection be eradicated through use of potent antiviral agents? Curr. Opin. Infect. Dis. 23, 628–632 10.1097/QCO.0b013e32833ff1d0 (doi:10.1097/QCO.0b013e32833ff1d0) [DOI] [PubMed] [Google Scholar]
- 14.Maldarelli F. 2011. Targeting viral reservoirs: ability of antiretroviral therapy to stop viral replication. Curr. Opin. HIV AIDS 6, 49–56 10.1097/COH.0b013e32834134ea (doi:10.1097/COH.0b013e32834134ea) [DOI] [PMC free article] [PubMed] [Google Scholar]
- 15.Siliciano JD, Siliciano RF. 2010. Biomarkers of HIV replication. Curr. Opin. HIV AIDS 5, 491–497 10.1097/COH.0b013e32833f206f (doi:10.1097/COH.0b013e32833f206f) [DOI] [PubMed] [Google Scholar]
- 16.Tobin NH, et al. 2005. Evidence that low-level viremias during effective highly active antiretroviral therapy result from two processes: expression of archival virus and replication of virus. J. Virol. 79, 9625–9634 10.1128/JVI.79.15.9625-9634.2005 (doi:10.1128/JVI.79.15.9625-9634.2005) [DOI] [PMC free article] [PubMed] [Google Scholar]
- 17.Sharkey M, Babic DZ, Greenough T, Gulick R, Kuritzkes DR, Stevenson M. 2011. Episomal viral cDNAs identify a reservoir that fuels viral rebound after treatment interruption and that contributes to treatment failure. PLoS Pathogens 7, e1001303. 10.1371/journal.ppat.1001303 (doi:10.1371/journal.ppat.1001303) [DOI] [PMC free article] [PubMed] [Google Scholar]
- 18.Cohen J. 2011. HIV/AIDS research. Tissue says blood is misleading, confusing HIV cure efforts. Science 334, 1614. 10.1126/science.334.6063.1614 (doi:10.1126/science.334.6063.1614) [DOI] [PubMed] [Google Scholar]
- 19.Lambotte O, Chaix ML, Gubler B, Nasreddine N, Wallon C, Goujard C, Rouzioux C, Taoufik Y, Delfraissy J-F. 2004. The lymphocyte HIV reservoir in patients on long-term HAART is a memory of virus evolution. AIDS 18, 1147–1158 10.1097/00002030-200405210-00008 (doi:10.1097/00002030-200405210-00008) [DOI] [PubMed] [Google Scholar]
- 20.Cintrón-Arias A, Castillo-Chávez C, Bettencourt LMA, Lloyd AL, Banks HT. 2009. The estimation of the effective reproductive number from disease outbreak data. Math. Biosci. Eng. 6, 261–282 10.3934/mbe.2009.6.261 (doi:10.3934/mbe.2009.6.261) [DOI] [PubMed] [Google Scholar]
- 21.Anderson JA, et al. 2011. Clonal sequences recovered from plasma from patients with residual HIV-1 viremia and on intensified antiretroviral therapy are identical to replicating viral RNAs recovered from circulating resting CD4+ T cells. J. Virol. 85, 5220–5223 10.1128/JVI.00284-11 (doi:10.1128/JVI.00284-11) [DOI] [PMC free article] [PubMed] [Google Scholar]
- 22.Kieffer TL, Finucane MM, Nettles RE, Quinn TC, Broman KW, Ray SC, Persaud D, Siliciano R. 2004. Genotypic analysis of HIV-1 drug resistance at the limit of detection: virus production without evolution in treated adults with undetectable HIV loads. J. Infect. Dis. 189, 1452–1465 10.1086/382488 (doi:10.1086/382488) [DOI] [PubMed] [Google Scholar]
- 23.Hermankova M, et al. 2001. HIV-1 drug resistance profiles in children and adults with viral load of <50 copies/mL receiving combination therapy. JAMA 286, 196–207 10.1001/jama.286.2.196 (doi:10.1001/jama.286.2.196) [DOI] [PubMed] [Google Scholar]
- 24.Bailey JR, et al. 2006. Residual human immunodeficiency virus type 1 viremia in some patients on antiretroviral therapy is dominated by a small number of invariant clones rarely found in circulating CD4+ T cells. J. Virol. 80, 6441–6457 10.1128/JVI.00591-06 (doi:10.1128/JVI.00591-06) [DOI] [PMC free article] [PubMed] [Google Scholar]
- 25.Evering TH, Mehandru S, Racz P, Tenner-Racz K, Poles MA, Figueroa A, Mohri H, Markowitz M, Malim MH. 2012. Absence of HIV-1 evolution in the gut-associated lymphoid tissue from patients on combination antiviral therapy initiated during primary infection. PLoS Pathogens 8, e1002506. 10.1371/journal.ppat.1002506 (doi:10.1371/journal.ppat.1002506) [DOI] [PMC free article] [PubMed] [Google Scholar]
- 26.Dinoso JB, et al. 2009. Treatment intensification does not reduce residual HIV-1 viremia in patients on highly active antiretroviral therapy. Proc. Natl Acad. Sci. USA 106, 9403–9408 10.1073/pnas.0903107106 (doi:10.1073/pnas.0903107106) [DOI] [PMC free article] [PubMed] [Google Scholar]
- 27.McMahon D, et al. 2010. Short-course raltegravir intensification does not reduce persistent low-level viremia in patients with HIV-1 suppression during receipt of combination antiretroviral therapy. Clin. Infect. Dis. 50, 912–919 10.1086/650749 (doi:10.1086/650749) [DOI] [PMC free article] [PubMed] [Google Scholar]
- 28.Gandhi RT, et al. 2012. No effect of raltegravir intensification on viral replication markers in the blood of HIV-1-infected patients receiving antiretroviral therapy. J. Acquir. Immune Defic. Syndr. 59, 229–235 10.1097/QAI.0b013e31823fd1f2 (doi:10.1097/QAI.0b013e31823fd1f2) [DOI] [PMC free article] [PubMed] [Google Scholar]
- 29.Pauza CD, Trivedi P, McKechnie TS, Richman DD, Graziano FM. 1994. 2-LTR circular viral DNA as a marker for human immunodeficiency virus type 1 infection in vivo. Virology 205, 470–478 10.1006/viro.1994.1667 (doi:10.1006/viro.1994.1667) [DOI] [PubMed] [Google Scholar]
- 30.Sharkey ME, et al. 2000. Persistence of episomal HIV-1 infection intermediates in patients on highly active anti-retroviral therapy. Nat. Med. 6, 76–81 10.1038/71569 (doi:10.1038/71569) [DOI] [PMC free article] [PubMed] [Google Scholar]
- 31.Morlese J, Teo IA, Choi JW, Gazzard B, Shaunak S. 2003. Identification of two mutually exclusive groups after long-term monitoring of HIV DNA 2-LTR circle copy number in patients on HAART. AIDS 17, 679–683 10.1097/00002030-200303280-00005 (doi:10.1097/00002030-200303280-00005) [DOI] [PubMed] [Google Scholar]
- 32.Pierson TC, Kieffer TL, Ruff CT, Buck C, Gange SJ, Siliciano RF. 2002. Intrinsic stability of episomal circles formed during human immunodeficiency virus type 1 replication. J. Virol. 76, 4138–4144 10.1128/JVI.76.8.4138-4144.2002 (doi:10.1128/JVI.76.8.4138-4144.2002) [DOI] [PMC free article] [PubMed] [Google Scholar]
- 33.Butler SL, Johnson EP, Bushman FD. 2002. Human immunodeficiency virus cDNA metabolism: notable stability of two-long terminal repeat circles. J. Virol. 76, 3739–3747 10.1128/JVI.76.8.3739-3747.2002 (doi:10.1128/JVI.76.8.3739-3747.2002) [DOI] [PMC free article] [PubMed] [Google Scholar]
- 34.Bushman F. 2003. Measuring covert HIV replication during HAART: the abundance of 2-LTR circles is not a reliable marker. AIDS 17, 749–750 10.1097/00002030-200303280-00014 (doi:10.1097/00002030-200303280-00014) [DOI] [PubMed] [Google Scholar]
- 35.Zhu W, et al. 2011. Rapid turnover of 2-LTR HIV-1 DNA during early stage of highly active antiretroviral therapy. PLoS ONE 6, e21081. 10.1371/journal.pone.0021081 (doi:10.1371/journal.pone.0021081) [DOI] [PMC free article] [PubMed] [Google Scholar]
- 36.Buzón MJ, et al. 2010. HIV-1 replication and immune dynamics are affected by raltegravir intensification of HAART-suppressed subjects. Nat. Med. 16, 460–465 10.1038/nm.2111 (doi:10.1038/nm.2111) [DOI] [PubMed] [Google Scholar]
- 37.Llibre JM, et al. 2012. Treatment intensification with raltegravir in subjects with sustained HIV-1 viremia suppression: a randomized 48 weeks study. Antivir. Ther. (Lond.) 17, 355–364 10.3851/IMP1917 (doi:10.3851/IMP1917) [DOI] [PubMed] [Google Scholar]
- 38.Murray JM. 2009. HIV dynamics and integrase inhibitors. Antivir. Chem. Chemother. 19, 157–164 [DOI] [PubMed] [Google Scholar]
- 39.Murray JM, Emery S, Kelleher AD, Law M, Chen J, Hazuda DJ, Nguyen BT, Teppler H, Cooper DA. 2007. Antiretroviral therapy with the integrase inhibitor raltegravir alters decay kinetics of HIV, significantly reducing the second phase. AIDS 21, 2315–2321 10.1097/QAD.0b013e3282f12377 (doi:10.1097/QAD.0b013e3282f12377) [DOI] [PubMed] [Google Scholar]
- 40.Perelson A. 1993. Dynamics of HIV infection of CD4+ T cells. Math. Biosci. 114, 81–125 10.1016/0025-5564(93)90043-A (doi:10.1016/0025-5564(93)90043-A) [DOI] [PubMed] [Google Scholar]
- 41.Sedaghat AR, Siliciano RF, Wilke CO. 2009. Constraints on the dominant mechanism for HIV viral dynamics in patients on raltegravir. Antivir. Ther. (Lond.) 14, 263–271 [PMC free article] [PubMed] [Google Scholar]
- 42.Cardozo EF, Vargas CA, Zurakowski R. 2012. A compartment based model for the formation of 2-LTR circles after raltegravir intensification. In 51st IEEE Conf. on Decision and Control, Maui, HI, USA, 10–13 December 2012, pp. 4924–4929 10.1109/CDC.2012.6426088 (doi:10.1109/CDC.2012.6426088) [DOI] [Google Scholar]
- 43.Crosley LK, et al. 2009. Variation in protein levels obtained from human blood cells and biofluids for platelet, peripheral blood mononuclear cell, plasma, urine and saliva proteomics. Genes Nutr. 4, 95–102 10.1007/s12263-009-0121-x (doi:10.1007/s12263-009-0121-x) [DOI] [PMC free article] [PubMed] [Google Scholar]
- 44.Colgrove R, Japour A. 1999. A combinatorial ledge: reverse transcriptase fidelity, total body viral burden, and the implications of multiple-drug HIV therapy for the evolution of antiviral resistance. Antivir. Res. 41, 45–56 10.1016/S0166-3542(98)00062-X (doi:10.1016/S0166-3542(98)00062-X) [DOI] [PubMed] [Google Scholar]
- 45.Armbruster DA, Pry T. 2008. Limit of blank, limit of detection and limit of quantitation. Clin. Biochem. Rev. 29(Suppl. 1), S49–S52 [PMC free article] [PubMed] [Google Scholar]
- 46.Perrin L, Pawlotsky JM, Bouvier-Alias M, Sarrazin C, Zeuzem S, Colucci G. 2006. Multicenter performance evaluation of a new TaqMan PCR assay for monitoring human immunodeficiency virus RNA load. J. Clin. Microbiol. 44, 4371–4375 10.1128/JCM.00505-06 (doi:10.1128/JCM.00505-06) [DOI] [PMC free article] [PubMed] [Google Scholar]
- 47.Bengtsson M, Hemberg M, Rorsman P, Ståhlberg A. 2008. Quantification of mRNA in single cells and modelling of RT-qPCR induced noise. BMC Mol. Biol. 9, 63. 10.1186/1471-2199-9-63 (doi:10.1186/1471-2199-9-63) [DOI] [PMC free article] [PubMed] [Google Scholar]
- 48.Luo R, Piovoso MJ, Zurakowski R. 2012. Modeling uncertainty in single-copy assays for HIV. J. Clin. Microbiol. 50, 3381–3382 10.1128/JCM.01254-12 (doi:10.1128/JCM.01254-12) [DOI] [PMC free article] [PubMed] [Google Scholar]
- 49.Tobin J. 1958. Estimation of relationships for limited dependent variables. Econometrica 26, 24–36 10.2307/1907382 (doi:10.2307/1907382) [DOI] [Google Scholar]
- 50.Tse E, Anton JJ. 1972. On the identifiability of parameters. IEEE Trans. Autom. Control 17, 637–646 10.1109/TAC.1972.1100091 (doi:10.1109/TAC.1972.1100091) [DOI] [Google Scholar]
- 51.Markowitz M, Louie M, Hurley A, Sun E, Di Mascio M, Perelson AS, Ho DD. 2003. A novel antiviral intervention results in more accurate assessment of human immunodeficiency virus type 1 replication dynamics and T-cell decay in vivo. J. Virol. 77, 5037–5038 10.1128/JVI.77.8.5037-5038.2003 (doi:10.1128/JVI.77.8.5037-5038.2003) [DOI] [PMC free article] [PubMed] [Google Scholar]
- 52.Vonesh EF, Chinchilli VM. 1997. Linear and nonlinear models for the analysis of repeated measurements, vol. 154 Statistics: Textbooks and Monographs New York, NY: Marcel Dekker Inc [Google Scholar]
- 53.Davidian M, Giltinan DM. 1995. Nonlinear models for repeated measurement data, 1st edn Monographs on Statistics & Applied Probability. New York, NY: Chapman and Hall/CRC [Google Scholar]
- 54.Wu H. 2005. Statistical methods for HIV dynamic studies in AIDS clinical trials. Stat. Methods Med. Res. 14, 171–192 10.1191/0962280205sm390oa (doi:10.1191/0962280205sm390oa) [DOI] [PubMed] [Google Scholar]
- 55.Bortz D. 2006. Model selection and mixed-effects modeling of HIV infection dynamics. Bull. Math. Biol. 68, 2005–2025 10.1007/s11538-006-9084-x (doi:10.1007/s11538-006-9084-x) [DOI] [PubMed] [Google Scholar]
- 56.Wu L, Wu H. 2002. Missing time-dependent covariates in human immunodeficiency virus dynamic models. J. R. Stat. Soc. Ser. C 51, 297–318 10.1111/1467-9876.00270 (doi:10.1111/1467-9876.00270) [DOI] [Google Scholar]
- 57.Huang Y, Wu H, Acosta EP. 2010. Hierarchical Bayesian inference for HIV dynamic differential equation models incorporating multiple treatment factors. Biomet. J. 52, 470–486 10.1002/bimj.200900173 (doi:10.1002/bimj.200900173) [DOI] [PMC free article] [PubMed] [Google Scholar]
- 58.Samson A, Lavielle M, Mentr F. 2006. Extension of the SAEM algorithm to left-censored data in nonlinear mixed-effects model: application to HIV dynamics model. Comput. Stat. Data Anal. 51, 1562–1574 10.1016/j.csda.2006.05.007 (doi:10.1016/j.csda.2006.05.007) [DOI] [Google Scholar]
- 59.Wu H, Zhao C, Liang H. 2004. Comparison of linear, nonlinear and semiparametric mixed-effects models for estimating HIV dynamic parameters. Biomet. J. 46, 233–245 10.1002/bimj.200310019 (doi:10.1002/bimj.200310019) [DOI] [Google Scholar]
- 60.Putter H, Heisterkamp SH, Lange JMA, de Wolf F. 2002. A Bayesian approach to parameter estimation in HIV dynamical models. Stat. Med. 21, 2199–2214 10.1002/sim.1211 (doi:10.1002/sim.1211) [DOI] [PubMed] [Google Scholar]
- 61.Luo R, Piovoso MJ, Martinez-Picado J, Zurakowski R. 2012. HIV model parameter estimates from interruption trial data including drug efficacy and reservoir dynamics. PLoS ONE 7, e40198. 10.1371/journal.pone.0040198 (doi:10.1371/journal.pone.0040198) [DOI] [PMC free article] [PubMed] [Google Scholar]
- 62.Han C, Chaloner K, Perelson A. 2002. Bayesian analysis of a population HIV dynamic model. In Case studies in Bayesian statistics (eds Gatsonis C, et al.), pp. 223–237 New York, NY: Springer [Google Scholar]
- 63.Friedrich B, Li G, Dziuba N, Ferguson MR. 2010. Quantitative PCR used to assess HIV-1 integration and 2-LTR circle formation in human macrophages, peripheral blood lymphocytes and a CD4+ cell line. Virol. J. 7, 354. 10.1186/1743-422X-7-354 (doi:10.1186/1743-422X-7-354) [DOI] [PMC free article] [PubMed] [Google Scholar]
- 64.Reigadas S, Andréola ML, Wittkop L, Cosnefroy O, Anies G, Recordon-Pinson P, Thiebaut R, Masquelier B, Fleury H. 2010. Evolution of 2-long terminal repeat (2-LTR) episomal HIV-1 DNA in raltegravir-treated patients and in in vitro infected cells. J. Antimicrob. Chemother. 65, 434–437 10.1093/jac/dkp473 (doi:10.1093/jac/dkp473) [DOI] [PubMed] [Google Scholar]
- 65.DiStefano JI, Cobelli C. 1980. On parameter and structural identifiability: nonunique observability/reconstructibility for identifiable systems, other ambiguities, and new definitions. IEEE Trans. Autom. Control 25, 830–833 10.1109/TAC.1980.1102439 (doi:10.1109/TAC.1980.1102439) [DOI] [Google Scholar]
- 66.Miao H, Dykes C, Demeter L, Wu H. 2009. Differential equation modeling of HIV viral fitness experiments: model identification, model selection, and multimodel inference. Biometrics 65, 292–300 10.1111/j.1541-0420.2008.01059.x (doi:10.1111/j.1541-0420.2008.01059.x) [DOI] [PMC free article] [PubMed] [Google Scholar]
- 67.Wu H, Zhu H, Miao H, Perelson AS. 2008. Parameter identifiability and estimation of HIV/AIDS dynamic models. Bull. Math. Biol. 70, 785–799 10.1007/s11538-007-9279-9 (doi:10.1007/s11538-007-9279-9) [DOI] [PubMed] [Google Scholar]
- 68.Miao H, Xia X, Perelson AS, Wu H. 2011. On identifiability of nonlinear ODE models and applications in viral dynamics. SIAM Rev. 53, 3–39 10.1137/090757009 (doi:10.1137/090757009) [DOI] [PMC free article] [PubMed] [Google Scholar]
- 69.Besson GJ, McMahon D, Maldarelli F, Mellors JW. 2012. Short-course raltegravir intensification does not increase 2 long terminal repeat episomal HIV-1 DNA in patients on effective antiretroviral therapy. Clin. Infect. Dis. 54, 451–453 10.1093/cid/cir721 (doi:10.1093/cid/cir721) [DOI] [PMC free article] [PubMed] [Google Scholar]
- 70.Wong JK, Ignacio CC, Torriani F, Havlir D, Fitch NJ, Richman DD. 1997. In vivo compartmentalization of human immunodeficiency virus: evidence from the examination of pol sequences from autopsy tissues. J. Virol. 71, 2059–2071 [DOI] [PMC free article] [PubMed] [Google Scholar]
- 71.Zhu T, Wang N, Carr A, Nam DS, Moor-Jankowski R, Cooper DA, Ho DD. 1996. Genetic characterization of human immunodeficiency virus type 1 in blood and genital secretions: evidence for viral compartmentalization and selection during sexual transmission. J. Virol. 70, 3098–3107 [DOI] [PMC free article] [PubMed] [Google Scholar]
- 72.Yukl SA, et al. 2010. Effect of raltegravir-containing intensification on HIV burden and T-cell activation in multiple gut sites of HIV-positive adults on suppressive antiretroviral therapy. AIDS 24, 2451–2460 10.1097/QAD.0b013e32833ef7bb (doi:10.1097/QAD.0b013e32833ef7bb) [DOI] [PMC free article] [PubMed] [Google Scholar]
- 73.Buzón MJ, et al. 2011. Deep molecular characterization of HIV-1 dynamics under suppressive HAART. PLoS Pathogens 7, e1002314. 10.1371/journal.ppat.1002314 (doi:10.1371/journal.ppat.1002314) [DOI] [PMC free article] [PubMed] [Google Scholar]