

Abstract
Circadian clocks are internal timekeepers present in almost all organisms. Driven by a genetic network of highly conserved structure, they generate self-sustained oscillations that entrain to periodic external signals such as the 24 h light–dark cycle. Vertebrates possess multiple, functionally overlapping homologues of the core clock genes. Furthermore, vertebrate clocks entrain to a range of periods three times as narrow as that of other organisms. We asked whether genetic redundancies play a role in governing entrainment properties and analysed locomotor activity rhythms of genetically modified mice lacking one set of clock homologues. Exposing them to non-24 h light–dark cycles, we found that the mutant mice have a wider entrainment range than the wild types. Spectral analysis furthermore revealed nonlinear phenomena of periodically forced self-sustained oscillators for which the entrainment range relates inversely to oscillator amplitude. Using the forced oscillator model to explain the observed differences in entrainment range between mutant and wild-type mice, we sought to quantify the overall oscillator amplitude of their clocks from the activity rhythms and found that mutant mice have weaker circadian clocks than wild types. Our results suggest that genetic redundancy strengthens the circadian clock leading to a narrow entrainment range in vertebrates.
Keywords: circadian rhythm, actogram, amplitude, oscillator theory, time-series analysis
1. Introduction
Circadian clocks are internal timing systems that enable organisms to adjust their behavioural and physiological rhythms to the daily changes of their environment. These clocks generate self-sustained oscillations at the cellular, tissue and behavioural level. As a result, the behavioural and physiological rhythms of the organism follow a periodic temporal pattern manifesting itself, for example, in the sleep–wake cycle. These rhythms persist in the absence of external signals, maintaining a so-called free-running period (FRP) but losing synchrony with the environmental day–night cycle. Certain oscillating environmental cues, for example sunlight, allow circadian clocks to adjust their intrinsic rhythm to the Earth's 24 h rotation. Such signals capable of entraining the clock are called zeitgebers.
Circadian clocks provide selective advantages [1,2] and are correspondingly found in all organisms [3]. Despite differences in the details of biological implementation, common principles across clocks from different taxa follow the requirements of oscillatory function [4]. The rhythm-generating mechanism is based on a gene expression network with a delayed negative feedback loop that causes the transcripts to oscillate with a period of approximately 24 h. While the identity of genetic players differs across phyla, the roles themselves are conserved: positive elements (activators) and negative elements (repressors), often formed by two components that exert their function upon dimerization [5–7]. While Drosophila and other well-studied invertebrates operate with only one set of core clock genes, duplication events in an ancestral chordate led to clock gene multiplicity in vertebrates [1,8–13]. In mammals, three Per (period) and two Cry (cryptochrome) genes are considered core clock components along with Bmal1 and Clock and their paralogues Bmal2 and Npas2. The transcription of these Per and Cry genes is activated by the BMAL1 : CLOCK protein complex which, in turn, is inhibited by PER : CRY heterodimers [14]. While redundant genes form an evolutionary resource for functional divergence and/or acquiring tissue specificity—processes accompanying and facilitating the complexification of body plans and structures—many of the clock homologues seem to have maintained a large functional overlap [15]. Ongoing research aims to improve our understanding of these redundancies using a variety of approaches [16–21]. In particular, the role of the homologues Per1 and Per2 and their dimerization partners Cry1 and Cry2 has yet to be clarified (in mice, Per3 is considered to play a minor role [22,23]). Molecular studies have established that duplications of the Per and Cry genes render mammalian clocks more robust against effects of genetic damage to single elements [11,18]—in line with the concept of a buffering capacity of redundancy [24]. In complex and hierarchical circadian systems, where oscillatory cells are coupled into clock tissues interacting with each other to govern organism-level rhythms, small differences at the gene-level may furthermore result in the emergence of new clock properties. At the behavioural-level, analysing the locomotor activity rhythms of mutant rodents has been a long-established method for studying the function of different clock genes [23]. Loss of core clock genes generally leads to severe impairments of the rhythm-generating mechanism resulting in the failure to entrain to light–dark cycles or to maintain stable rhythmicity in the absence of zeitgebers. Double mutants lacking the gene combinations Per1/Cry1 or Per2/Cry2 have been found to exhibit a rhythmic phenotype hardly distinguishable from the wild-type (WT), whereas, intriguingly, any other combination of these mutations (Cry1/Per2, Cry2/Per1 and triple mutants) as well as just Per2 loss leads to arrhythmicity in constant darkness [23,25–27]. To detect the organism-level effect of duplicate clock genes, we compare the activity rhythms of Per1/Cry1 and Per2/Cry2 mutant mice to the WTs under more challenging conditions. Exposure to extremely long and short zeitgeber cycles reveals the limits of entrainment and induces complex activity rhythms where differences between mutants and WTs may become apparent allowing us to infer on alterations of clock properties owing to homologue loss.
1.1. The entrainment range
Even though zeitgebers on the Earth generally oscillate with a 24 h period, circadian clocks can entrain to a range of different periods. Entrainability of circadian clocks is conserved across the phylogenetic tree from the oldest prokaryotes to mammals, but the range of entrainment varies across species. The entrainment range is related to other parameters of clock systems: a wider entrainment range typically correlates with higher sensitivity to daily variations in zeitgeber patterns (large-amplitude phase–response curves) [28]. Selective pressure according to a trade-off between robustness and sensitivity may therefore shape entrainment range variations across species. In 1978, experimental results on the entrainment of different organisms across the phylogenetic tree were summarized and compared by Aschoff & Pohl [28]. They noted a difference between vertebrates and invertebrates: the measured range of zeitgeber periods to which the circadian clock entrained was much narrower in mammals and birds than in unicellular organisms, insects or plants. This trend is paralleled by the appearance of clock gene homologues in the phylogenetic tree suggesting that component multiplicity plays a role in the fine-tuning of entrainment behaviour. We investigate the effect of multiple redundant homologues on the entrainment range within one species by genetically disabling one set of the Per and Cry genes in mice.
1.2. The periodically forced oscillator
A detailed theoretical framework exists on the synchronization of self-sustained oscillations to periodic external driving [29–31]. A self-sustained oscillator keeps a stable period τ and a stable amplitude a over time without damping or requiring external driving. It is intrinsically rhythmic and responds to influence from other oscillations by adjusting its period. We model the circadian clock as a self-sustained oscillator receiving external periodic forcing with period T and amplitude A. Whether the oscillator synchronizes to the forcing or not depends on the difference between the periods τ and T and the ratio of the amplitudes a and A. The larger the difference between forcing period and intrinsic oscillator period, the larger the required amplitude ratio to achieve entrainment. A weak oscillator with a small intrinsic amplitude a relative to A will easily adopt a wide range of driving rhythms but a strong oscillator synchronizes only to a narrow band of periods around its natural period τ. In a state diagram spanned by the amplitude ratio A/a and the period ratio T/τ, entrainment thus occurs within a triangular region known as the Arnold tongue. The borders of this zone are formed by the points at which synchrony between oscillator and forcing breaks down and a variety of complex rhythms occur outside the tongue-shaped synchronization region. Figure 1 shows a schematic state diagram of self-sustained oscillators. Arnold tongues of circadian clock models such as the Poincaré or the Gonze oscillator [32] can be found in references [30,33] and [34], respectively. Some of the desynchronized oscillatory dynamics illustrated in figure 1 have been observed in a variety of organisms under the respective conditions [35]. Activity patterns termed relative coordination [36], frequency demultiplication [37] or certain types of arrhythmia may be associated with specific regions in the Arnold tongue diagram. We expect to see such phenomena in the mouse activity rhythms recorded in light–dark cycles strongly deviating from 24 h. Furthermore, the forced oscillator model suggests that entrainment behaviour is governed by two characteristics of the clock, the FRP τ and a parameter corresponding to the oscillator amplitude a. While the FRP τ is easily accessed from activity rhythms in constant darkness, quantifying an organism-level oscillator amplitude a from experimental data remained challenging in the face of the clock's complexity and different attempts were made [38–40]. Compliant with the prediction for the influence of the forcing amplitude A, it has been shown that the range of entrainment increases with zeitgeber strength (e.g. light intensity) [41]. We propose that differences in the entrainment ranges of individuals under constant A reflect differences in a property corresponding to the oscillator amplitude parameter a. In the remainder of the paper, we will refer to this parameter as the intrinsic rhythmicity strength of a circadian clock. We extracted a number of quantities that reflect different aspects of intrinsic rhythmicity strength from the locomotor activity records of our mutant and WT mice using only the measurements taken in constant darkness and in a 24 h light–dark cycle. We calculated, for both conditions and for each mouse, the signal-to-noise ratios (SNRs), statistics of timing and intensity of daily activity onset and offset, the significance of the circadian spectral peak and ratios of average activity during the night and during the day. Finally, we tested the consistency of our oscillator theory-based approach by analysing the relations between entrainment behaviour and the obtained parameters τ and a: a strong clock is predicted to entrain less to periods far away from its FRP than a weak clock. We hypothesize—in compliance with trends across taxa—that loss of clock gene homologues decreases intrinsic rhythmicity strength and results in a wider entrainment range.
Figure 1.

Arnold tongue state diagram and corresponding rhythmic regions. (a) Synchronization (1 : 1 entrainment): if the zeitgeber period is close to the oscillator period and the amplitude of the zeitgeber is much larger than the amplitude of the oscillator, then the period of the circadian oscillator locks to the period of the zeitgeber. This is the physiological state of the circadian system. (b) Quasiperiodicity (relative coordination): a larger difference and an incommensurate ratio of zeitgeber period and intrinsic clock period and weak forcing strength may land the circadian system in one of the quasiperiodic regimes: the complex rhythms associated with this region contain two oscillatory components. (c) Higher-order resonances (p : q entrainment, frequency demultiplication): if the ratio of zeitgeber period and clock period are close to a rational number (a commensurate period ratio) higher-order resonances may appear where p cycles of the zeitgeber coincide with q cycles of the clock. The activity patterns look similar to the quasiperiodic rhythms, but spectral analyses may discriminate between the two cases. (d) Deterministic chaos: when forced with a sufficiently large amplitude, self-sustained oscillators may exhibit chaotic dynamics. The transition to deterministic chaos is often characterized by period-doubling in the rhythm and thus by increased power spectral density at subharmonic frequencies of the forcing frequency.
2. Results
We recorded locomotor activity rhythms from 12 clock gene mutant mice (six Per1/Cry1, six Per2/Cry2) and 12 WT mice in natural conditions using a symmetric 24 h light–dark cycle (LD 12 : 12), in free-running conditions (constant darkness, DD) and in desynchronizing conditions applying zeitgeber periods deviating from 24 h (LD 8 : 8, LD 10 : 10, LD 14 : 14, LD 16 : 16). Measurements were performed continuously over three months with episodes of 10–30 days in the different lighting conditions (figure 2).
Figure 2.

Representative actograms and spectra for large-amplitude wild-type and low-amplitude Per2/Cry2 and Per1/Cry1 deficient mice. Note the entrainability of the mutants: dominant spectral peaks correspond to respective zeitgeber periods with harmonics. LD, light–dark, DD, constant darkness. Bold lines mark changes in lighting conditions between DD and different LD schedules. (Online version in colour.)
2.1. Wild-types feature a stronger intrinsic circadian rhythmicity than mutants
All mice exhibit free-running rhythmicity in constant darkness and entrain to a 24 h light–dark cycle. We find a significantly lower FRP for the Per1/Cry1 mutants compared with the Per2/Cry2 group (MP1C1 = 22.4, SDP1C1 = 0.3, MP2C2 = 23.6, SDP2C2 = 0.5, t10 = 5.2, p < 0.001), where periods are slightly larger than in the WTs (MWT = 23.5, SDWT = 0.1) in good agreement with previous results [25,27]. From the activity timeseries recorded in physiological lighting conditions and constant darkness, we extracted a number of different measures of intrinsic circadian rhythmicity strength for each mouse. We obtained SNRs and statistics of timing and intensity of daily activity onset and offset [27,38,40] and computed the statistical significance of the circadian oscillation in the activity rhythm that indicates how strongly the circadian component deviates in amplitude from the other frequencies in the signal [42]. Additionally, we computed the ratio of average activity during the night (active phase) over the day (rest phase). A detailed description of the different techniques is given in §5. First, the two groups of mutants achieve very similar estimates of circadian rhythmicity strength except for the accuracy of activity onset in LD 12 : 12 where the difference is due to an unrelated albeit interesting phenomenon: a majority of the Per1/Cry1 mutant mice fail to entrain to 24 h during the second measurement at the end of the three-month experiment, although still maintaining strong free-running rhythmicity (table 1). Testing for differences in rhythmicity strength between WTs and mutants taking the two groups together reveals on the other hand a clear tendency of WTs to have stronger clocks (table 2). Thirteen of 14 estimates of the circadian amplitude indicate stronger intrinsic rhythmicity for WTs. In four of these, the difference is statistically significant with p-values = 0.02, 0.03, 0.04, 0.04 and marginally significant in another four (p-values = 0.05, 0.05, 0.06, 0.08). We calculated the correlation coefficients between these amplitude estimates (see the electronic supplementary material, table S1) and selected four highly correlated metrics that discriminate successfully between mutants and WTs and used their weighted average as a noise-reduced estimate of intrinsic rhythmicity strength for further analyses,
where a1 and a2 are the activity onset and offset intensities in LD 12 : 12, respectively, and a3 and a4 are the onset and offset intensities in DD. The σi are the corresponding standard deviations. We normalized a to its maximum. Figure 3 shows the histograms of this amplitude estimate for mutants and WTs. We hope that our results on the different estimates of intrinsic rhythmicity obtained with 23 mice and three genotypes will contribute to improve the methods for quantifying circadian amplitudes from locomotor activity data and will be validated on larger samples.
Table 1.
Summary of two-sided t-test results for the different measures of circadian rhythmicity between Per1/Cry1 and Per2/Cry2 mutant mice. Significant values are marked in italics. LD, light–dark cycle; DD, constant darkness; SNR, signal-to-noise ratio.
| quantity | t-statistic LD 12 : 12 | p-value LD 12 : 12 | t-statistic DD | p-value DD |
|---|---|---|---|---|
| SNR | 1.3876 | 0.1954 | 0.2032 | 0.8431 |
| onset intensity | 0.1882 | 0.8545 | 0.6315 | 0.5419 |
| offset intensity | 0.3127 | 0.7610 | 0.6413 | 0.5358 |
| onset accuracy | 2.2323 | 0.0496 | 0.7703 | 0.4589 |
| offset accuracy | −0.6791 | 0.5125 | 1.4098 | 0.1889 |
| (1 − pcirc) | 0.1055 | 0.9181 | −0.0233 | 0.9819 |
| night/day activity ratio | 1.1386 | 0.2814 | −1.4463 | 0.1787 |
Table 2.
Summary of two-sided t-test results for the different measures of circadian rhythmicity between mutant and wild-type mice. Significant values are marked in italics. LD, light–dark cycle; DD, constant darkness; SNR, signal-to-noise ratio.
| quantity | t-statistic LD 12 : 12 | p-value LD 12 : 12 | t-statistic DD | p-value DD |
|---|---|---|---|---|
| SNR | 1.8097 | 0.0847 | 0.5734 | 0.5725 |
| onset intensity | 2.1496 | 0.0434 | 1.9847 | 0.0604 |
| offset intensity | 2.2272 | 0.0370 | 2.0595 | 0.0521 |
| onset accuracy | 0.4896 | 0.6295 | 2.3511 | 0.0286 |
| offset accuracy | 2.0526 | 0.0528 | 0.0949 | 0.9253 |
| (1 − pcirc) | 1.6327 | 0.1174 | 2.4565 | 0.0228 |
| night/day activity ratio | 1.1384 | 0.2678 | −1.0529 | 0.3044 |
Figure 3.
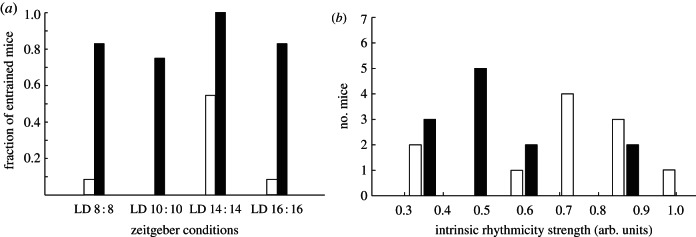
Wild types (white bars, n = 11) have a stronger intrinsic circadian rhythmicity than mutants (black bars, n = 12) and resist entrainment. (a) Fraction of wild-type versus mutant mice exhibiting entrained rhythms in the four extreme zeitgeber experiments. LD, light–dark. (b) Histogram of the intrinsic rhythmicity strength estimate a; the difference between mutants and wild types is significant: t21 = 2.14, p = 0.04.
2.2. Mutants entrain more readily to extreme light–dark cycles than wild types
We observe that WT mice tend to desynchronize from zeitgeber cycles T = 16, 20, 28 and 32 h, whereas all Per1/Cry1 and Per2/Cry2 mutants entrain to a 28 h light–dark cycle with the majority of the mutants entraining to T = 16 and 32 h. In total, the ratio of entrained to non-entrained patterns amounts to 40 : 7 for mutant mice and 8 : 35 for WTs (table 3 and figure 3a). Activity rhythms desynchronized from the zeitgeber are marked by two dominant oscillatory components where one corresponds to the zeitgeber period and the other is close to the animals' FRP (see figure 2 and table 4 for a detailed list of criteria used to classify activity rhythms). We predominantly encountered quasiperiodic patterns in the case of non-entrainment; there are, however, some interesting exceptions (figure 5). In the 20 h zeitgeber cycle, most WTs exhibit rhythms resembling 4 : 5 entrainment (20 h falls within the range of entrainment of most mutants; table 3): we observe a shift of the second period from the FRP near 23 h to 25 h, resulting in a commensurate period ratio. Another interesting phenomenon appears in the record of a Per1/Cry1 mouse in LD 8 : 8. While most other Per1/Cry1 mice entrain to the 16 h light–dark cycle, this animal features an additional double-period component at 32 h along with a rather irregular activity pattern. Such period-doubling phenomena typically indicate the proximity of chaotic dynamics [43].
Table 3.
Activity rhythms under desynchronizing zeitgeber conditions. Wild types tend to exhibit quasiperiodicity or higher order resonances, whereas mutant mice entrain much more easily. LD, light–dark cycle; WT, wild-type; P1C1, Per1/Cry1; P2C2, Per2/Cry2 double mutant; FRP, free-running period; PD, period-doubling.
| mouse ID | LD 16 : 16 | LD 14 : 14 | LD 10 : 10 | LD 8 : 8 |
|---|---|---|---|---|
| WT 2684 | quasiperiodic | quasiperiodic | 4 : 5 resonant | quasiperiodic |
| WT 2683 | quasiperiodic | entrained | 4 : 5 resonant | quasiperiodic |
| WT 1197 | entrained | entrained | 4 : 5 resonant | quasiperiodic |
| WT 1196 | quasiperiodic | quasiperiodic | 4 : 5 resonant | quasiperiodic |
| WT 1195 | quasiperiodic | quasiperiodic | free-running | quasiperiodic |
| WT 1194 | quasiperiodic | entrained | quasiperiodic | quasiperiodic |
| WT 1065 | quasiperiodic | entrained | 4 : 5 resonant | quasiperiodic |
| WT 1064 | quasiperiodic | entrained | 4 : 5 resonant | quasiperiodic |
| WT 1063 | quasiperiodic | quasiperiodic | 4 : 5 resonant | quasiperiodic |
| WT 810 | quasiperiodic | quasiperiodic | 4 : 5 resonant | 2 : 3 resonant |
| WT 809 | quasiperiodic | entrained | 4 : 5 resonant | entrained |
| P2C2 2471 | entrained | entrained | entrained | entrained (small FRP) |
| P2C2 2470 | entrained | entrained | entrained | entrained |
| P2C2 2101 | entrained (small FRP) | entrained | entrained | entrained (small FRP) |
| P2C2 2100 | entrained | entrained | entrained | entrained (small FRP) |
| P2C2 2048 | quasiperiodic | entrained | entrained | quasiperiodic |
| P2C2 2047 | entrained | entrained | entrained | entrained |
| P1C1 2841 | entrained | entrained | entrained | entrained |
| P1C1 2840 | entrained | entrained | quasiperiodic | entrained |
| P1C1 2839 | entrained | entrained | entrained | entrained (PD) |
| P1C1 2070 | entrained | entrained | quasiperiodic | entrained |
| P1C1 2069 | entrained | entrained | entrained | entrained |
| P1C1 2066 | quasiperiodic | entrained | quasiperiodic | quasiperiodic |
Table 4.
Criteria for the classification of activity rhythms under desynchronizing lighting conditions.
| rhythm | Fourier spectrum | actogram | spectrogram |
|---|---|---|---|
| 1 : 1 entrained | significant peak at the zeitgeber frequency f1 and its harmonics | alignment of activity onset and offset times with light on and light off times | — |
| quasiperiodic | significant peaks at incommensurate frequencies f1, f2 and their harmonics where f1 is the zeitgeber frequency and f2 is close to or equal to the free-running frequency | two rhythmic components distinguishable: activity onset times align with light on and light off times and along a second line corresponding to the phase shift between the two rhythmic components | transient peak dynamics: f2 component branches off |
| p : q entrained | significant peaks at commensurate frequencies f1, f2 and their harmonics | two rhythmic components distinguishable: activity onset times align with light on and light off times and along a second line corresponding to the phase shift between the two rhythmic components | peak at f2 appears instantaneously |
Figure 5.

Predicted nonlinear phenomena in the mouse activity rhythms: period-doubling (a) for T = 16 h in a Per1/Cry1 mouse, quasiperiodicity (b) and higher order resonances (c) for two wild types at T = 20 h. Free-running rhythms (black dashed lines) are included in (b) and (c) to illustrate the frequency pulling in 4 : 5 entrainment. See also table 4.
2.3. Mice with a weak clock exhibit a wider range of entrainment than mice with strong clocks
Forced oscillator theory predicts that the range of entrainment increases with the ratio of the forcing amplitude to the oscillator amplitude. To investigate whether the relation between our estimate of intrinsic rhythmicity strength and the entrainment range of the respective mice is consistent with theoretical prediction, we inspected the distribution of entrained activity patterns for each episode and each mouse over the ratio of zeitgeber period to FRP.
By locating the activity patterns of all episodes and all mice in the plane spanned by the amplitude ratio (1/a, because the lighting strength A was kept constant in all experiments) and the period ratio (T/τ), we observe a triangular region of entrainment consistent with theory (figure 4). Note that in this plot five data points from the different episodes belong to one mouse. Two WT mice, although exhibiting the typical narrow entrainment range, obtained very small amplitude scores and are therefore responsible for 10 ‘outliers’ in the upper region of the diagram. Because the entrainment behaviour of these mice is consistent with the prediction for WTs, these data points probably represent artefacts from the amplitude estimation method.
Figure 4.

The predicted 1 : 1 Arnold tongue (a) is roughly traced out by the mouse activity patterns (b). Quadrants with 50% or more entrained patterns are shaded. Wild types (white) are mostly found in the high-amplitude region in the lower half of the triangle, whereas mutants (black) are more frequent in the upper half.
3. Discussion
3.1. Homologues strengthen the clock and decrease entrainability
To investigate a systematic effect of multiple clock gene homologues on the phenotype, we compared the locomotor activity rhythms of Per1/Cry1 and Per2/Cry2 mutant mice and WTs. We combined the characterization of entrainment behaviour using desynchronizing light–dark protocols with the quantification of an organism-level circadian amplitude from measurements in constant darkness and in 24 h light–dark cycles. We found that
— both groups of mutants are readily entrained to extreme zeitgeber periods, whereas WTs tend to exhibit quasiperiodic rhythms: WTs have a narrower range of entrainment than mutants;
— both groups of mutants are equally lower in intrinsic rhythmicity strength than WTs.
The entrainment range increases with decreasing rhythmicity strength consistent with forced oscillator theory that predicts a triangular region of entrainment, where stronger oscillator amplitudes result in narrower entrainment ranges (figures 1 and 4). In the non-entrained mouse activity patterns outside the synchronization region, we identified quasiperiodicity, higher order resonances and indications of deterministic chaos (period-doubling). Quasiperiodicity in motor activity of rodents has been previously reported [44] and explained in terms of oscillator theory [45]. Period-doubling of the sleep–wake cycle is predicted for large values of the amplitude ratio of zeitgeber over circadian oscillator A/a and was indeed reported in humans after exposure to very bright light (increased zeitgeber amplitude A) [46]. We observed a double-period rhythm in a Per1/Cry1 mutant mouse whose small intrinsic oscillator amplitude a may have resulted in a large value for A/a driving the circadian clock close to a transition to chaotic behaviour.
All mutants displayed clear free-running rhythms in constant darkness and were in most cases entrainable to zeitgeber periods ranging from 16 to 32 h. In agreement with previous findings [25], we measured a shorter FRP in the Per1/Cry1 mutants (22.4 ± 0.3 h) than in the Per2/Cry2 mice (23.6 ± 0.5 h). Consequently, the Per1/Cry1 mice entrain better to the short 16 h light–dark cycle (table 3). With respect to intrinsic rhythmicity strength, however, both groups of mutants are remarkably similar (table 1). Their scores differ significantly for only one estimate of clock strength: the activity onset accuracy in LD 12 : 12 where a potentially age-related entrainment failure in the Per1/Cry1 animals towards the end of the experiment led to unusually low values. In comparing the full mutant group with the WT mice, our analyses show that WTs tend to have stronger clocks than mutants (table 2). Two novel metrics, which we term motor activity onset and offset intensity, were most successful in discriminating between clock mutants and WTs. These metrics capture the quality of match between the locomotor activity time series and a step function template penalizing bursts of activity during the day and resting during the night, thus reflecting the contrast of transition between the active and inactive phases.
The differences between genetically modified mice and WTs are paralleled by trends at the organismic level: insects, unicellular organisms and plants have a distinctly wider range of entrainment than vertebrates. Taken together with these trends across taxa, our results indicate that multiple clock genes result in a stronger circadian oscillator and consequently a narrow entrainment range.
3.1.1. Functional implications of the entrainment range
Before asking how exactly clock gene homologues may influence organism-level rhythmicity strength, we address the functional implications of a narrow versus wide entrainment range from the evolutionary perspective and use respective arguments to speculate on the adaptive significance of clock gene homologues in vertebrates. A narrow entrainment range implies robustness to fluctuations in zeitgeber signals. Self-sustained oscillators responding with large phase responses to forcing signals (possessing large-amplitude phase–response curves) have wide entrainment ranges [47]. Experimental findings on circadian clocks are consistent with such a relation, suggesting that, in general, strong clocks with narrow entrainment ranges respond with smaller advances or delays to zeitgeber stimuli [28,48]. In other words, intrinsic rhythmicity strength may enable robustness against fluctuations in the zeitgeber rhythms while a wide range of entrainment comes with high sensitivity to zeitgeber inputs. The optimal strategy in the trade-off between entrainability and light sensitivity, on the one hand, and robustness and rhythmicity strength, on the other hand, depends on the life cycle and ecology of a species. Seasonal variations in the light–dark patterns, for example, affect only long-lived organisms. Therefore, the single-component Drosophila clock may be advantageous for an organism with a lifespan not exceeding a single season: characterized by a wide entrainment range and exhibiting large-amplitude phase–response behaviour it allows quick adaptation to daily variations in lighting conditions rather than being robust. With these considerations in mind, our results suggest an adaptive function of functionally overlapping clock gene homologues: to maintain a narrow entrainment and thereby achieve rhythms which are robust towards fluctuating input signals in long-lived organisms.
3.1.2. Biological mechanisms
Further studies are needed to dissect the levels at which clock gene homologues exert an effect on rhythmicity strength and the entrainment range. So far, we have treated the complex mammalian clock system as a single oscillator, neglecting the large number of mechanisms that influence overall clock amplitude. In such nonlinear hierarchical systems, new properties may emerge from interactions among subunits. Oscillatory cells in most animals are organized into clock tissues. In mammals, the suprachiasmatic nucleus (SCN) in the brain is the structure directly underlying the behavioural rhythmic phenotype. It consists of a small population of coupled clock neurons eliciting a synchronized electric oscillation that orchestrates rhythms throughout the body. A number of studies have shown that the network properties emerging from intracellular coupling of single clock cells govern the oscillatory features of the SCN as a whole [33]. We discuss two mechanisms to sketch out how SCN network properties may be affected by the loss of homologues, giving rise to changes in rhythmicity strength.
(1) Cells with weak oscillations synchronize more readily and thus give rise to higher SCN amplitudes than strong single-cell oscillators [49]. In Per1/Cry1 and Per2/Cry2 mutants, we expect higher expression levels of the remaining clock genes than in WTs, assuming that the remaining homologue compensates for the loss of the other homologue (see Baggs et al. [22]). Another principle predicting enhanced synchronizability of WT single cells was studied by Hasegawa & Arita [50]. They found that a period mismatch within coupled genetic feedback loops increases the entrainability of the system. Per1/Cry1 and Per2/Cry2 mutants differ significantly in their FRP, indicating that the WT clocks containing all homologues are driven by a genetic loop system with an intrinsic period mismatch. Thus, stronger single-cell oscillations and/or loss of period mismatch within the feedback loop system in mutant SCNs may weaken the oscillation of the synchronized network leading to low-amplitude circadian rhythms at the behavioural level.
(2) Results from fluorescence imaging in mouse brains indicate that Per1 and Per2 expression is not homogeneous across the SCN and the existence of distinct subpopulations of neuronal clocks was proposed [17]. Heterogeneity in single oscillators and their localization within the network may be important for the development of a strong SCN oscillator [49,51], because strong intracellular coupling is required to overcome differences in single-cell periods, for example, to synchronize distinct Per1 and Per2 cells. Loss of heterogeneity in homologue expression thus may affect network connectivity and coupling strength and decrease SCN amplitude in mutants.
4. Conclusions
Vertebrate circadian clocks are driven by multiple homologues of core clock genes. To what extent the mammalian Per1, Per2 and Cry1, Cry2 components play differential roles in clock functioning is unresolved. In general, clock gene multiplicity is regarded as furnishing the clock with robustness against genetic disruption via paralogue compensation mechanisms [18]. Taken together with trends across taxa, our results on mutant mice furthermore suggest that core clock homologues influence robustness against input fluctuations via a systematic effect on the entrainment behaviour. The range of entrainment is, on the one hand, affected by overall strength of circadian rhythmicity and, on the other hand, may experience selective pressure according to the trade-off between robustness and sensitivity towards environmental variations in zeitgeber patterns. Correspondingly, a variety of entrainment ranges can be found in different organisms. Clock gene homologues may play an intricate role in tuning the entrainment range. Our study attempts to unravel such a connection between the genetic and the systems levels by estimating the circadian oscillator amplitude (the intrinsic rhythmicity strength) from locomotor activity rhythms. We found that Per1/Cry1 and Per2/Cry2 mutant mice are more entrainable but have a weaker intrinsic rhythmicity than WTs, as is consistent with predictions from coupled oscillator theory.
5. Methods
5.1. Actograms and spectral analyses
Clock gene mutant mice were generated in the Albrecht laboratory as described in Oster et al. [25], and running-wheel experiments were conducted following the protocols presented in Jud et al. [52]. We exposed 12 WT, six Per1Brdm1/Cry1−/− (P1C1) and six Per2Brdm1/Cry2−/− (P2C2) double-mutant mice to symmetric light–dark cycles ranging from 8 : 8 to 16 : 16 h. Running-wheel revolutions per minute were recorded over 193 days with sampling frequency fs = 1/360 Hz. The lighting protocol was changed every 10–30 days (figure 2). All activity data are available for download from the Dryad Digital Repository (doi:10.5061/dryad.dd65d). We visualized the activity data of each mouse in actograms using the mean value of activity averaged over the full time series as a threshold. To examine stationarity of data segments recorded within the same lighting protocol (referred to as an episode), we applied moving average and moving variance filters and computed spectrograms of the full time series. Spectral analyses were performed using the fast Fourier transform algorithm implemented in Matlab to characterize activity rhythms and determine the FRPs of all mice. We used a Bartlett window to taper the time series. Spectrograms (window size = 10 × 32 h, overlap = 50%) were generated from smoothed time series, where we applied a moving average filter with a 5 h lag. The statistical significance of spectral peaks was determined with the method described in §5.2.3. Individual power spectra of all episodes for all mice were inspected to determine entrainment status. We classified the activity rhythms as 1 : 1 entrained, quasiperiodic or p : q entrained according to the criteria summarized in table 4.
5.2. Quantification of an organism-level circadian amplitude
We quantified the intrinsic clock amplitude for each mouse from time series recorded in constant darkness (DD) and a LD 12 : 12 cycle. To avoid bias from physiological effects of aberrant locomotor activity, data from extreme zeitgeber experiments were not included in the analysis of intrinsic rhythmicity strength. For each mouse, two episodes of each DD and LD 12 : 12 are available. We obtained values for the SNR, accuracy and intensity of activity onset and offset, a new metric for circadian rhythmicity from Leise et al. [42] and the night/day ratio of activity. We analysed each episode for each mouse separately and averaged the values from the two DD and LD 12 : 12 time series such that each mouse was given a DD and an LD score of each quantity. We calculated the Spearman and Pearson correlation coefficients for the obtained set of strength measures (see the electronic supplementary material, table S1).
5.2.1. Signal-to-noise ratio
The SNR, which is defined as the variance of the signal divided by the variance of the noise, has been used previously to estimate the strength of circadian rhythms at the organism level [38]. Here, the signal is given by a harmonic function with fundamental frequency ω corresponding to the circadian component where amplitudes and baseline are fitted to the data and ω is established from Fourier analysis,
The residues between the signal and the raw data are considered the noise.
5.2.2. Onset/offset accuracy and intensity
Statistics of timing and intensity of daily activity onset and offset across the time series may reveal how closely the clock regulates behavioural output and contain information on the precision and power of the clock itself [40,53]. To obtain activity onset and offset times, we applied a technique described in the ClockLab Actimetrics software manual based on a template-matching algorithm. We first transformed the time series into a ±1 sequence using the 20th percentile activity level as a threshold and convoluted the transformed time series with a step function window of specified length (the template). The time points at the maxima of the convolution correspond to activity onset times. Offset times are obtained by reversing the sign of the step function. We used a 24 h template (12 h inactivity followed by 12 h activity), but shorter windows may be used to detect irregular activity times. We define onset/offset accuracy as the reciprocal of the standard deviation of the onset/offset times across the time series.
The values of the convolution at the maxima quantify how well the activity patterns match the template and thus provide information on the level of activity upon waking up and whether the mouse was indeed completely inactive towards the end of the sleeping phase. We averaged the respective convolution maxima over the time series and termed the obtained quantity the onset/offset intensity.
5.2.3. Statistical significance of the circadian peak
Leise et al. [42] introduced a new metric for strength of circadian rhythmicity in single cells based on the statistical significance of the circadian component [42]. To provide a p-value for the significance of a particular spectral peak, the component of interest is removed either in the frequency domain or in the time domain. In the first case, one replaces the amplitude values in the spectrum in a ±5 h region around the peak of interest with the mean value of the remaining amplitude spectrum. Alternatively, Fourier coefficients may be calculated for a time series, where the component of interest has been removed by fitting and subtracting a harmonic function with the respective fundamental frequency. The second technique allows a spectral component to be treated together with its harmonics. In a double logarithmic plot over the frequencies, the Fourier coefficients can be fitted with a straight line,
The slope of the fitted line corresponds to α, according to the type of noise in the system. The residuals are normally distributed, and the spectral component of interest yields a p-value for the peak. The complementary probability (1−p) indicates how strongly the circadian component deviates in amplitude from the other frequencies in the signal and thus quantifies the strength of the circadian rhythmicity.
5.2.4. Night/day activity ratio
To obtain a ratio of average activity during the night (active phase) and the day (rest phase), we first averaged over the activity counts within daytimes and night-times using a window of length 12 h or half of the appropriate FRP for the LD 12 : 12 and DD episodes, respectively. We averaged these daily values for night-time and daytime activity over all days of the time series and took their ratio.
Acknowledgements
We thank A. Kramer, G. Bordyugov, A. Wilkins, S. Sokoloski, E. Herzog and A. Relogio for helpful discussions and feedback on an earlier version of the manuscript. This work was supported by grants from the Swiss National Science Foundation, the European Commission FP5 Programm Braintime, Deutsche Forschungsgemeinschaft (SPP 1395) and the Federal Ministry of Education and Research (BMBF Germany).
References
- 1.Dunlap J. 1999. Molecular bases for circadian clocks. Cell 96, 271–290 10.1016/S0092-8674(00)80566-8 (doi:10.1016/S0092-8674(00)80566-8) [DOI] [PubMed] [Google Scholar]
- 2.Ouyang Y, Andersson CR, Kondo T, Golden SS, Johnson CH. 1998. Resonating circadian clocks enhance fitness in cyanobacteria. Proc. Natl Acad. Sci. USA 95, 8660–8664 10.1073/pnas.95.15.8660 (doi:10.1073/pnas.95.15.8660) [DOI] [PMC free article] [PubMed] [Google Scholar]
- 3.Kay SA. 1997. PAS, present, and future: clues to the origins of circadian clocks. Science 276, 753–754 10.1126/science.276.5313.753 (doi:10.1126/science.276.5313.753) [DOI] [PubMed] [Google Scholar]
- 4.Bell-Pedersen D, Cassone VM, Earnest DJ, Golden SS, Hardin PE, Thomas TL, Zoran MJ. 2005. Circadian rhythms from multiple oscillators: lessons from diverse organisms. Nat. Rev. Genet. 4, 121–130 10.1038/nrd1633 (doi:10.1038/nrd1633) [DOI] [PMC free article] [PubMed] [Google Scholar]
- 5.Albrecht U. 2004. The mammalian circadian clock: a network of gene expression. Front. Biosci. 9, 48–55 10.2741/1196 (doi:10.2741/1196) [DOI] [PubMed] [Google Scholar]
- 6.Relógio A, Westermark PO, Wallach T, Schellenberg K, Kramer A, Herzel H. 2011. Tuning the mammalian circadian clock: robust synergy of two loops. PLoS Comput. Biol. 7, e1002309. 10.1371/journal.pcbi.1002309 (doi:10.1371/journal.pcbi.1002309) [DOI] [PMC free article] [PubMed] [Google Scholar]
- 7.Reppert SM, Weaver DR. 2002. Coordination of circadian timing in mammals. Nature 418, 935–941 10.1038/nature00965 (doi:10.1038/nature00965) [DOI] [PubMed] [Google Scholar]
- 8.François P. 2005. A model for the Neurospora circadian clock. Biophys. J. 88, 2369–2383 10.1529/biophysj.104.053975 (doi:10.1529/biophysj.104.053975) [DOI] [PMC free article] [PubMed] [Google Scholar]
- 9.Loudon ASI, Semikhodskii AG, Crosthwaite SK. 2000. A brief history of circadian time. Trends Genet. 16, 477–481 10.1016/S0168-9525(00)02122-3 (doi:10.1016/S0168-9525(00)02122-3) [DOI] [PubMed] [Google Scholar]
- 10.Cahill GM. 2002. Clock mechanisms in zebrafish. Cell Tissue Res. 309, 27–34 10.1007/s00441-002-0570-7 (doi:10.1007/s00441-002-0570-7) [DOI] [PubMed] [Google Scholar]
- 11.Looby P, Loudon ASI. 2005. Gene duplication and complex circadian clocks in mammals. Trends Genet. 21, 46–53 10.1016/j.tig.2004.11.012 (doi:10.1016/j.tig.2004.11.012) [DOI] [PubMed] [Google Scholar]
- 12.von Schantz M, Jenkins A, Archer SN. 2006. Evolutionary history of the vertebrate period genes. J. Mol. Evol. 62, 701–707 10.1007/s00239-005-0185-1 (doi:10.1007/s00239-005-0185-1) [DOI] [PubMed] [Google Scholar]
- 13.Yoshimura T, Suzuki Y, Makino E, Suzuki T, Kuroiwa A, Matsuda Y, Namikawa T, Ebihara S. 2000. Molecular analysis of avian circadian clock genes. Mol. Brain Res. 78, 207–215 10.1016/S0169-328X(00)00091-7 (doi:10.1016/S0169-328X(00)00091-7) [DOI] [PubMed] [Google Scholar]
- 14.Mohawk JA, Green CB, Takahashi JS. 2012. Central and peripheral circadian clocks in mammals. Annu. Rev. Neurosci. 35, 445–462 10.1146/annurev-neuro-060909-153128 (doi:10.1146/annurev-neuro-060909-153128) [DOI] [PMC free article] [PubMed] [Google Scholar]
- 15.Gibson TJ, Spring J. 1998. Genetic redundancy in vertebrates: polyploidy and persistence of genes encoding multidomain proteins. Trends Genet. 14, 46–49 10.1016/S0168-9525(97)01367-X (doi:10.1016/S0168-9525(97)01367-X) [DOI] [PubMed] [Google Scholar]
- 16.Chen R, Schirmer A, Lee Y, Lee H, Kumar V, Yoo S-H, Takahashi JS, Lee C. 2009. Rhythmic PER abundance defines a critical nodal point for negative feedback within the circadian clock mechanism. Mol. Cell 36, 417–430 10.1016/j.molcel.2009.10.012 (doi:10.1016/j.molcel.2009.10.012) [DOI] [PMC free article] [PubMed] [Google Scholar]
- 17.Cheng H-YM, Alvarez-Saavedra M, Dziema H, Choi YS, Li A, Obrietan K. 2009. Segregation of expression of mPeriod gene homologs in neurons and glia: possible divergent roles of mPeriod1 and mPeriod2 in the brain. Hum. Mol. Genet. 18, 3110–3124 10.1093/hmg/ddp252 (doi:10.1093/hmg/ddp252) [DOI] [PMC free article] [PubMed] [Google Scholar]
- 18.Hogenesch JB, Herzog ED. 2011. Intracellular and intercellular processes determine robustness of the circadian clock. FEBS Lett. 585, 1427–1434 10.1016/j.febslet.2011.04.048 (doi:10.1016/j.febslet.2011.04.048) [DOI] [PMC free article] [PubMed] [Google Scholar]
- 19.Khan SK, Xu H, Ukai-Tadenuma M, Burton B, Wang Y, Ueda HR, Liu AC. 2012. Identification of a novel cryptochrome differentiating domain required for feedback repression in circadian clock function. J. Biol. Chem. 287, 1–20 10.1074/jbc.M112.368001 (doi:10.1074/jbc.M112.368001) [DOI] [PMC free article] [PubMed] [Google Scholar]
- 20.Evans JA, Pan H, Liu AC, Welsh DK. 2012. Cry1-/- circadian rhythmicity depends on SCN intercellular coupling. J. Biol. Rhythms 27, 443–452 10.1177/0748730412461246 (doi:10.1177/0748730412461246) [DOI] [PMC free article] [PubMed] [Google Scholar]
- 21.Hirota T, et al. 2012. Identification of small molecule activators of cryptochrome. Science 337, 1094–1097 10.1126/science.1223710 (doi:10.1126/science.1223710) [DOI] [PMC free article] [PubMed] [Google Scholar]
- 22.Baggs JE, Price TS, DiTacchio L, Panda S, Fitzgerald GA, Hogenesch JB. 2009. Network features of the mammalian circadian clock. PLoS Biol. 7, e52. 10.1371/journal.pbio.1000052 (doi:10.1371/journal.pbio.1000052) [DOI] [PMC free article] [PubMed] [Google Scholar]
- 23.Ripperger JA, Jud C, Albrecht U. 2011. The daily rhythm of mice. FEBS Lett. 585, 1384–1392 10.1016/j.febslet.2011.02.027 (doi:10.1016/j.febslet.2011.02.027) [DOI] [PubMed] [Google Scholar]
- 24.Wilkins A. 1997. Canalization: a molecular genetic perspective. BioEssays 19, 257–262 10.1002/bies.950190312 (doi:10.1002/bies.950190312) [DOI] [PubMed] [Google Scholar]
- 25.Oster H, Yasui A, van der Horst GTJ, Albrecht U. 2002. Disruption of mCry2 restores circadian rhythmicity in mPer2 mutant mice. Genes Dev. 16, 2633–2638 10.1101/gad.233702.GENES (doi:10.1101/gad.233702.GENES) [DOI] [PMC free article] [PubMed] [Google Scholar]
- 26.Oster H, van der Horst GTJ, Albrecht U. 2003. Daily variation of clock output gene activation in behaviourally arrhythmic mPer/mCry triple mutant mice. Chronobiol. Int. 20, 683–695 10.1081/CBI-120022408 (doi:10.1081/CBI-120022408) [DOI] [PubMed] [Google Scholar]
- 27.Oster H, Baeriswyl S, van der Horst GTJ, Albrecht U. 2003. Loss of circadian rhythmicity in aging mPer1-/- mCry2-/- mutant mice. Genes Dev. 17, 1366–1379 10.1101/gad.256103 (doi:10.1101/gad.256103) [DOI] [PMC free article] [PubMed] [Google Scholar]
- 28.Aschoff J, Pohl H. 1978. Phase relations between a circadian rhythm and its zeitgeber within the range of entrainment. Naturwissenschaften 65, 80–84 10.1007/BF00440545 (doi:10.1007/BF00440545) [DOI] [PubMed] [Google Scholar]
- 29.Balanov A, Janson N, Postnov D, Sosnovtseva O. 2009. Synchronization: from simple to complex. New York, NY: Springer [Google Scholar]
- 30.Glass L. 2001. Rhythmic processes in physiology. Nature 410, 277–284 10.1038/35065745 (doi:10.1038/35065745) [DOI] [PubMed] [Google Scholar]
- 31.Pikovsky A, Rosenblum M, Kurths J. 2001. Synchronization: a universal concept in nonlinear sciences. Cambridge, UK: Cambridge University Press [Google Scholar]
- 32.Gonze D, Bernard S, Waltermann C, Kramer A, Herzel H. 2005. Spontaneous synchronization of coupled circadian oscillators. Biophys. J. 89, 120–129 10.1529/biophysj.104.058388 (doi:10.1529/biophysj.104.058388) [DOI] [PMC free article] [PubMed] [Google Scholar]
- 33.Abraham U, Granada AE, Westermark PlO, Heine M, Kramer A, Herzel H. 2010. Coupling governs entrainment range of circadian clocks. Mol. Syst. Biol. 6, 438. 10.1038/msb.2010.92 (doi:10.1038/msb.2010.92) [DOI] [PMC free article] [PubMed] [Google Scholar]
- 34.Granada A, Hennig RM, Ronacher B, Kramer A, Herzel H. 2009. Phase response curves elucidating the dynamics of coupled oscillators, vol. 454 Amsterdam, The Netherlands: Elsevier; [DOI] [PubMed] [Google Scholar]
- 35.Glass L, Mackey M. 1988. From clocks to chaos: the rhythms of life. Princeton, NJ: Princeton University Press [Google Scholar]
- 36.Pittendrigh C, Daan S. 1976. A functional analysis of circadian pacemakers in nocturnal rodents. J. Comp. Physiol. A Neuroethol. Sens. Neural. Behav. Physiol. 106, 291–331 10.1007/BF01417859 (doi:10.1007/BF01417859) [DOI] [Google Scholar]
- 37.Pregueiro AM, Price-Lloyd N, Bell-Pedersen D, Heintzen C, Loros JJ, Dunlap JC. 2005. Assignment of an essential role for the Neurospora frequency gene in circadian entrainment to temperature cycles. Proc. Natl Acad. Sci. USA 102, 2210–2215 10.1073/pnas.0406506102 (doi:10.1073/pnas.0406506102) [DOI] [PMC free article] [PubMed] [Google Scholar]
- 38.Spoelstra K, Daan S. 2008. Effects of constant light on circadian rhythmicity in mice lacking functional cry genes: dissimilar from per mutants. J. Comp. Physiol. A Neuroethol. Sensory, Neural, Behav. Physiol. 194, 235–242 10.1007/s00359-007-0301-3 (doi:10.1007/s00359-007-0301-3) [DOI] [PubMed] [Google Scholar]
- 39.Vitaterna M, Ko C, Chang A, Buhr E, Fruechte E, Schook A, Antoch M, Turek F, Takahashi J. 2006. The mouse clock mutation reduces circadian pacemaker amplitude and enhances efficacy of resetting stimuli and phase response curve amplitude. Proc. Natl Acad. Sci. USA 103, 9327–9332 10.1073/pnas.0603601103 (doi:10.1073/pnas.0603601103) [DOI] [PMC free article] [PubMed] [Google Scholar]
- 40.Sellix MT, Evans JA, Leise TL, Castanon-Cervantes O, Hill DD, Delisser P, Block GD, Menaker M, Davidson AJ. 2012. Aging differentially affects the re-entrainment response of central and peripheral circadian oscillators. J. Neurosci. 32, 16 193–16 202 10.1523/JNEUROSCI.3559-12.2012 (doi:10.1523/JNEUROSCI.3559-12.2012) [DOI] [PMC free article] [PubMed] [Google Scholar]
- 41.Gronfier C, Wright KP, Kronauer RE, Czeisler CA. 2007. Entrainment of the human circadian pacemaker to longer-than-24-h days. Proc. Natl Acad. Sci. USA 104, 9081–9086 10.1073/pnas.0702835104 (doi:10.1073/pnas.0702835104) [DOI] [PMC free article] [PubMed] [Google Scholar]
- 42.Leise TL, Wang CW, Gitis PJ, Welsh DK. 2012. Persistent cell-autonomous circadian oscillations in fibroblasts revealed by six-week single-cell imaging of PER2 :: LUC bioluminescence. PLoS ONE 7, e33334. 10.1371/journal.pone.0033334 (doi:10.1371/journal.pone.0033334) [DOI] [PMC free article] [PubMed] [Google Scholar]
- 43.Goldbeter A, Gonze D, Houart G, Leloup J-C, Halloy J, Dupont G. 2001. From simple to complex oscillatory behavior in metabolic and genetic control networks. Chaos (Woodbury, N.Y.) 11, 247–260 10.1063/1.1345727 (doi:10.1063/1.1345727) [DOI] [PubMed] [Google Scholar]
- 44.Campuzano A, Vilaplana J, Cambras T, Díez-Noguera A. 1998. Dissociation of the rat motor activity rhythm under T cycles shorter than 24 hours. Physiol. Behav. 63, 171–176 10.1016/S0031-9384(97)00416-2 (doi:10.1016/S0031-9384(97)00416-2) [DOI] [PubMed] [Google Scholar]
- 45.Granada AE, Cambras T, Diez-Noguera A, Herzel H. 2010. Circadian desynchronization. J. R. Soc. Interface Focus 1, 153–166 10.1098/rsfs.2010.0002 (doi:10.1098/rsfs.2010.0002) [DOI] [PMC free article] [PubMed] [Google Scholar]
- 46.Honma K, Honma S. 1988. Circabidian rhythm: its appearance and disappearance in association with a bright light pulse. Cell. Mol. Life Sci. 44, 981–983 10.1007/BF01939893 (doi:10.1007/BF01939893) [DOI] [PubMed] [Google Scholar]
- 47.Granada AE, Bordyugov G, Kramer A, Herzel H. 2013. Human chronotypes from a theoretical perspective. PLoS ONE 8, e59464. 10.1371/journal.pone.0059464 (doi:10.1371/journal.pone.0059464) [DOI] [PMC free article] [PubMed] [Google Scholar]
- 48.Brown SA, Kunz D, Dumas A, Westermark PO, Vanselow K, Tilmann-Wahnschaffe A, Herzel H, Kramer A. 2008. Molecular insights into human daily behavior. Proc. Natl Acad. Sci. USA 105, 1602–1607 10.1073/pnas.0707772105 (doi:10.1073/pnas.0707772105) [DOI] [PMC free article] [PubMed] [Google Scholar]
- 49.Webb AB, Taylor SR, Thoroughman KA, Doyle FJ, Herzog ED. 2012. Weakly circadian cells improve resynchrony. PLoS Comput. Biol. 8, e1002787. 10.1371/journal.pcbi.1002787 (doi:10.1371/journal.pcbi.1002787) [DOI] [PMC free article] [PubMed] [Google Scholar]
- 50.Hasegawa Y, Arita M. 2013. Enhanced entrainability of genetic oscillators by period mismatch. J. R. Soc. Interface 10, 1–12 10.1098/rsif.2012.1020 (doi:10.1098/rsif.2012.1020) [DOI] [PMC free article] [PubMed] [Google Scholar]
- 51.Bernard S, Gonze D, Cajavec B, Herzel H, Kramer A. 2007. Synchronization-induced rhythmicity of circadian oscillators in the suprachiasmatic nucleus. PLoS Comput. Biol. 3, e68. 10.1371/journal.pcbi.0030068 (doi:10.1371/journal.pcbi.0030068) [DOI] [PMC free article] [PubMed] [Google Scholar]
- 52.Jud C, Schmutz I, Hampp G, Oster H. 2005. A guideline for analyzing circadian wheel-running behavior in rodents under different lighting conditions. Biol. Proced. 7, 101–116 10.1251/bpo109 (doi:10.1251/bpo109) [DOI] [PMC free article] [PubMed] [Google Scholar]
- 53.Bode B, Shahmoradi A, Rossner MJ, Oster H. 2011. Genetic interaction of Per1 and Dec1/2 in the regulation of circadian locomotor activity. J. Biol. Rhythms 26, 530–540 10.1177/0748730411419782 (doi:10.1177/0748730411419782) [DOI] [PubMed] [Google Scholar]