

Abstract
The goal of this study was to examine the relationships between 2 age-sensitive indices of brain integrity—volume and iron concentration—and the associated age differences in memory performance. In 113 healthy adults (age 19–83 years), we measured the volume and estimated iron concentration in the hippocampus (HC), caudate nucleus (Cd), and primary visual cortex (VC) in vivo with T2* relaxation times, and assessed memory performance with multiple tests. We applied structural equation modeling to evaluate the contribution of individual differences in 2 indices of integrity, volume and T2*, to age-related memory variance. The results show that in healthy adults, age differences in memory can be explained in part by individual differences in HC volume that in turn are associated with differences in HC iron concentration. Lower memory scores were linked to smaller HC and higher HC iron concentration. No such associations were noted for Cd and VC. We conclude that the association between age-related declines in memory and reduced hippocampal volume may reflect the impact of oxidative stress related to increase in free iron concentration. Longitudinal follow-up is needed to test whether altered iron homeostasis in the HC is an early marker for age-related cognitive decline.
Keywords: aging, brain, hippocampus, memory, T2*
Introduction
Reduced performance on tests of episodic memory accompanies advanced age (Craik 1977) and progressive deterioration of memory is the hallmark of cognitive disorders such as Alzheimer's disease (AD) (Katzman et al. 1988; Small et al. 2000). Although the neural mechanisms supporting memory formation and maintenance are manifold, and many brain structures contribute to memory formation and maintenance, one of its most prominent anatomical substrates is the hippocampus (HC) and adjacent structures that constitute the medial-temporal lobe (MTL, Squire 1987). Notably, the MTL is a brain area where Alzheimer type neuropathology appears at the earliest stages of the disease (Braak and Braak 1991). Even in normal adults, the HC shows significant shrinkage that accelerates around the sixth decade of life (e.g. Raz, Lindenberg et al. 2005, Raz, Ghisletta et al. 2010). Age-related differences in HC volume have been frequently, though not consistently, linked to poorer memory performance in healthy older adults (see Raz and Rodrigue 2006, Rodrigue and Kennedy 2011 for reviews), with the findings possibly limited by samples with a high representation of older participants (van Petten 2004).
As many aspects of brain structure and function change with age, it is plausible that, in addition to HC shrinkage, other physiological and metabolic factors play a role in age-associated differences in memory. Among such factors, altered brain metabolism and accumulation of iron have recently received significant attention. Iron, which is essential for many cellular functions, presents in the brain in 2 major forms. First, heme iron constitutes the ferrous core of hemoglobin that binds oxygen and becomes paramagnetic when deoxygenated (Pauling and Coryell 1936). Deoxygenated heme iron contributes to local inhomogeneities that are detectable in magnetic resonance imaging (MRI) via differences in T2* relaxation times (Ogawa et al. 1990). The second form of brain iron is non-heme iron stored within the cerebral parenchyma to support normal metabolic function and neurotransmission (Mills et al. 2010). Intracellular non-heme iron (Fe2+ and Fe3+) is normally sequestered within ferritin (Schenck and Zimmerman 2004), which stabilizes the highly reactive ions. However, non-heme iron that escapes sequestration inflicts a significant negative effect on cellular integrity by promoting reactive oxygen species (Zecca et al. 2004; Mills et al. 2010). Iron-catalyzed oxidative stress is associated with aberrant dopamine and serotonin metabolism (Berg et al. 2007), differences in mitochondrial and nuclear DNA (Hamilton et al. 2001), and apoptosis (Zhang et al. 2009). For the lack of longitudinal studies, the life trajectory of brain iron concentration is unknown. However, numerous postmortem and cross-sectional in vivo studies have shown that in older brains, concentration of metabolically active iron particles increases in the cortical and, especially, subcortical gray matter (e.g. Hallgren and Sourander 1958; Bartzokis et al. 2007; see Haacke et al. 2005 for a review). An increased abundance of active iron is likely to promote oxidative stress and eventually, neurodegeneration, including the demyelination observed in healthy aging and its exacerbation in AD (Bartzokis 2011).
The importance of iron in brain aging and neurodegeneration makes the estimation of regional iron concentration of the brain in vivo highly desirable, and several methods have been proposed to attain that goal (Haacke et al. 2005; Pfefferbaum et al. 2009). One method is based on the calculation of the relaxation time constant that depends on the local inhomogeneities of the brain tissue: 1/T2* = 1/T2+1/T2′; (e.g. Ordidge et al. 1994; Martin et al. 1998; Shmueli et al. 2009; Yao et al. 2009). A strong link between shorter T2* and iron concentration and content of the parenchyma has been validated in postmortem and phantom studies (Thomas et al. 1993; Peran et al. 2009). T2*-based estimates of regional iron concentration revealed significant age-related differences in multiple regions (Raz, Rodrigue et al. 2007; Siemonsen et al. 2008; Cherubini et al. 2009; Rodrigue et al. 2011). T2* shortening has been reported in persons with hypertension (Rodrigue et al. 2011) and AD patients (Rombouts et al. 2007). Notably, whereas age-related differences in T2* and volume of healthy adults are comparable in many brain regions, in the MTL structures, associations between T2* and age are significantly stronger than age differences in volume (Rodrigue et al. 2011).
Given the association of elevated brain iron with normal aging and age-related cognitive pathology, it is plausible that in healthy persons, age-related iron accumulation might be associated with reduced cognitive performance. To date, only a handful of studies have approached this question. Sullivan et al. (2009) previously reported significant associations of T2* values in the basal ganglia and thalamus with cognitive and motor performance. A more recent study reported that higher iron concentration in the HC was associated with significantly poorer recall in 33 older men (but not women), whereas increased iron in the basal ganglia was associated with poorer working memory (Bartzokis et al. 2011). Because the extant work is limited to middle aged and older adults, it remains unclear, whether the relationship between iron and cognition is limited to that part of the lifespan. Moreover, it is unclear, whether individual differences in the local brain iron concentration and regional volumes are related to cognitive performance. Although volumes and iron concentration have been measured in the same persons (Peran et al. 2009; Rodrigue et al. 2011), the conjoint impact of these indices of brain integrity on cognition is yet to be evaluated.
Therefore, the goal of the present study was to examine and compare the associations of local T2* (a proxy for iron concentration) and regional volume with memory performance in a large lifespan sample of healthy adults. Based on the previous findings of a stronger association between age and HC T2* in comparison to age differences in HC volume (Rodrigue et al. 2011), we hypothesized that individual differences in T2* would explain a greater share of age differences in an episodic memory than HC volumes would. We also tested the hypothesis that both indices of HC integrity would contribute independently to age-related memory variance. To evaluate the specificity of the putative associations of HC iron and volume with memory, we examined 2 additional regions of interests (ROIs). One region, the caudate nucleus (Cd), evidences age-related increases in the iron concentration comparable with those in the hippocampal formation; the other, primary visual (pericalcarine) cortex (VC), a control region that does not show significant age-related increases in iron concentration (Rodrigue et al. 2011).
Materials and Methods
Participants
The sample (described in detail in Rodrigue et al. 2011) consisted of 113 paid volunteers (76 women), age 19–83 years (M = 53.96, standard deviation [SD] = 15.39). None of the participants reported a history of cardiovascular, neurological or psychiatric disease, use of anti-seizure medication, anxiolytics, or antidepressants, head trauma with loss of consciousness for >5 min, thyroid problems, diabetes mellitus, or drug and alcohol problems. Persons with metal implants and dental prostheses that could affect image quality and T2* values were not included in the study. The participants had at least high school education, were native English speakers and consistent right-handers with Edinburgh Handedness Questionnaire (Oldfield 1971). To screen for dementia and depression, we used the Mini-Mental State Examination (MMSE, Folstein et al. 1975; a cut-off of 26), and Center for Epidemiology Studies Depression Scale (CES-D, Radloff 1977; a cut-off of 15). The mean MMSE score was 28.62 (SD = 1.12) and the mean blood pressure values were 125.50 mmHg for systolic (SD = 13.25) and 77.25 mmHg for diastolic (SD = 8.06).
Seventeen participants who reported a diagnosis of hypertension were taking anti-hypertensive medications: calcium channel blockers—1 participant, angiotensin-converting enzyme inhibitors—2, angiotensin receptor II antagonist—1, beta-blockers—2, potassium-sparing diuretics—3, and 8 participants took a combination of at least 2 of these medications. The hypertensive participants were significantly older than their normotensive peers (61.65 vs. 52.59 years), t = −3.11, P= 0.003, but had a similar education level (t = −1.18, ns) and MMSE (t (24) = − 0.38, ns). Mean systolic blood pressure for the hypertensive participants (137.85 mmHg) exceeded that of the normotensive participants (123.31 mmHg, t = − 5.16, P < 0.001), as did diastolic pressure (81.09 vs. 76.57 mmHg, t = −2.98, P= 0.005), although both values were below the levels used in definition of hypertension (140/90 mmHg). All participants provided written informed consent at the beginning of the study and were debriefed after its completion.
Procedure
Blood Pressure Measurement
Blood pressure was measured by a mercury sphygmomanometer (Country Technology, Inc., Gays Mills, WI, USA; model 12–525) with a brachial cuff on 3 separate occasions in participants seated in a comfortable chair in a climate-controlled room. The values were averaged across occasions. Pulse pressure (mmHg) was calculated as the difference between the mean diastolic and the mean systolic pressures.
Memory Performance Measurement
To form a latent memory construct for the analyses reported below, we used immediate and delayed recall measures from memory for names and logical memory tests. Memory for names (subtest #1, Woodcock-Johnson Psychoeducational Battery-Revised, Woodcock and Johnson 1989) is a visual–auditory paired associate task. During acquisition, participants learn to associate a name with an image of an imaginary “space creature.” They first view a single space creature and are asked to point to the creature while the examiner repeats the associated name. The participants are asked to point to the just presented space creature and to the previously presented creature when the examiner names it. If the response is incorrect, the examiner provides corrective feedback. For the index of immediate memory (NamesI), correct responses are summed. There were 12 space creature stimuli and a maximum number correct response is 72. After a 20-min delay participants view pages with several space creatures and are asked to point to the creature named by the examiner. No corrections are given at that stage. Long-term recall (NamesL) is the total number of correct responses (maximum 36). The reliability of the memory for names indices is 0.91 (Woodcock and Johnson 1989).
In the logical memory test (Wechsler Memory Scale Revised, Wechsler 1987), participants listen to 2 paragraph-size stories, 1 at a time. Following each presentation, the participants are asked to recall the story. They are also asked to recall the same stories, 1 at a time, after a 20-min delay. If a participant does not remember the story, a gist-based cue is provided by the examiner. Logical memory immediate (LMI) and delayed recall (LMD) indices of performance are the total number of correct details remembered for both stories (maximum 50).
MRI Acquisition Protocol
Images were acquired on a 1.5 T Siemens Sonata scanner. Regional T2* measurements were obtained from a multi-echo 3D Gradient-Recalled Echo (GRE) sequence with 48 axial slices, echo times (TE) = 10, 20, 30, 40, 50, 60, 70, and 80 ms; repetition time (TR) = 100 ms; field of view (FOV) = 256 × 256 mm2; bandwidth (BW) = 170 Hz/pixel, flip angle (FA) = 30°, and voxel size = 1 × 1 × 2 mm3. The 8-echo data were collected in a single high-BW sequence, which reduced problems associated with motion. Odd-number echoes were flow-compensated in the read direction. Sequence duration was 15:22 min. For regional volumetry, we acquired a magnetization prepared rapid acquisition gradient echo (MP-RAGE) sequence with 144 coronal slices, TE = 3.93 ms, TR = 800 ms, inversion time (TI) = 420 ms, FOV = 192 × 192 mm2, BW = 130 Hz/pixel, acquisition matrix = 256 × 256, FA = 20°, and voxel size = 0.75 × 0.75 × 1.5 mm3. An 8-channel head coil was used for all sequences, thus considerably improving the signal to noise ratio.
T2* Relaxometry
The raw data from the multi-echo GRE sequences were analyzed with locally designed software, Signal Processing in NMR (SPIN; MR Innovations, Inc., Detroit, MI, USA). Images were sorted by TE, and T2* maps were created by fitting the logarithm of the data for each echo on a pixel-by-pixel basis. We used a linear fit on the logarithm of the data, with the number of echoes varying from pixel to pixel depending on the local signal. To reduce error from field inhomogeneity, the signal from longer echoes that fell below 2 SDs of the noise was excluded from the fitting. The noise was calculated from 0.8 times the mean of the Rayleigh noise distribution. In a sub-sample, we confirmed that the error during linear fit did not differ between young (n = 5, mean age of 20.40 years) and old (n = 5, mean age of 78.80 years) participants across all ROIs. Average fit error in the HC (13.18 ± 1.36 and 12.26 ± 1.55, young and old, respectively), Cd (11.03 ± 1.97 and 9.95 ± 1.47, young and old, respectively), and VC (10.83 ± 1.15 and 10.62 + 0.48, young and old, respectively) did not differ by age (0.38 < t < 1.0, ns). Therefore, differences in the T2* calculation did not confound the individual measurements of regional T2*.
T2* values were sampled after interpolating the data by a factor of 2 in both in-plane dimensions of the transverse plane. The short-echo image (TE = 10 ms) was used to anatomically identify the ROIs. An oval-shaped probe the size of 24 contiguous pixels was placed within each ROI on the short TE image and copied onto the T2* map in the identical region to obtain the T2* mean and SD values. The operator placed the probe to exclude cerebral spinal fluid partial-voluming, major vasculature and potential microbleeds. Test–retest reliability (ICC3, Shrout and Fleiss 1979) was assessed for 1 operator (K.M.R.) for each ROI on 10 images sampled twice with a 1-week delay and equaled at least 0.89.
Measurement of T2* per ROI
The T2* values in the head of the HC were measured on 4 contiguous slices from the first slice on which it was apparent in the axial plane. This encompassed the extent of the anterior portion of the HC, which was chosen because of its reported sensitivity to aging (Hackert et al. 2002). HC T2* measurements (ICC(3) = 0.90) were obtained from the left and right hemispheres, separately and averaged. The T2* values for the Cd (ICC3 = 0.94) were measured on 4 consecutive axial slices from the first slices on which the structure appeared. The VC T2* was measured in the gray matter lining of the calcarine sulcus (ICC3 = 0.89) on 3 contiguous slices, beginning on the last slice, on which the superior colliculi remained visible. Because T2* is an estimate of the local iron content, and the probes were of a standard size, the recorded T2* values reflect relative iron concentration (content per unit of volume). It is important to note that although T2* values computed in this study are highly reliable and correlate highly with iron concentration values reported in the postmortem literature (Rodrigue et al. 2011), the computed T2* is a relative index of iron burden. Whereas the region with shorter T2* contains more iron than a region with longer T2*, there is no precise translation between T2* (ms−1) and absolute iron concentration (µg/g wet tissue).
Volumetry
The MP-RAGE images were reformatted to correct for head tilt, pitch, and rotation using the orthogonal tool in the Analyze software (Biomedical Imaging Resource, Mayo Clinic College of Medicine, Rochester, MN, USA). All images were aligned to be orthogonal to the long axis of the hippocampal formation. Aligned images were re-sliced into 0.5 × 0.5 × 0.5 mm3 contiguous sections. Images were displayed (magnified ×2) and traced manually with a stylus on a 21″ LCD digitizing tablet (Wacom Cintiq 21UX). The ROIs were measured with the ROI tool in the Analyze software, and volumes were computed by multiplying the sum of areas by the slice thickness. Intracranial volume (ICV) was used to correct for differences in head and body size via a linear equation: Volumeadji = Volumerawi − b(ICVi − Mean ICV) for each subject i. In this equation, Volumeadji is adjusted ROI volume, Volumerawi is the raw ROI volume, b is the slope of the ROI volume regression on ICV for the whole sample, and Mean ICV is the sample mean of the ICV. Reliability of the regional volumetric measures was assessed by an intraclass correlation coefficient, ICC(2) (presumption of random selection of raters; Shrout and Fleiss 1979), equal to at least 0.90. HC volume was measured on a series of 19–25 slices, Cd on 15–20 slices, and VC on 15–18 slices. The auto-trace function in the Analyze program was used to measure the ICV with a reliability of ICC(2) = 0.99 and ICV did not vary by age (β = 0.112, t (84) = 1.04, ns). For details on the boundaries see Rodrigue et al. ( 2011).
Statistical Analysis
Structural equation modeling (SEM) with latent variables was implemented in Mplus (version 5.1, Muthen and Muthen, 2008). Prior to constructing latent variable models, all memory and anatomical measures were log-transformed to alleviate moderate skew. There were no sex differences in regional volumes adjusted for cranial size (all F < 1) or regional T2* values (the largest F(1,110) = 1.61, P= 0.21, ns.) Therefore, observations from men and women were combined in the following analyses.
To avoid spurious results related to the modest sample size, all latent models were bootstrapped with a bias correction (500 iterations of the whole sample). To evaluate the specificity of the role of HC iron concentration and volume in age-related memory deficit, we tested 2 non-nested models: one that included Cd T2* and volume pathways as a plausible alternative and the other that included VC measures as a control comparison (Rodrigue et al. 2011). The relationships between pulse pressure and regional T2* and volume measures were also tested in these non-nested models. Following these analyses, nested models were constructed to test the hypothesized indirect association of age and memory through regional T2* and volume. Each model was reduced to exclude statistically non-significant pathways in order to standardized the magnitude beginning with the smallest value. After each reduction, the model was reassessed as the partial variance would be different and trending pathways might become significant.
Model fit was determined by multiple indices, including the normal theory weighted χ2 statistic (a significant value indicates poor fit), the proportion of χ2 to degrees of freedom (d.f.) (<2 indicates good fit), root mean square error of approximation (RMSEA, a value equal to or <0.05 indicates excellent fit), comparative fit and Tucker-Lewis fit indices (CFI and TLI, respectively, values exceeding 0.90 indicate excellent fit), standardized root mean residual (SRMR, <0.05 supports good fit), and Akaike and sample-size adjusted Bayesian information criteria (AIC and BIC, respectively, with comparatively smaller values indicating improved model fit) (Raykov and Marcoulides 2006). Because SEM is a confirmatory statistical technique, models were tested for the theoretical relationship between left and right measures within the regional T2* and volume constructs (Rodrigue et al. 2011). Indirect effects were evaluated according to the James and Brett (1984) method, in which a significant effect is sufficient to support an indirect relationship via the specified intermediate variable(s).
Results
Latent Factor Construction
Prior to model testing, a correlational latent variables model confirmed that all indicators represented the respective constructs (Table 1). To identify the Memory construct, immediate and delayed logical memory indices (LMI and LMD, respectively) were correlated with immediate (NamesI; standardized theta coefficient = − 0.03, P < 0.05, for each) and delayed (NamesD; standardized theta coefficients = − 0.08 and −0.09, P < 0.05, respectively) memory for names.
Table 1.
Standardized measurement loading onto respective factors
| Construct | Factor | Loading |
|---|---|---|
| Age | Mean-centered age | 1.00a |
| Pulse pressure | Average pulse pressure | 1.00a |
| HC T2* | Left HC T2* | 0.58a |
| Right HC T2* | 0.68* | |
| HC volume | Left HC volume | 0.79a |
| Right HC volume | 0.85* | |
| Cd T2* | Left Cd T2* | 0.93a |
| Right Cd T2* | 0.75* | |
| Cd volume | Left Cd volume | 0.98a |
| Right Cd volume | 0.92* | |
| VC T2* | Left VC T2* | 0.35a |
| Right VC T2* | 0.96* | |
| VC volume | Left VC volume | 1.00a |
| Right VC volume | 0.23 | |
| Memory | Logical memory immediate | 1.00a |
| Logical memory delayed | 0.87* | |
| Memory for names immediate | 0.87* | |
| Memory for names delayed | 0.94* |
aFixed measurement error for latent scaling.
*Significant (P < 0.05) loading.
Zero-order correlations among the latent variables are presented in Table 2. Age and pulse pressure significantly correlated with all latent variables, except for VC T2* and volume. Age-related increase in regional iron concentration in the HC significantly correlated with HC volume (standardized path coefficient = 0.33, P < 0.05), as did regional measures in the Cd (standardized path coefficient = 0.29, P < 0.05). However, no association between regional iron concentration and volume was observed for the VC (Table 2).
Table 2.
Correlations among latent constructs
| Age | Pulse pressure | HC T2* | HC volume | Cd T2* | Cd volume | VC T2* | VC volume | |
|---|---|---|---|---|---|---|---|---|
| Pulse pressure | 0.45* | |||||||
| HC T2* | −0.62* | −0.35* | ||||||
| HC volume | −0.24* | −0.21* | 0.33* | |||||
| Cd T2* | −0.54* | −0.34* | 0.43* | 0.16 | ||||
| Cd volume | −0.40* | −0.33* | 0.22 | 0.41* | 0.29* | |||
| VC T2* | −0.14 | −0.16 | 0.32 | 0.04 | 0.13 | −0.01 | ||
| VC volume | −0.18 | −0.18 | 0.41* | 0.01 | 0.06 | 0.03 | −0.04 | |
| Memory | −0.23* | −0.21* | 0.06 | 0.25* | 0.27* | 0.02 | −0.04 | 0.25 |
Note: Regional T2* and volume and memory constructs are calculated as in the structural equation models.
*Significance at P < 0.05.
Because a linear model analysis with age and sex as predictors of memory, HC volume, and HC T2* revealed neither sex differences nor age × sex interactions (all F < 1), we did not include sex in the models. Collapsing the data over the sexes conserved degrees of freedom and allowed to avoid dealing with problematic dichotomous variables.
Hippocampal and Alternate ROI Model Comparisons
Non-nested models that compared HC against Cd and VC measures tested the hypothesized association of HC iron concentration and volume with age-related memory deficit. As shown in Figure 1, larger iron concentration in the Cd with advanced age (standardized coefficient = − 0.56, P < 0.05) associated with smaller volumes (standardized indirect effect = − 0.13, P < 0.05). Similarly, age was indirectly associated with smaller HC volume via increased regional iron concentration (standardized indirect effect = − 0.31, P < 0.05). Further, increased HC iron concentration and smaller volumes accounted for age-related memory deficits (standardized indirect effect = − 0.09, P < 0.05), whereas Cd measures did not (standardized indirect effect = 0.00, P= 0.74).
Figure 1.

A model that tests Cd T2* and volume as alternate neural correlates of age-related memory deficits to HC measures. Abbreviations: Cd—caudate nucleus, LMI—logical memory, immediate recall; LMD—logical memory, delayed recall; NamesI—memory for names, immediate recall; NamesD—memory for names, delayed recall. Significant paths are shown in bold and * indicates significance at P < 0.05.
Comparisons to the model including VC measures (Fig. 2) confirmed a significant indirect association of age with memory via HC T2* and volume differences (standardized indirect effect = − 0.30, P < 0.05) but not VC (standardized indirect effect = 0.01, P= 0.82). All fit indices are shown in Table 3. A model comparing Cd and VC T2* and volumes in relation to age and memory performance did not converge for the lack of common variance.
Figure 2.

A model that tests VC T2* and volume associations with age-related memory deficits as a control comparison. Significant paths are shown in bold and * indicates significance, P < 0.05. Abbreviations: VC—primary visual cortex.
Table 3.
Fit indices for the alternate ROI models
| Index | Good fita | HC and Cd* | HC and VC* |
|---|---|---|---|
| Nested models | |||
| d.f. | 65.0 | 65.0 | |
| χ2 | 102.19 | 90.99 | |
| χ2 P-value | >0.05 | 0.01 | 0.03 |
| χ2/d.f. | <2 | 1.57 | 1.40 |
| CFI | ≥0.90 | 0.96 | 0.96 |
| TLI | ≥0.90 | 0.94 | 0.94 |
| Non-nested models | |||
| AIC | low value | 312.53 | 2396.27 |
| BIC | low value | 457.08 | 2538.09 |
| RMSEA | ≤0.05 | 0.07 | 0.06 |
| SRMR | ≤0.05 | 0.11 | 0.10 |
*Model includes correlation between the left and right measures for HC T2* and HC volume constructs.
The relation of memory performance to HC volume, HC iron concentration (T2*), and age is illustrated in Figure 3. The memory gradient surface shows that younger participants with larger hippocampi and lower HC iron concentration (longer T2*) had the highest memory composite scores. Moreover, the scatter plot shows that the observed association was not influenced by select cases.
Figure 3.
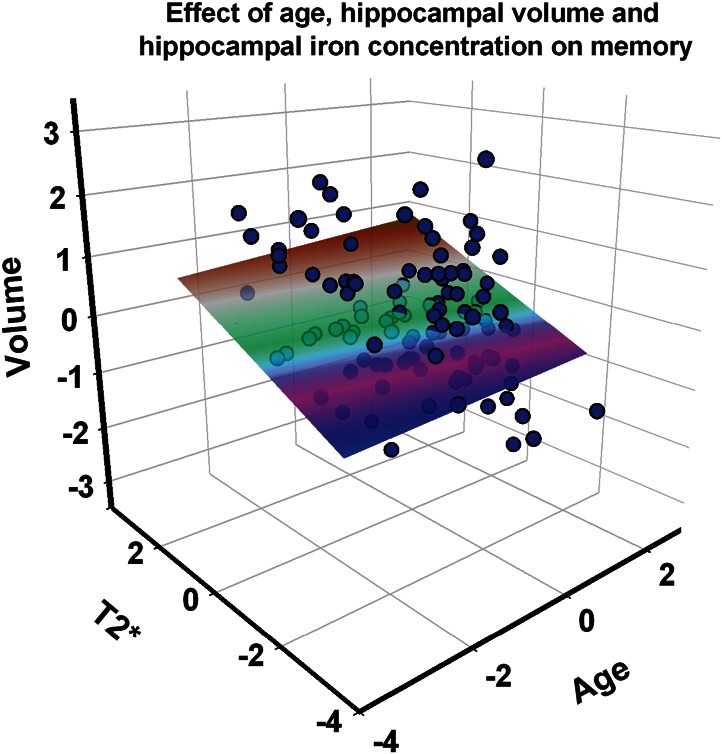
A scatter plot and memory performance gradient in the space of 3 predictors: age, HC iron concentration (T2*), and HC volume. Standardized (Z) scores are displayed on all axes. Higher scores indicate younger age, lesser iron concentration (longer T2*), and larger volume. The plane represents memory performance (latent composite scores) with brown indicating the highest and pink/purple the lowest scores.
Given that there was no association of Cd and VC measures with memory performance, we reduced the model to include only HC T2* and volume. Further, average pulse pressure was not significantly associated with HC measures or memory outcomes, and was therefore removed from the model. The associations between the left and right HC measures for both regional T2* and volume constructs were tested in the correlational model. Although the model fit well (Table 4), the correlational model would not converge if hemispheric HC measures were allowed to correlate, as would be expected on both statistical and theoretical grounds. Next, we examined models of direct age effects and various indirect effect models, including our hypothesized model, to explain variance in memory performance.
Table 4.
Fit indices for all HC models
| Index | Good fita | Correlational model | Direct age effects | Dual indirect paths | Single indirect path A* | Single indirect path B | Reverse indirect effects |
|---|---|---|---|---|---|---|---|
| Nested models | |||||||
| d.f. | 23.00 | 28.00 | 29.00 | 27.00 | 29.00 | 29.00 | |
| χ2 | 21.33 | 29.79 | 31.79 | 24.97 | 71.79 | 71.98 | |
| χ2 P-value | >0.05 | 0.26 | 0.07 | 0.03 | 0.16 | <0.0001 | <0.0001 |
| χ2/d.f. | <2 | 1.19 | 1.49 | 1.67 | 1.31 | 3.42 | 3.43 |
| CFI | ≥0.90 | 0.99 | 0.98 | 0.97 | 0.99 | 0.89 | 0.89 |
| TLI | ≥0.90 | 0.99 | 0.96 | 0.95 | 0.98 | 0.82 | 0.82 |
| Non-nested models | |||||||
| AIC | low value | 300.25 | 300.71 | 308.71 | 301.89 | 344.71 | 344.9 |
| BIC | low value | 398.44 | 387.99 | 404.17 | 397.35 | 434.71 | 434.9 |
| RMSEA | ≤0.05 | 0.04 | 0.07 | 0.08 | 0.05 | 0.15 | 0.15 |
| SRMR | ≤0.05 | 0.06 | 0.08 | 0.07 | 0.07 | 0.13 | 0.22 |
*Model includes correlation between the left and right measures for HC T2* and HC volume constructs.
Direct and Indirect Age Effects
Direct Age Effects Model
The model of direct age effects on each variable of interest fit well (Table 4). Advanced age was associated with a significant increase in iron concentration inferred from T2* measures, decreased HC volume, and poorer memory performance (Fig. 4). However, if left and right HC T2* and volumetric measures were allowed to correlate, as would be plausibly expected, the model would not converge. Therefore, such model would be unrealistic and theoretically unsound.
Figure 4.

Direct age effects model. Significant paths are shown in bold and * indicates significance at P < 0.05.
Dual Indirect Paths Model
We tested an alternate model which predicted that age was indirectly associated with differences in memory through both decreased HC volume and increased regional iron concentration as separate paths (Fig. 5). The dual indirect paths model fit well (Table 4), but would not converge if left and right HC T2* and volumes were allowed to correlate. The assumption of independence of right and left hemispheric measures for both variables is highly unrealistic and, therefore, the model is unsuitable regardless of its fit to the data.
Figure 5.

Dual indirect path model. Significant paths are shown in bold and * indicates significance at P < 0.05.
Single Indirect Path A and B Models
Our study hypothesis that the age-related differences in memory performance (low memory scores) are explained by individual differences in HC volume (smaller HC) via individual differences in HC iron concentration (greater HC iron concentration) was tested as model A (Fig. 6). The alternate hypothesis that age indirectly associated with increased HC iron concentration through a smaller HC volume was tested as model B (Supplementary Figure S1). Model A had excellent fit (Table 4) and included correlations between hemispheric measures of HC T2* and volume. In contrast, model B did not estimate correctly if left and right HC T2* measures were allowed to correlate, and thus was rejected on statistical and theoretical grounds (Table 4).
Figure 6.

Single indirect path A model. Significant paths are shown in bold and * indicates significance at P < 0.05.
Reverse Indirect Effects Model
In a cross-sectional design, the indirect effects could be plausibly reversed: cognitive variables such as memory could explain the variance in brain indices through unspecified behavioral and lifestyle factors. However, the reverse indirect effects model did not fit well (Supplementary Figure S2 and Table 4), and would not converge if hemispheric HC T2* and volume measures were allowed to correlate, and was therefore rejected.
Thus, only hypothesized model A provided a theoretically plausible and statistically sound account of the observed variance in memory performance. This model supported a negative indirect association of age with HC volume through increased HC iron concentration (standardized indirect effect = − 0.57, P < 0.0001). In addition, advanced age was indirectly related to poorer memory performance through a shorter HC T2* and then smaller HC volume (standardized total indirect effect = −0.33, P < 0.0001; Fig. 6).
Due to concerns about the use of anti-hypertension medication confounding the results, we assessed all models in the same sample after excluding 17 participants who used such prescriptions. The results did not change, except that the negative indirect association between age and memory performance via HC T2* and volume reached trend significance (standardized total indirect effect = −0.08, P= 0.06).
Discussion
Our results demonstrate that age-related differences in memory performance are associated with at least 2 indices of hippocampal integrity: iron concentration and volume. These associations, however, are not independent. Age is associated with significant decreases in T2* signal, interpreted as increases in iron concentration. Higher hippocampal iron is associated with smaller HC volume, which in turn predicted poorer memory performance. Thus, our findings suggest a specific age-related physiological mechanism for age-related differences in memory: accumulation of iron, an agent of oxidative stress.
The observed link between increased iron concentration and poorer memory is consistent with findings in animal models and humans. For example, in rodents, iron overload impairs spatial learning and memory (Maaroufi et al. 2009). A recent study reported an association between increased hippocampal ferritin and decreased word recall in a small sample of older men (Bartzokis et al. 2011). The present study demonstrates association between HC iron concentration and memory in a larger lifespan sample of healthy adults of both sexes. However, our results suggest that the negative association of iron concentration with memory may work indirectly through reduction in HC volume.
It is unclear if age-related increases in HC iron concentration reflect a normal aging process or represent an early physiological sign of impending pathological decline. Elevated iron levels have been reported in the HC of AD patients (Thompson et al. 1988) and impairment in homeostasis of iron (as well as other transition metals, such as copper and zinc) has been linked to oxidative stress (Deibel et al. 1996), a promoter of neurodegeneration. Iron accumulates in amyloid plaque in AD samples (Lovell et al. 1998; Collingwood et al. 2008) and has been observed within amyloid deposits in a transgenic mouse model of AD (Falangola et al. 2005). Moreover, elevated iron concentration is associated with lower MMSE scores in AD patients (Ding et al. 2009). Although the directionality of the link between amyloid and iron is unclear, existing evidence suggests that association between age and hippocampal T2* could reflect the underlying elevated beta-amyloid load.
Beta-amyloid is a key biomarker of AD pathology. It is elevated in approximately 20% of cognitively normal adults (Rowe et al. 2007; Price et al. 2009; see Rodrigue et al. 2009 for review), and amyloid burden correlates with reduced volume of multiple brain regions, including the HC (Chételat et al. 2010; Bourgeat et al. 2010). Notably, amyloid deposition that can be detected in healthy middle-aged adults may exert subtle negative effects on cognition (Rodrigue et al. 2012). Therefore, it is possible that fibrillar amyloid deposition, even in healthy adults, promotes regional brain atrophy and eventually results in cognitive decline (Jack et al. 2009). Testing a hypothesis regarding associations among HC iron, amyloid burden and volume is possible with a concurrent assessment of brain iron concentration and amyloid burden in vivo. However, the role of each of these factors in age-related cognitive decline can be established only in a longitudinal study.
Alternative interpretations of T2* shortening in the HC should be considered. It is possible that T2* decreases with age due to changes in brain vasculature. Differences in T2* may stem from alterations of cerebral microvascular dynamics and tissue oxygenation or from the changes in non-heme iron homeostasis. Age-related shortening of T2* could also reflect hemosiderin in cerebral microbleeds (CMB). Although CMB are relatively common among the general population of elderly (Greenberg et al. 2009), they are associated with less than optimal cognitive status (Ayaz et al. 2010), and the likelihood of finding a significant CMB load in this optimally healthy sample with our T2* method is very low.
This study should be considered in the context of its limitations. First, the cross-sectional design precludes estimating change and drawing causal inferences. Secondly, by design, our sample consisted of healthy adults who, on average, had almost full college education. These characteristics limit generalization of findings to typical aging. Thirdly, our findings reflect an estimate of iron concentration in the anterior portion of the HC. The HC is a complex and non-uniform structure, and such regional estimate may not be representative of the entire hippocampal formation. Iron concentration could vary across the subsectors and along the long axis of the HC. Finally, our estimates of iron concentration were limited by a moderate field strength that may be insufficient for detection of subtle differences in T2* that are detectable with stronger magnets (Duyn et al. 2007, Shmueli et al. 2009). Thus, development of more precise methods of in vivo estimation of regional brain iron as well as the introduction of MRI scanners with higher field strength may help to elucidate the mechanisms that underpin the important age-related associations reported in this study.
In conclusion, the results of this study show that hippocampal iron concentration is negatively associated with memory performance in healthy adults. However, this association also depends upon an individual's HC volume. Our results suggest that altered iron homeostasis and the resulting elevation of oxidative stress may be a plausible biological modifier of hippocampal tissue loss and a harbinger of age-related cognitive decline. Although the longitudinal follow-up is necessary to test this hypothesis, within a given cross-sectional frame, older adults with smaller hippocampi and higher estimated iron concentration are likely to show poor performance on tests of episodic memory.
Supplementary Material
Supplementary material can be found at: http://www.cercor.oxfordjournals.org/.
Funding
This work was supported by the National Institutes of Health grants K99 AG-036848 to KR, R37 AG-011230 to NR, and training grant T32 HS-013819 to the Institute of Gerontology, Wayne State University.
Supplementary Material
Notes
Conflict of Interest: none declared.
References
- Ayaz M, Boikov AS, Haacke EM, Kido DK, Kirsch WM. Imaging cerebral microbleeds using susceptibility weighted imaging: one step toward detecting vascular dementia. J Magn Reson Imaging. 2010;31:142–148. doi: 10.1002/jmri.22001. [DOI] [PMC free article] [PubMed] [Google Scholar]
- Bartzokis G. Alzheimer's disease as homeostatic responses to age-related myelin breakdown. Neurobiol Aging. 2011;32:1341–1371. doi: 10.1016/j.neurobiolaging.2009.08.007. [DOI] [PMC free article] [PubMed] [Google Scholar]
- Bartzokis G, Lu P, Tingus K, Peters D, Amar CP, Tishler TA, Finn JP, Villablanca P, Altshuler LL, Mintz J, et al. Gender and iron genes may modify associations between brain iron and memory in healthy aging. Neuropsychpharmacology. 2011;36:1375–1384. doi: 10.1038/npp.2011.22. [DOI] [PMC free article] [PubMed] [Google Scholar]
- Bartzokis G, Tishler T, Lu P, Villablanca P, Altshuler LL, Carter M, Huang D, Edwards N, Mintz J. Brain ferritin iron may influence age- and gender-related risks of neurodegeneration. Neurobiol Aging. 2007;28:414–423. doi: 10.1016/j.neurobiolaging.2006.02.005. [DOI] [PubMed] [Google Scholar]
- Berg D, Kruger R, RieB R, Riederer P. Parkinson's disease. In: Youdim M, Riederer P, Mandel S, Battistin L, editors. Handbook of neurochemistry and molecular neurobiology: degenerative disease of the nervous system. 3rd ed. New York (NY): Springer; 2007. pp. 1–20. [Google Scholar]
- Bourgeat P, Chetelat G, Villemagne VL, Fripp J, Raniga P, Pike K, Acosta O, Szoeke C, Ourselin S, Ames D. Beta-amyloid burden in the temporal neocortex is related to hippocampal atrophy in elderly subjects without dementia. Neurology. 2010;74:121–127. doi: 10.1212/WNL.0b013e3181c918b5. [DOI] [PubMed] [Google Scholar]
- Braak H, Braak E. Neuropathological stageing of Alzheimer-related changes. Acta Neuropathol. 1991;82:239–259. doi: 10.1007/BF00308809. [DOI] [PubMed] [Google Scholar]
- Cherubini A, Peran P, Caltagirone C, Sabatini U, Spalletta G. Aging of subcortical nuclei: microstructural, mineralization and atrophy modifications measured in vivo using MRI. NeuroImage. 2009;48:29–36. doi: 10.1016/j.neuroimage.2009.06.035. [DOI] [PubMed] [Google Scholar]
- Chételat G, Villemagne VL, Bourgeat P, Pike KE, Jones G, Ames D, Ellis KA, Szoeke C, Martins RN, O'Keefe GJ, et al. Australian Imaging Biomarkers and Lifestyle Research Group. Relationship between atrophy and β-amyloid deposition in Alzheimer disease. Ann Neurol. 2010;67:317–324. doi: 10.1002/ana.21955. [DOI] [PubMed] [Google Scholar]
- Collingwood JF, Chong RK, Kasama T, Cervera-Gontard L, Dunin-Borkowski RE, Perry G, Pósfai M, Siedlak SL, Simpson ET, Smith MA, et al. Three-dimensional tomographic imaging and characterization of iron compounds within Alzheimer's plaque core material. J Alzheimers Dis. 2008;14:235–245. doi: 10.3233/jad-2008-14211. [DOI] [PubMed] [Google Scholar]
- Craik FIM. Age differences in human memory. In: Birren JE, Schaie KW, editors. Handbook of the psychology of aging. New York (NY): Van Nostrand Reinhold; 1977. pp. 384–420. [Google Scholar]
- Deibel MA, Ehmann WD, Markesbery WR. Copper, iron, and zinc imbalances in severely degenerated brain regions in Alzheimer's disease: possible relation to oxidative stress. J Neurol Sci. 1996;143:137–142. doi: 10.1016/s0022-510x(96)00203-1. [DOI] [PubMed] [Google Scholar]
- Ding B, Chen K, Ling H, Sun F, Li X, Wan T, Chai WM, Zhang H, Zhan Y, Guan YJ. Correlation of iron in the hippocampus with MMSE in patients with Alzheimer's disease. J Magn Reson Imaging. 2009;29:793–798. doi: 10.1002/jmri.21730. [DOI] [PubMed] [Google Scholar]
- Duyn JH, van Gelderen P, Li TQ, de Zwart JA, Koretsky AP, Fukunaga M. High-field MRI of brain cortical substructure based on signal phase. Proc Natl Acad Sci USA. 2007;104:11796–11801. doi: 10.1073/pnas.0610821104. [DOI] [PMC free article] [PubMed] [Google Scholar]
- Falangola MF, Lee SP, Nixon RA, Duff K, Helpern JA. Histological co-localization of iron in Abeta plaques of PS/APP transgenic mice. Neurochem Res. 2005;20:201–205. doi: 10.1007/s11064-004-2442-x. [DOI] [PMC free article] [PubMed] [Google Scholar]
- Folstein M, Flostein S, McHugh P. “Mini-mental state.” A practical method for grading the cognitive state of patients for the clinician. J Psychiatr Res. 1975;12:189–198. doi: 10.1016/0022-3956(75)90026-6. [DOI] [PubMed] [Google Scholar]
- Greenberg SM, Vernooij MW, Cordonnier C, Viswanathan A, Al-Shahi Salman R, Warach S, Launer LJ, Van Buchem MA, Breteler MM Microbleed Study Group. Cerebral microbleeds: a guide to detection and interpretation. Lancet Neurol. 2009;8:165–174. doi: 10.1016/S1474-4422(09)70013-4. [DOI] [PMC free article] [PubMed] [Google Scholar]
- Haacke EM, Cheng NYC, House MJ, Liu Q, Neelavalli J, Ogg RJ, Khan A, Ayaz M, Kirsch W, Obenaus A. Imaging iron stores in the brain using magnetic resonance imaging. Magn Reson Imaging. 2005;23:1–25. doi: 10.1016/j.mri.2004.10.001. [DOI] [PubMed] [Google Scholar]
- Hackert VH, den Haijer T, Oudkerk M, Koudstaal PJ, Hofman A, Breteler MM. Hippocampal head size associated with verbal memory performance in nondemented elderly. NeuroImage. 2002;17:1365–1372. doi: 10.1006/nimg.2002.1248. [DOI] [PubMed] [Google Scholar]
- Hallgren B, Sourander P. The effect of age on the non-haemin iron in the human brain. J Neurochem. 1958;3:41–51. doi: 10.1111/j.1471-4159.1958.tb12607.x. [DOI] [PubMed] [Google Scholar]
- Hamilton M, Van Remmen H, Drake J, Yang H, Guo Z, Kewitt K, Walter C, Richardson A. Does oxidative damage to DNA increase with age? Proc Natl Acad Sci. 2001;98:10469–10474. doi: 10.1073/pnas.171202698. [DOI] [PMC free article] [PubMed] [Google Scholar]
- Jack CR, Jr, Lowe VJ, Weigand SD, Wiste HJ, Senjem ML, Knopman DS, Shiung MM, Gunter JL, Boeve BF, Kemp BJ. Serial PIB and MRI in normal, mild cognitive impairment and Alzheimer's disease: implications for sequence of pathological events in Alzheimer's disease. Brain. 2009;132:1355–1365. doi: 10.1093/brain/awp062. [DOI] [PMC free article] [PubMed] [Google Scholar]
- James L, Brett J. Mediators, moderators, and test for mediation. J Appl Psychol. 1984;69:307–321. [Google Scholar]
- Katzman R, Terry R, DeTeresa R, Brown T, Davies P, Fuld P, Renbing X, Peck A. Clinical, pathological, and neurochemical changes in dementia: a subgroup with preserved mental status and numerous neocortical plaques. Ann Neurol. 1988;23:138–144. doi: 10.1002/ana.410230206. [DOI] [PubMed] [Google Scholar]
- Lovell MA, Robertson JD, Teesdale WJ, Campbell JL, Markesbery WR. Copper, iron and zinc in Alzheimer's disease senile plaques. J Neurol Sci. 1998;158:47–52. doi: 10.1016/s0022-510x(98)00092-6. [DOI] [PubMed] [Google Scholar]
- Maaroufi K, Ammari M, Jeljeli M, Roy V, Sakly M, Abdelmelek H. Impairment of emotional behavior and spatial learning in adult Wistar rats by ferrous sulfate. Physiol Behav. 2009;96:343–349. doi: 10.1016/j.physbeh.2008.10.019. [DOI] [PubMed] [Google Scholar]
- Martin W, Ye F, Allen P. Increasing striatal iron content associated with normal aging. Mov Disord. 1998;13:281–286. doi: 10.1002/mds.870130214. [DOI] [PubMed] [Google Scholar]
- Mills E, Dong XP, Wang F, Xu H. Mechanisms of brain iron transport: insight into neurodegeneration and CNS disorders. Future Med Chem. 2010;2:51–64. doi: 10.4155/fmc.09.140. [DOI] [PMC free article] [PubMed] [Google Scholar]
- Ogawa S, Lee TM, Nayak AS, Glynn P. Oxygenation-sensitive contrast in magnetic resonance image of rodent brain at high magnetic fields. Magn Reson Med. 1990;14:68–78. doi: 10.1002/mrm.1910140108. [DOI] [PubMed] [Google Scholar]
- Oldfield R. The assessment and analysis of handedness. Neuropsychologica. 1971;9:97–113. doi: 10.1016/0028-3932(71)90067-4. [DOI] [PubMed] [Google Scholar]
- Ordidge R, Gorell J, Deniau J, Knight R, Helpern J. Assessment of relative brain iron concentrations using T2-weighted and T2*-weighted MRI at 3 tesla. Magn Reson Med. 1994;32:335–341. doi: 10.1002/mrm.1910320309. [DOI] [PubMed] [Google Scholar]
- Pauling L, Coryell CD. The magnetic properties and structure of hemoglobin, oxyhemoglobin and carbonmonoxyhemoglobin. Proc Natl Acad Sci USA. 1936;22:210–216. doi: 10.1073/pnas.22.4.210. [DOI] [PMC free article] [PubMed] [Google Scholar]
- Peran P, Cherubini A, Luccichenti G, Hagberg G, Demonet J, Rascol O, Celsis P, Caltagirone C, Spalletta G, Sabatini U. Volume and iron content in basal ganglia and thalamus. Human Brain Mapp. 2009;30:2667–2675. doi: 10.1002/hbm.20698. [DOI] [PMC free article] [PubMed] [Google Scholar]
- Pfefferbaum A, Adalsteinsson E, Rohlfing T, Sullivan E. MRI estimates of brain iron concentration in normal aging: comparison of field-dependent (FDRI) and phase (SWI) methods. NeuroImage. 2009;47:493–500. doi: 10.1016/j.neuroimage.2009.05.006. [DOI] [PMC free article] [PubMed] [Google Scholar]
- Price JL, McKeel DW, Jr, Buckles VD, Roe CM, Xiong C, Grundman M, Hansen LA, Petersen RC, Parisi JE, Dickson DW, et al. Neuropathology of nondemented aging: presumptive evidence for preclinical Alzheimer disease. Neurobiol Aging. 2009;30:1026–1036. doi: 10.1016/j.neurobiolaging.2009.04.002. [DOI] [PMC free article] [PubMed] [Google Scholar]
- Radloff L. The CES-D scale: a self-report depression scale for research in the general population. J Struct Biol. 1977;153:42–54. [Google Scholar]
- Raykov T, Marcoulides G. A first course in structural equation modeling. 2nd ed. Mahwah, NJ: Lawrence Erlbaum; 2006. [DOI] [PMC free article] [PubMed] [Google Scholar]
- Raz N, Ghisletta P, Rodrgiue K, Kennedy K, Lindenberger U. Trajectories of brain aging in middle-age and older adults: regional and individual differences. NeuroImage. 2010;51:501–511. doi: 10.1016/j.neuroimage.2010.03.020. [DOI] [PMC free article] [PubMed] [Google Scholar]
- Raz N, Lindenberg U, Rodrigue KM, Kennedy KM, Head D, Williamson A, Dahle C, Gerstorf D, Acker JD. Regional brain changes in aging healthy adults: general trends, individual differences, and modifiers. Cereb Cortex. 2005;15:1676–1689. doi: 10.1093/cercor/bhi044. [DOI] [PubMed] [Google Scholar]
- Raz N, Rodrigue KM. Differential aging of the brain: patterns, cognitive correlates and modifiers. Neurosci Biobehav Rev. 2006;30:730–748. doi: 10.1016/j.neubiorev.2006.07.001. [DOI] [PMC free article] [PubMed] [Google Scholar]
- Raz N, Rodrigue KM, Haacke EM. Brain aging and its modifiers: insights from in vivo neuromorphometry and susceptibility weighted imaging. Ann N Y Acad Sci. 2007;1097:84–93. doi: 10.1196/annals.1379.018. [DOI] [PMC free article] [PubMed] [Google Scholar]
- Rodrigue KM, Haacke EM, Raz N. Differential effects of age and history of hypertension on regional brain volumes and iron. NeuroImage. 2011;54:750–759. doi: 10.1016/j.neuroimage.2010.09.068. [DOI] [PMC free article] [PubMed] [Google Scholar]
- Rodrigue KM, Kennedy KM. The cognitive consequences of structural changes to the aging brain. In: Schaie KW, Willis SL, editors. Handbook of the psychology of aging. 7th ed. New York (NY): Elsevier; 2011. pp. 73–92. Ch 5. [Google Scholar]
- Rodrigue KM, Kennedy KM, Devous MD, Sr, Rieck JR, Hebrank AC, Diaz-Arrastia R, Mathews D, Park DC. β-amyloid deposition in healthy aging: regional deposition and cognitive consequences. Neurology. 2012;78:387–395. doi: 10.1212/WNL.0b013e318245d295. [DOI] [PMC free article] [PubMed] [Google Scholar]
- Rodrigue KM, Kennedy KM, Park DC. Beta-amyloid deposition and the aging brain. Neuropsychol Rev. 2009;19:436–450. doi: 10.1007/s11065-009-9118-x. [DOI] [PMC free article] [PubMed] [Google Scholar]
- Rombouts SA, Scheltens P, Kuijer JP, Barkhof F. Whole brain analysis of T2* weighted baseline FMRI signal in dementia. Hum Brain Mapp. 2007;28:1313–1317. doi: 10.1002/hbm.20349. [DOI] [PMC free article] [PubMed] [Google Scholar]
- Rowe CC, Ng S, Ackermann U, Gong SJ, Pike K, Savage G, Cowie TF, Dickinson KL, Maruff P, Darby D, et al. Imaging beta-amyloid burden in aging and dementia. Neurology. 2007;68:1718–1725. doi: 10.1212/01.wnl.0000261919.22630.ea. [DOI] [PubMed] [Google Scholar]
- Schenck JF, Zimmerman EA. High-field magnetic resonance imaging of brain iron: birth of a biomarker? NMR Biomed. 2004;17:433–445. doi: 10.1002/nbm.922. [DOI] [PubMed] [Google Scholar]
- Shmueli K, de Zwart J, van Gelderen P, Li T-Q, Dodd SJ, Duyn JH. Magnetic susceptibility mapping of brain tissue in vivo using MRI phase data. Magn Reson Med. 2009;62:1510–1522. doi: 10.1002/mrm.22135. [DOI] [PMC free article] [PubMed] [Google Scholar]
- Shrout P, Fleiss J. Intraclass correlations: uses in assessing raters reliability. Psychol Bull. 1979;86:420–428. doi: 10.1037//0033-2909.86.2.420. [DOI] [PubMed] [Google Scholar]
- Siemonsen S, Finsterbusch J, Matschke J, Loernzen A, Ding X, Fiehler J. Age-dependent normal values of T2* and T2′ in brain parenchyma. Am J Neuroradiol. 2008;29:950–955. doi: 10.3174/ajnr.A0951. [DOI] [PMC free article] [PubMed] [Google Scholar]
- Small BJ, Fratiglioni L, Vitanen M, Winblad B, Backman L. The course of cognitive impairment in preclinical Alzheimer disease: three- and 6-year follow-up of a population-based sample. Arch Neurol. 2000;57:839–844. doi: 10.1001/archneur.57.6.839. [DOI] [PubMed] [Google Scholar]
- Squire LR. Memory and brain. New York (NY): Oxford University Press; 1987. [Google Scholar]
- Sullivan EV, Adalsteinsson E, Rohling T, Pfefferbaum A. Relevance of iron deposition in deep gray matter brain structures to cognitive and motor performance in healthy elderly men and women: exploratory findings. Brain Imaging Behav. 2009;3:167–175. doi: 10.1007/s11682-008-9059-7. [DOI] [PMC free article] [PubMed] [Google Scholar]
- Thomas L, Boyoko O, Anthony D, Burger P. MR detection of brain iron. Am J Neuroradiol. 1993;14:1043–1048. [PMC free article] [PubMed] [Google Scholar]
- Thompson CM, Markesbery WR, Ehmann WD, Mao YX, Vance DE. Regional brain trace-element studies in Alzheimer's disease. Neurotoxicol. 1988;9:1–7. [PubMed] [Google Scholar]
- Van Petten C. Relationship between hippocampal volume and memory ability in healthy individuals across the lifespan: review and meta-analysis. Neuropsychologia. 2004;42:1394–1413. doi: 10.1016/j.neuropsychologia.2004.04.006. [DOI] [PubMed] [Google Scholar]
- Wechsler D. Manual for Wechsler Memory Scale-Revised. San Antonio (TX): Psychological Corporation; 1987. [Google Scholar]
- Woodcock RW, Johnson MB. Woodcock-Johnson psycho-educational battery-revised. Allen (TX): DLM Teaching Resources; 1989. [Google Scholar]
- Yao B, Li TQ, Gelderen P, Shmueli K, de Zwart JA, Duyn JH. Susceptibility contrast in high field MRI of human brain as a function of tissue iron content. NeuroImage. 2009;44:1259–1266. doi: 10.1016/j.neuroimage.2008.10.029. [DOI] [PMC free article] [PubMed] [Google Scholar]
- Zecca L, Youdim MB, Riederer P, Connor JR, Crichton RR. Iron, brain ageing and neurodegenerative disorders. Nat Rev Neurosci. 2004;5:863–873. doi: 10.1038/nrn1537. [DOI] [PubMed] [Google Scholar]
- Zhang S, Wang J, Song N, Xie J, Jiang H. Up-regulation of divalent metal transporter 1 is involved in 1-methyl-4-phenylpyridinium (MPP+)-induced apoptosis in MES23.5 cells. Neurobiol Aging. 2009;30:1466–1476. doi: 10.1016/j.neurobiolaging.2007.11.025. [DOI] [PubMed] [Google Scholar]
Associated Data
This section collects any data citations, data availability statements, or supplementary materials included in this article.