

Abstract
Summary: High-throughput microscopy data require a diversity of analytical approaches. However, the construction of workflows that use algorithms from different software packages is difficult owing to a lack of interoperability. To overcome this limitation, we present CellH5, an HDF5 data format for cell-based assays in high-throughput microscopy, which stores high-dimensional image data along with inter-object relations in graphs. CellH5Browser, an interactive gallery image browser, demonstrates the versatility and performance of the file format on live imaging data of dividing human cells. CellH5 provides new opportunities for integrated data analysis by multiple software platforms.
Availability: Source code is freely available at www.github.com/cellh5 under the GPL license and at www.bioconductor.org/packages/release/bioc/html/rhdf5.html under the Artistic-2.0 license. Demo datasets and the CellH5Browser are available at www.cellh5.org. A Fiji importer for cellh5 will be released soon.
Contact: daniel.gerlich@imba.oeaw.ac.at or christoph.sommer@imba.oeaw.ac.at
Supplementary information: Supplementary data are available at Bioinformatics online.
1 INTRODUCTION
Recent advancements in microscope automation enable high-content screening at unprecedented throughput and spatio-temporal resolution. Cell-based assays typically involve segmentation of individual objects (cells) within the imaging field, followed by quantification of cell morphologies (Conrad and Gerlich, 2010). Powerful algorithms have been developed for learning-based segmentation (Sommer et al., 2011) and quantification and classification of cell morphologies (Boland and Murphy, 2001; Carpenter et al., 2006; Eliceiri et al., 2012; Held et al., 2010; Walter et al., 2010). Application of any of these methods to large-scale biological data requires sophisticated workflow management and efficient batch processing, for which different software platforms have been developed (Carpenter et al., 2006; Eliceiri et al., 2012; Held et al., 2010; Jones et al., 2008). In practice, the analysis often asks for the combination of methods that are available in distinct software platforms. Integration by re-implementation into a single platform is inefficient and error prone. A preferable approach is integration by interoperability of tools. Here, we propose a versatile data format for serialization, disk-based storage and exchange of high-content screening data and processing results. This provides a flexible and sustainable solution for the development of integrated analysis pipelines based on multiple software platforms.
To facilitate the exchange of microscopy image data, the Open Microscopy Environment project (OME) has developed a standardized file format, OME-TIFF (Linkert et al., 2010), which can store raw microscopy images along with experimental meta-information (Supplementary Table S1). Semantically typed data hypercubes (Millard et al., 2011) have been proposed to store multi-dimensional high-content screening data in a hierarchical fashion based on Extensible Markup Language and the HDF5 data model, which is optimized for efficient storage and rapid access of large-scale multi-dimensional data. However, complex object relationships, as, for example, lineage trees of dividing cell populations that can comprise millions of cell objects, cannot be efficiently processed when stored in textual data formats such as Extensible Markup Language used in OME-TIFF and semantically typed data hypercubes.
Object relations are represented by network graphs, following standard formats such as GraphML (Brandes et al., 2001) and GraphViz (Ellson et al., 2002). These text-based formats, however, are designed mainly for visualization of graphs and cannot be efficiently enriched with high-dimensional binary data. An integrated data format representing both machine-readable graph structures and multivariate object features has not been reported in the field of bioimaging. With CellH5, we introduce an efficient mechanism, representing both object relations in graphs along with high-dimensional object data.
2 FORMAT SPECIFICATIONS
CellH5 contains four major components: images, objects, object relations and features (Fig. 1, Supplementary Figs S1–S3). Objects of different categories, e.g. cells or cell organelles like nuclei or vesicles, are initially derived by segmentation within the original images. Relations between these objects then define higher-level objects, e.g. cell organelles, which can be related to define cells, or cell objects can be related across time frames to define lineage trees. The resulting object graphs are stored by adjacency list in HDF5 datasets for fast index access (Supplementary Fig. S4). High-level objects can be related to each other again by the same mechanism, e.g. by grouping multiple trajectories that share similar temporal dynamics. Each object can be linked at any hierarchy level with high-dimensional data such as quantitative features, segmentation contours or morphology classes. The resulting files are generated independently for each sample and can be linked together into one single file containing the data of an entire screening experiment. Such an interlinked file structure is essential for rapid access in interactive browsing and for high-throughput batch processing. CellH5 is platform independent and can be natively accessed by multiple programming languages (Python, C/C++, Java, Matlab and R), which eases the interoperability of software tools for image analysis and data post-processing. In general, CellH5 is divided into a definition and a sample part. The definitions contain information about what is stored (i.e. objects, object features and object relations) and optionally carry meta-information (e.g. imaging conditions and classification parameters). The actual data reside in samples. Different types of object relations supported by CellH5 are depicted in Supplementary Figure S1. A formal specification of the CellH5 layout and a detailed illustration of how object graphs are represented and retrieved are provided in Supplementary Figures S2 and S3.
Fig. 1.
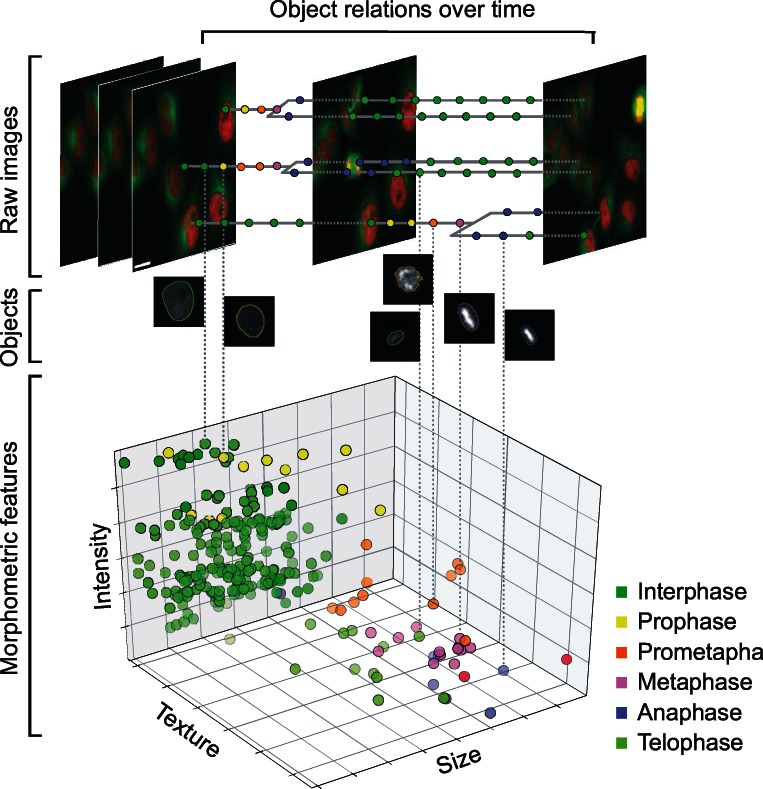
Example for data storage in CellH5. Images of human cells (red: chromatin; green: microtubules), segmentations (object outlines), classification (colour of object contours or spots indicates different mitotic stages), object relations (tracking trees) and morphometric features (spots represent cell objects). Dashed lines indicate relations of representative objects. Scale bar: 20 µm
3 IMPLEMENTATIONS
We provide a reference implementation of CellH5 in Python within the open-source frameworks CellCognition (Held et al., 2010) and CellH5. The Application Programming Interface is implemented in the cellh5 module of CellH5, which provides convenient high-level access to object graphs and associated object features (Supplementary Table S2) and comprises common use and test cases (Python unit tests). The cellh5 module runs with a standard Python distribution and does not depend on the installation of other image analysis tools, e.g. CellCognition. The interoperability of software tools, achieved by CellH5, is supported by an R-interface to the Bioconductor project. It is bundled in the rsrc package of CellH5 and includes example use cases written in R (Supplementary File S1; source code in Supplementary File S2). It requires the rhdf library for HDF5 access released in the Bioconductor project (Gentleman et al., 2004).
To test the performance and flexibility of CellH5, we developed an interactive gallery image browser, CellH5Browser (Supplementary Software 1). As example data we used a live-cell microscopy dataset of human HeLa cells expressing a red fluorescent marker for chromatin (H2B-mCherry) and a green fluorescent marker for microtubules (mEGFP-α-tubulin) (Held et al., 2010; Zhong et al., 2012). The dataset comprises 3914 images (2.88 GByte) and 332 732 cell objects. Cell trajectories were derived by image segmentation and tracking using CellCognition (Held et al., 2010) and visualized as series of single cell images with overlaid segmentation contours and class annotations (Supplementary Fig. S4). We further exploited the versatility of CellH5 to investigate the fate of dividing cells on perturbation of mitotic regulators (Supplementary Fig. S5). Cell trajectory plots indicated that RNA interference (RNAi)-mediated depletion of the mitotic motor protein KIF11 frequently induced prolonged prometaphase followed by mitotic cell death, whereas depletion of the mitotic checkpoint protein Mad2 led to a short mitosis, often followed by cell death in the subsequent interphase. These observations are consistent with the known phenotypes, indicating the feasibility of accurate cell fate profiling based on CellH5.
Supplementary Material
ACKNOWLEDGEMENTS
We thank the members of the Gerlich Laboratory for their data and for testing the software, and Thomas Walter and Gregoire Pau for helpful discussions on the format design.
Funding: The research leading to these results has received funding from the European Union's Seventh Framework Programme (FP7/2007-2013) under grant agreement nr. 241548 (Large-scale Integrating Project MitoSys), and under grant agreement nr. 258068 (EU-FP7-Systems Microscopy NoE).
Conflict of Interest: none declared.
References
- Boland MV, Murphy RF. A neural network classifier capable of recognizing the patterns of all major subcellular structures in fluorescence microscope images of HeLa cells. Bioinformatics. 2001;17:1213–1223. doi: 10.1093/bioinformatics/17.12.1213. [DOI] [PubMed] [Google Scholar]
- Brandes U, et al. Proceedings of 9th International Symposium on Graph Drawing. 2001. Graphml progress report: structural layer proposal; pp. 501–512. [Google Scholar]
- Carpenter AE, et al. CellProfiler: image analysis software for identifying and quantifying cell phenotypes. Genome Biol. 2006;7:R100. doi: 10.1186/gb-2006-7-10-r100. [DOI] [PMC free article] [PubMed] [Google Scholar]
- Conrad C, Gerlich DW. Automated microscopy for high-content RNAi screening. J. Cell Biol. 2010;188:453–461. doi: 10.1083/jcb.200910105. [DOI] [PMC free article] [PubMed] [Google Scholar]
- Eliceiri KW, et al. Biological imaging software tools. Nat. Methods. 2012;9:697–710. doi: 10.1038/nmeth.2084. [DOI] [PMC free article] [PubMed] [Google Scholar]
- Ellson J, et al. Proceedings of 9th International Symposium on Graph Drawing. Springer; 2002. Graphviz - open source graph drawing tools; pp. 483–484. [Google Scholar]
- Gentleman RC, et al. Bioconductor: open software development for computational biology and bioinformatics. Genome Biol. 2004;5:R80. doi: 10.1186/gb-2004-5-10-r80. [DOI] [PMC free article] [PubMed] [Google Scholar]
- Held M, et al. CellCognition: time-resolved phenotype annotation in high-throughput live cell imaging. Nat. Methods. 2010;7:747–754. doi: 10.1038/nmeth.1486. [DOI] [PubMed] [Google Scholar]
- Jones TR, et al. CellProfiler Analyst: data exploration and analysis software for complex image-based screens. BMC Bioinformatics. 2008;9:482. doi: 10.1186/1471-2105-9-482. [DOI] [PMC free article] [PubMed] [Google Scholar]
- Linkert M, et al. Metadata matters: access to image data in the real world. J. Cell Biol. 2010;189:777–782. doi: 10.1083/jcb.201004104. [DOI] [PMC free article] [PubMed] [Google Scholar]
- Millard BL, et al. Adaptive informatics for multifactorial and high-content biological data. Nat. Methods. 2011;8:487–493. doi: 10.1038/nmeth.1600. [DOI] [PMC free article] [PubMed] [Google Scholar]
- Sommer C, et al. 8th IEEE International Symposium on Biomedical Imaging: From Nano to Macro (ISBI 2011) Chicago, Illinois, USA: 2011. ilastik: interactive learning and segmentation toolkit. [Google Scholar]
- Walter T, et al. Automatic identification and clustering of chromosome phenotypes in a genome wide RNAi screen by time-lapse imaging. J. Struct. Biol. 2010;170:1–9. doi: 10.1016/j.jsb.2009.10.004. [DOI] [PubMed] [Google Scholar]
- Zhong Q, et al. Unsupervised modeling of cell morphology dynamics for time-lapse microscopy. Nat. Methods. 2012;9:711–713. doi: 10.1038/nmeth.2046. [DOI] [PubMed] [Google Scholar]
Associated Data
This section collects any data citations, data availability statements, or supplementary materials included in this article.