

Abstract
Motivation: The number of missense mutations being identified in cancer genomes has greatly increased as a consequence of technological advances and the reduced cost of whole-genome/whole-exome sequencing methods. However, a high proportion of the amino acid substitutions detected in cancer genomes have little or no effect on tumour progression (passenger mutations). Therefore, accurate automated methods capable of discriminating between driver (cancer-promoting) and passenger mutations are becoming increasingly important. In our previous work, we developed the Functional Analysis through Hidden Markov Models (FATHMM) software and, using a model weighted for inherited disease mutations, observed improved performances over alternative computational prediction algorithms. Here, we describe an adaptation of our original algorithm that incorporates a cancer-specific model to potentiate the functional analysis of driver mutations.
Results: The performance of our algorithm was evaluated using two separate benchmarks. In our analysis, we observed improved performances when distinguishing between driver mutations and other germ line variants (both disease-causing and putatively neutral mutations). In addition, when discriminating between somatic driver and passenger mutations, we observed performances comparable with the leading computational prediction algorithms: SPF-Cancer and TransFIC.
Availability and implementation: A web-based implementation of our cancer-specific model, including a downloadable stand-alone package, is available at http://fathmm.biocompute.org.uk.
Contact: fathmm@biocompute.org.uk
Supplementary information: Supplementary data are available at Bioinformatics online.
1 INTRODUCTION
Human cancers are characterized by the accumulation of somatic mutations, e.g. gross insertions and deletions, as well as the more subtle single base pair substitutions (Iengar, 2012), some of which confer a growth advantage on the tumour cells (Hanahan and Weinberg, 2011). The Catalogue of Somatic Mutations in Cancer (COSMIC) (Bamford et al., 2004) is an online repository of somatic mutation data, which includes amino acid substitutions (AASs). The identification of cancer-promoting AASs (driver mutations) promises to lead to a better understanding of the molecular mechanisms underlying the disease, as well as providing potential diagnostic and therapeutic markers (Furney et al., 2006). However, this remains a major challenge, as the majority of AASs detected in cancer genomes do not contribute to carcinogenesis; rather, these ‘passenger mutations’ are a consequence of tumorigenesis rather than a cause (Greenman et al., 2007). Therefore, accurate automated computational prediction algorithms capable of distinguishing between driver and passenger mutations are of paramount importance.
A review by Thusberg et al. (2011) describes the performance of several computational prediction algorithms (Adzhubei et al., 2010; Bao et al., 2005; Bromberg and Rost, 2007; Calabrese et al., 2009; Capriotti et al., 2006; Li et al., 2009; Ng and Henikoff, 2001; Mort et al., 2010; Ramensky et al., 2002; Thomas et al., 2003) using a ‘gold standard’ validation benchmark (Sasidharan Nair and Vihinen, 2013). In our previous work, we developed the Functional Analysis through Hidden Markov Models (FATHMM) algorithm and, using a model weighted for inherited disease mutations, observed improved performance accuracies over alternative computational prediction methods using the same benchmark (Shihab et al., 2013). However, the value of traditional computational prediction algorithms in cancer genomics remains unclear (Kaminker et al., 2007a). For example, the shared characteristics between driver and other disease-causing mutations allow for a significant proportion of cancer-associated mutations to be identified (high-sensitivity/true positive rate); however, these methods are incapable of reliably distinguishing between driver and other disease-causing mutations. Furthermore, with respect to carcinogenesis, a large proportion of passenger mutations are still misclassified as having a role in tumour progression (low-specificity/true negative rate). As a result, several cancer-specific computational prediction algorithms capable of distinguishing between driver mutations and other germ line variants (both disease-causing and putatively neutral mutations) and/or capable of discriminating between somatic driver and passenger mutations have been developed (Carter et al., 2009; Gonzalez-Perez et al., 2012; Kaminker et al., 2007b; Reva et al., 2011).
In this work, we describe an adaptation to our original algorithm, which amalgamates sequence conservation within hidden Markov models (HMMs), representing the alignment of homologous sequences and conserved protein domains, with ‘pathogenicity weights’, representing the overall tolerance of the corresponding model to mutations (Shihab et al., 2013), to potentiate the functional analysis of driver mutations. Using a model weighted for cancer-associated mutations, we observe performance accuracies, which outperform alternative computational prediction algorithms (Adzhubei et al., 2010; Capriotti and Altman, 2011; Ng and Henikoff, 2001; Reva et al., 2011) when distinguishing between driver and other germ line mutations (both disease-causing and neutral polymorphisms). Furthermore, when discriminating between driver and passenger mutations (somatic), we observe performance accuracies comparable with other state-of-the-art computational prediction algorithms (Capriotti and Altman, 2011; Carter et al., 2009; Gonzalez-Perez et al., 2012). A web-based implementation of our algorithm, including a high-throughput batch submission facility and a downloadable stand-alone package, is available at http://fathmm.biocompute.org.uk.
2 METHODS
2.1 The mutation datasets
The mutation datasets used in this study were collected and assembled as follows: first, cancer-associated mutations (germ line and somatic) from the CanProVar database (Li et al., 2010) (CanProVar—Version 54; http://bioinfo.vanderbilt.edu/canprovar) and putative neutral polymorphisms from the UniProt database (Apweiler et al., 2004) (UniProt—November 2011; http://www.uniprot.org/docs/humsavar) were downloaded and used to calculate our ‘cancer-specific pathogenicity weights’. Next, we obtained three mutation datasets (Capriotti and Altman, 2011) and performed an independent benchmark comparing the performance of our algorithm with the performance of five alternative computational prediction algorithms (Adzhubei et al., 2010; Capriotti and Altman, 2011; Ng and Henikoff, 2001; Reva et al., 2011). Finally, we obtained a published benchmark consisting of nine mutation datasets (Gonzalez-Perez et al., 2012) and compared the performance of our algorithm with the performance of four alternative computational prediction algorithms (Adzhubei et al., 2010; Gonzalez-Perez et al., 2012; Ng and Henikoff, 2001; Reva et al., 2011). The composition of these datasets is summarized in Table 1, and the overlap between our training and benchmarking datasets is illustrated in Supplementary Table S1.
Table 1.
Summary of mutation datasets used in this study
| Dataset | Positives | Negatives | Description |
|---|---|---|---|
| Training datasets | |||
| CanProVar | 12 720 | — | A collection of cancer-associated mutations used to calculate our pathogenicity weights |
| UniProt | — | 36 928 | A collection of putative neutral polymorphisms used to calculate our pathogenicity weights |
| Capriotti and Altman benchmark | |||
| CNO | 3163 | 3163 | Comprising driver mutations used to train the CHASM algorithm and neutral polymorphisms |
| CND | 3163 | 3163 | Comprising driver mutations used to train the CHASM algorithm and other germ line mutations (both disease-causing and neutral polymorphisms) |
| Synthetic | 3163 | 3163 | Comprising driver and passenger mutations (somatic) used to train the CHASM algorithm |
| Gonzalez-Perez et al. benchmark | |||
| COSMIC 2 + 1 | 3978 | 39 850 | Comprising COSMIC mutations occurring in 2+ samples and COSMIC mutations occurring in one sample |
| COSMIC 5 + 1 | 1631 | 39 850 | Comprising COSMIC mutations occurring in 5+ samples and COSMIC mutations occurring in one sample |
| COSMIC 2/POL | 3978 | 8040 | Comprising COSMIC mutations occurring in 2+ samples and neutral polymorphisms |
| COSMIC 5/POL | 1631 | 8040 | Comprising COSMIC mutations occurring in 5+ samples and neutral polymorphisms |
| COSMIC D/O | 2151 | 41 664 | Comprising driver mutations used to train the CHASM algorithm and COSMIC mutations not in the positive subset |
| COSMIC D/POL | 2151 | 8040 | Comprising driver mutations used to train the CHASM algorithm and neutral polymorphisms |
| COSMIC CGC/NONCGC | 4865 | 34 827 | Comprising COSMIC mutations falling within genes defined in the CGC and COSMIC mutations falling within genes outside the CGC |
| WG 2/1 | 790 | 24 079 | Comprising somatic mutations occurring in 2+ samples and somatic mutations occurring in one sample |
| WG CGC/NONCGC | 1302 | 22 983 | Comprising somatic mutations falling within genes defined in the CGC and somatic mutations falling within genes outside the CGC |
CGC, Cancer Gene Census (Futreal et al., 2004).
2.2 Scoring cancer-associated amino acid substitutions
Following the procedure described in Shihab et al. (2013): protein domain annotations from the SUPERFAMILY (Gough et al., 2001) (version 1.75) and Pfam (Sonnhammer et al., 1997) (Pfam-A and Pfam-B; version 26.0) databases are made. Next, the corresponding HMMs are extracted if the mutation maps onto a match state within the model, and the domain assignment is deemed to be significant (e-value ≤0.01). Where multiple HMMs are extracted, then the model with the largest information gain (as measured by the Kullback–Leibler divergence (Kullback and Leibler, 1951) from the SwissProt/TrEMBL amino acid composition) is used. Finally, we interrogate the amino acid probabilities within the model and assume that a reduction in the amino acid probabilities (when comparing the wild-type with the mutant residue) indicates a potential negative impact on protein function. Finally, the predicted magnitude of effect is weighted using cancer-specific pathogenicity weights (Supplementary Methods):
| (1) |
Here, Pw and Pm represent the underlying probabilities for the wild-type and mutant amino acid residues, respectively, and the pathogenicity weights, Wc and Wp, represent the relative frequencies of cancer-associated (CanProVar) and putative neutral polymorphisms (UniProt) mapping onto the relevant HMMs, respectively. A pseudo-count of 1.0 is incremented to our pathogenicity weights to avoid zero divisible terms.
2.3 Extending our algorithm to mutations falling outside conserved protein domains
The main disadvantage of our original algorithm was confining coverage (via the weighting scheme used) to protein missense variants falling within conserved protein domains. To increase coverage, we have developed an extension to the aforementioned data for predicting the functional effects of AASs falling outside conserved protein domains. In brief, ab initio HMMs, representing the alignment of homologous sequences within the SwissProt/TrEMBL database (Apweiler et al., 2004), are constructed using the JackHMMER component of HMMER3 (Eddy, 2009) (one iteration with the optional—hand parameter applied). The predicted magnitude of effect is then calculated as in Equation (1); however, these models are weighted with the relative frequencies of cancer-associated (CanProVar) and putative neutral polymorphisms (UniProt) mapping onto the top scoring sequence(s), and their homologous domain(s), being used to construct the model (Supplementary Methods).
2.4 Performance evaluation
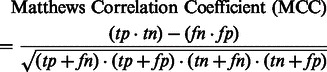
As recommended in Vihinen (2012), the performance of our method was assessed using the following six parameters [Equations (2–7)]:
| (2) |
| (3) |
| (4) |
| (5) |
| (6) |
 |
(7) |
In the aforementioned data, tp and fp refer to the number of true positives and false positives reported and tn and fn denote the number of true negatives and false negatives reported.
3 RESULTS
3.1 A cancer-specific prediction threshold
The Capritotti and Altman (2011) benchmark comprises three mutation datasets: the cancer and neutral only (CNO) mutation dataset assesses the performance of computational prediction algorithms when tasked with discriminating between driver mutations and neutral (germ line) polymorphisms; the cancer, neutral and other disease (CND) mutation dataset is used to evaluate the performance of computational prediction algorithms when tasked with distinguishing between cancer-associated and other germ line mutations (both disease-causing and neutral polymorphisms); and the synthetic mutation dataset measures the performance of computational prediction algorithms when differentiating between somatic driver and passenger mutations. Therefore, to derive a prediction threshold capable of being applied under all conditions, we plotted the distribution of the predicted magnitude of effect for all mutations in the Capriotti and Altman benchmark using a leave-one-out cross-validation procedure (Fig. 1). From this, we calculated a prediction threshold at which the specificity and sensitivity of our algorithm were both maximized across the mutation datasets: −0.75. Using this threshold, we observed that a large proportion of driver mutations (92%) fell below our prediction threshold, whereas the vast majority of germ line polymorphisms (disease-causing/putative neutral mutations) and passenger mutations fell above our prediction threshold, 94 and 87%, respectively.
Fig. 1.

The distribution of the predicted magnitude of effect for all driver mutations against all non–cancer-associated (germ line and somatic) mutations in the Capriotti and Altman (2011) benchmark. Here, the dashed line represents our prediction threshold of −0.75 at which the specificity and sensitivity of our algorithm is maximized across all mutation datasets
3.2 An independent benchmark against other computational prediction algorithms
Using the Capriotti and Altman (2011) mutation datasets, we performed an independent benchmark comparing the performance of our method with the performance of two generic computational prediction algorithms: SIFT (Ng and Henikoff, 2001) and PolyPhen-2 (Adzhubei et al., 2010); alongside two cancer-specific computational prediction algorithms: Mutation Assessor (Reva et al., 2011) and SPF-Cancer (Capriotti and Altman, 2011). For this analysis, we obtained SIFT and PolyPhen-2 predictions using the corresponding algorithms’ batch submission facilities, whereas Mutation Assessor predictions were collected using the available web service, and SPF-Cancer predictions were provided by the corresponding author on request (as no batch submission is available). The algorithm’s default parameters and prediction thresholds were applied throughout our analysis.
First, using the cancer and neutral only (CNO) mutation dataset, we assessed the performance of these algorithms when tasked with distinguishing between driver mutations and putatively neutral polymorphisms. In addition, using the cancer, neutral and other disease (CND) mutation dataset, we assessed the performance of these algorithms when tasked with differentiating between driver mutations and other disease-causing mutations (non-neoplasm). From Table 2, and in terms of performance accuracies, it would seem that our method is the best-performing algorithm across these mutation datasets (94 and 93%, respectively). Using the synthetic mutation dataset, we assessed the performance of these algorithms when tasked with discriminating between somatic driver and passenger mutations. Here, our method outperforms SIFT, PolyPhen-2 and Mutation Assessor; it is comparable with SPF-Cancer (89 and 90%, respectively). Next, we compared the performance of our domain-based algorithm with the performance of our novel extension (capturing regions falling outside of conserved protein domains). We observed similar performances both within and outside conserved protein domains and concluded that our extension (and the corresponding weighting scheme) was just as effective as our domain-based algorithm when predicting the functional consequences of cancer-associated mutations (Supplementary Table S2). Finally, we plotted receiver operating characteristic (ROC) curves in the form of cumulative true positive/false positive plots centred on a conservative 1% error rate (Fig. 2). These curves re-affirm the comparable performances between our algorithm and SPF-Cancer. In addition, these curves demonstrate the relatively poor performances of ‘generic’ computational prediction algorithms, such as SIFT and PolyPhen-2, when applied to predict the functional consequences of cancer-associated mutations.
Table 2.
Performance of computational prediction methods using the Capriotti and Altman benchmarking datasets
| Method | tp | fp | tn | fn | Accuracya | Precisiona | Specificitya | Sensitivitya | NPVa | MCCa |
|---|---|---|---|---|---|---|---|---|---|---|
| Cancer and neutral only (CNO) | ||||||||||
| SIFT | 2180 | 560 | 1266 | 982 | 0.69 | 0.69 | 0.69 | 0.69 | 0.69 | 0.38 |
| PolyPhen-2b | 2421 | 1244 | 1894 | 656 | 0.70 | 0.66 | 0.60 | 0.79 | 0.74 | 0.40 |
| Mutation Assessor | 2403 | 1004 | 2155 | 751 | 0.72 | 0.71 | 0.68 | 0.76 | 0.74 | 0.45 |
| SPF-Cancer | 2876 | 196 | 2967 | 287 | 0.92 | 0.94 | 0.94 | 0.91 | 0.91 | 0.85 |
| FATHMM | 2858 | 77 | 3077 | 300 | 0.94 | 0.97 | 0.98 | 0.91 | 0.91 | 0.88 |
| Cancer, neutral and other disease (CND) | ||||||||||
| SIFT | 2180 | 943 | 745 | 982 | 0.57 | 0.55 | 0.44 | 0.69 | 0.59 | 0.14 |
| PolyPhen-2b | 2421 | 1921 | 1238 | 656 | 0.56 | 0.54 | 0.34 | 0.79 | 0.62 | 0.14 |
| Mutation Assessor | 2403 | 1921 | 1238 | 751 | 0.58 | 0.56 | 0.39 | 0.76 | 0.62 | 0.17 |
| SPF-Cancer | 2876 | 418 | 2745 | 287 | 0.89 | 0.87 | 0.87 | 0.91 | 0.91 | 0.78 |
| FATHMM | 2858 | 161 | 2933 | 300 | 0.93 | 0.95 | 0.95 | 0.91 | 0.91 | 0.85 |
| Synthetic | ||||||||||
| SIFT | 2180 | 1431 | 1434 | 982 | 0.59 | 0.58 | 0.50 | 0.69 | 0.62 | 0.19 |
| PolyPhen-2b | 2421 | 1902 | 985 | 656 | 0.56 | 0.54 | 0.34 | 0.79 | 0.62 | 0.14 |
| Mutation Assessor | 2403 | 1474 | 1432 | 751 | 0.63 | 0.60 | 0.49 | 0.76 | 0.67 | 0.26 |
| SPF-Cancer | 2859 | 297 | 2866 | 304 | 0.90 | 0.91 | 0.91 | 0.90 | 0.90 | 0.81 |
| FATHMM | 2858 | 362 | 2710 | 300 | 0.89 | 0.88 | 0.88 | 0.91 | 0.90 | 0.79 |
Note: tp, fp, tn, fn refer to the number of true positives, false positives, true negatives and false negatives, respectively. Bold values indicate the best performing method across the corresponding performance statistics. aAccuracy, precision, specificity, sensitivity, NPV and MCC are calculated ‘from normalized numbers. b‘Possibly damaging’ predictions are classified as pathogenic.
Fig. 2.

ROC curves showing the cumulative true positive rate versus the cumulative false positive rate for the computational prediction algorithms evaluated in our independent benchmark
As our prediction threshold was derived using the same mutation datasets used in this benchmark (albeit using a leave-one-out analysis), and a large proportion of driver mutations is also present in our training data, we recognize the potential for bias in the observed performances. Therefore, to alleviate this bias, we further performed a 20-fold cross-validation procedure (Supplementary Table S3). We observed no significant deviations in the performance measures reported earlier in the text and, therefore, concluded that the performance of our algorithm is not an artefact of our weighting scheme.
Finally, to enable a direct (and fair) comparison between our algorithm and another leading computational prediction algorithm, CHASM (Carter et al., 2009), we performed the same 2-fold cross-validation procedure used in (Capriotti and Altman, 2011) using the synthetic dataset. Here, we observed an improved performance when using our algorithm (Table 3). Furthermore, we observed no significant deviations from our original performance measures reported earlier in the text.
Table 3.
A performance comparison using a 2-fold cross-validation procedure
| Method | Accuracy | Precision | Specificity | Sensitivity | NPV | MCC |
|---|---|---|---|---|---|---|
| CHASM | 0.80 | 0.85 | 0.87 | 0.73 | 0.76 | 0.60 |
| FATHMM | 0.87 | 0.88 | 0.88 | 0.86 | 0.86 | 0.74 |
Note: The performances of CHASM have been reproduced with permission from Capriotti and Altman (2011), Copyright 2013, Elsevier. Bold values indicate the best performing method across the corresponding performance statistics.
3.3 A performance comparison with a published review
In addition to performing our own benchmark, we downloaded and used the Gonzalez-Perez et al. (2012) benchmark (comprising nine mutation datasets) to compare the performance of our algorithm with four alternative computational prediction algorithms: SIFT (Ng and Henikoff, 2001), PolyPhen-2 (Adzhubei et al., 2010), Mutation Assessor (Reva et al., 2011) and TransFIC (Gonzalez-Perez et al., 2012). For this analysis, we opted to compare our algorithm with the Mutation Assessor TransFIC, as it has been shown to outperform the SIFT TransFIC and PolyPhen-2 TransFIC. In accordance with (Gonzalez-Perez et al., 2012), and to enable a fair comparison to be made between our algorithm and the Mutation Assessor TransFIC, we adjusted our prediction thresholds across the nine mutation datasets to maximize the Matthews correlation coefficient (MCC) of our algorithm. Here, our algorithm outperforms SIFT, PolyPhen-2 and Mutation Assessor across all mutation datasets. In addition, it seems our algorithm is comparable with the Mutation Assessor TransFIC (Table 4). The performance of our algorithm using our standard prediction threshold is documented in Supplementary Table S4.
Table 4.
Performance of computational prediction methods using the Gonzalez-Perez et al. benchmarking datasets
| Dataset | SIFT |
PolyPhen-2 |
Mutation assessor |
TransFIC |
FATHMM |
||||||
|---|---|---|---|---|---|---|---|---|---|---|---|
| Acc. | MCC | Acc. | MCC | Acc. | MCC | Acc. | MCC | Acc. | MCC | Threshold | |
| COSMIC 2 + 1 | 0.49 | 0.10 | 0.59 | 0.06 | 0.30 | 0.80 | 0.93 | 0.50 | 0.93 | 0.63 | −3.50 |
| COSMIC 5 + 1 | 0.49 | 0.12 | 0.60 | 0.09 | 0.32 | 0.90 | 0.97 | 0.57 | 0.95 | 0.57 | −3.50 |
| COSMIC 2/POL | 0.70 | 0.32 | 0.79 | 0.39 | 0.80 | 0.91 | 0.93 | 0.86 | 0.93 | 0.84 | −1.50 |
| COSMIC 5/POL | 0.71 | 0.32 | 0.86 | 0.41 | 0.71 | 0.96 | 0.98 | 0.76 | 0.97 | 0.89 | −1.50 |
| COSMIC D/O | 0.48 | 0.09 | 0.61 | 0.10 | 0.18 | 0.78 | 0.88 | 0.25 | 0.90 | 0.35 | −3.00 |
| COSMIC D/POL | 0.70 | 0.29 | 0.85 | 0.42 | 0.64 | 0.92 | 0.94 | 0.69 | 0.95 | 0.86 | −0.75 |
| COSMIC CGC/NONCGC | 0.44 | 0.08 | 0.56 | 0.07 | 0.16 | 0.78 | 0.85 | 0.50 | 0.91 | 0.55 | −1.60 |
| WG 2/1 | 0.84 | 0.02 | 0.71 | 0.01 | 0.10 | 0.89 | 0.96 | 0.23 | 0.97 | 0.31 | −3.50 |
| WG CGC/NONCGC | 0.42 | 0.11 | 0.56 | 0.11 | 0.34 | 0.90 | 0.94 | 0.52 | 0.95 | 0.39 | −2.80 |
Note: The performances of alternative computational prediction algorithms have been reproduced with permission from Gonzalez-Perez et al. (2012; Open Access Article). Bold values indicate the best performing method across the corresponding benchmark.
3.4 Benefits of a disease-specific weighting scheme
To better understand the potential benefits of incorporating a cancer-specific weighting scheme into our algorithm, we compared the score/prediction assignments for all mutations in the Capriotti and Altman (2011) benchmark using a cancer-specific weighting scheme with the score/prediction assignments for the same mutations using our original inherited-disease weighting scheme. As expected, the odds of identifying driver and passenger mutations were 7.92 (CI: 6.82, 9.22) and 1.95 (CI: 1.69, 2.25) times greater, respectively, when using a cancer-specific weighting scheme. Furthermore, the odds of correctly identifying other disease-causing mutations as having no effect on tumour progression were 75.48 (CI: 59.70, 96.17) times greater when using a cancer-specific weighting scheme. The observed performance gain illustrates the ability of our algorithm to not only distinguish between driver and passenger mutations but also to discriminate between cancer-associated mutations and other germ line mutations (both disease-associated and neutral polymorphisms).
4 DISCUSSION
In this article, we described an adaptation to the Functional Analysis through Hidden Markov Models (FATHMM) algorithm (Shihab et al., 2013) in which a cancer-specific weighting scheme was incorporated to potentiate the functional analysis of driver mutations. The performance of our method was then benchmarked against four alternative computational prediction algorithms: SIFT (Ng and Henikoff, 2001) and PolyPhen-2 (Adzhubei et al., 2010), Mutation Assessor (Reva et al., 2011) and SPF-Cancer (Capriotti and Altman, 2011); using the Capriotti and Altman (2011) benchmarking datasets. In terms of performance accuracies, FATHMM seems to be the best performing method available when assigned with the task of distinguishing between driver mutations and other germ line polymorphisms (both disease-causing and neutral). Furthermore, when tasked with discriminating between driver and passenger mutations (somatic), our method seems to perform as well as the alternative leading prediction algorithm: SPF-Cancer. Although the performance of our algorithm in this category does not represent an improvement over SPF-Cancer, our method offers a large-scale/high-throughput batch submission facility capable of analysing all foreseeable genomic/cancer datasets—an important facility that is not offered with SPF-Cancer. In addition, to facilitate a comparison between our algorithm and another leading computational prediction algorithm: CHASM (Carter et al., 2009), we performed a 2-fold cross-validation procedure and observed an improved performance when using our method. We also compared the performance of our algorithm with four computational prediction algorithms: SIFT (Ng and Henikoff, 2001), PolyPhen-2 (Adzhubei et al., 2010), Mutation Assessor (Reva et al., 2011) and TransFIC (Gonzalez-Perez et al., 2012), using a published benchmark (Gonzalez-Perez et al., 2012). Once again, we observed improved performance accuracies over traditional computational prediction algorithms: SIFT, PolyPhen-2 and Mutation Assessor; and we noted comparable performances with the Mutation Assessor TransFIC.
In any fair comparison, care should be taken to reduce the potential overlap between the mutation datasets used for training and testing; however, this level of testing is not possible, as it would require obtaining and retraining each algorithm with common datasets. To remove the potential bias in our results, we performed a 20-fold cross-validation procedure across our benchmark. From this analysis, we observed no significant deviations in the performance of our algorithm and, therefore, concluded that the performances observed were not an artefact of the weighting scheme used.
The potential benefits of incorporating cancer-specific information into our predictions were assessed by comparing the performance of our cancer-specific weighting scheme with the performance of our original inherited-disease weighting scheme. In accordance with previous findings (Kaminker et al., 2007a), we observed some similarities in driver scores/predictions between the two weighting schemes. However, we noted improved odds in identifying driver/passenger mutations using a cancer-specific weighting scheme. Unsurprisingly, we also noted significantly improved odds in correctly classifying disease-causing (non-neoplasm) mutations as having no effect on tumour progression. Therefore, by incorporating a cancer-specific weighting scheme, we have shown that our method is capable of identifying mutations that directly contribute to carcinogenesis, irrespective of other underlying disease associations.
To facilitate the analysis of large-scale cancer genomic datasets, our public web server (available at http://fathmm.biocompute.org.uk) provides unrestricted and near instant predictions for all possible amino acid substitutions within the human proteome. For example, we were capable of annotating the entire COSMIC (Bamford et al., 2004) database—comprising of over half a million mutations—in <1 h using a single processing core. In addition, we also provide an open-source software package allowing users to run our algorithm using their high-performance computing systems.
Supplementary Material
ACKNOWLEDGEMENTS
The authors thank Dr Philip Guthrie for his help in reviewing the manuscript.
Funding: This work was supported by the UK Medical Research Council (MRC) and was carried out in the Bristol Centre for Systems Biomedicine (BCSBmed) Doctoral Training Centre (director INMD) using the computational facilities of the Advanced Computing Research Centre, University of Bristol—http://www.bris.ac.uk/acrc. T.R.G. and I.N.M.D. acknowledge financial support from the MRC [G1000427]. J.G.’s contribution was supported by Biotechnology and Biological Sciences Research Council (BBSRC) [BB/G022771]. D.N.C. gratefully acknowledges the financial support of BIOBASE GmbH.
Conflict of Interest: none declared.
REFERENCES
- Adzhubei IA, et al. A method and server for predicting damaging missense mutations. Nat. Methods. 2010;7:248–249. doi: 10.1038/nmeth0410-248. [DOI] [PMC free article] [PubMed] [Google Scholar]
- Apweiler R, et al. UniProt: the Universal Protein knowledgebase. Nucleic Acids Res. 2004;32:D115–D119. doi: 10.1093/nar/gkh131. [DOI] [PMC free article] [PubMed] [Google Scholar]
- Bamford S, et al. The COSMIC (Catalogue of Somatic Mutations in Cancer) database and website. Br. J. Cancer. 2004;91:355–358. doi: 10.1038/sj.bjc.6601894. [DOI] [PMC free article] [PubMed] [Google Scholar]
- Bao L, et al. nsSNPAnalyzer: identifying disease-associated nonsynonymous single nucleotide polymorphisms. Nucleic Acids Res. 2005;33:W480–W482. doi: 10.1093/nar/gki372. [DOI] [PMC free article] [PubMed] [Google Scholar]
- Bromberg Y, Rost B. SNAP: predict effect of non-synonymous polymorphisms on function. Nucleic Acids Res. 2007;35:3823–3835. doi: 10.1093/nar/gkm238. [DOI] [PMC free article] [PubMed] [Google Scholar]
- Calabrese R, et al. Functional annotations improve the predictive score of human disease-related mutations in proteins. Hum. Mutat. 2009;30:1237–1244. doi: 10.1002/humu.21047. [DOI] [PubMed] [Google Scholar]
- Capriotti E, et al. Predicting the insurgence of human genetic diseases associated to single point protein mutations with support vector machines and evolutionary information. Bioinformatics. 2006;22:2729–2734. doi: 10.1093/bioinformatics/btl423. [DOI] [PubMed] [Google Scholar]
- Capriotti E, Altman RB. A new disease-specific machine learning approach for the prediction of cancer-causing missense variants. Genomics. 2011;98:310–317. doi: 10.1016/j.ygeno.2011.06.010. [DOI] [PMC free article] [PubMed] [Google Scholar]
- Carter H, et al. Cancer-specific high-throughput annotation of somatic mutations: computational prediction of driver missense mutations. Cancer Res. 2009;69:6660–6667. doi: 10.1158/0008-5472.CAN-09-1133. [DOI] [PMC free article] [PubMed] [Google Scholar]
- Eddy SR. A new generation of homology search tools based on probabilistic inference. Genome Inform. 2009;23:205–211. [PubMed] [Google Scholar]
- Furney SJ, et al. Structural and functional properties of genes involved in human cancer. BMC Genomics. 2006;7:3. doi: 10.1186/1471-2164-7-3. [DOI] [PMC free article] [PubMed] [Google Scholar]
- Futreal PA, et al. A census of human cancer genes. Nat. Rev. Cancer. 2004;4:177–183. doi: 10.1038/nrc1299. [DOI] [PMC free article] [PubMed] [Google Scholar]
- Gonzalez-Perez A, et al. Improving the prediction of the functional impact of cancer mutations by baseline tolerance transformation. Genome Med. 2012;4:89. doi: 10.1186/gm390. [DOI] [PMC free article] [PubMed] [Google Scholar]
- Gough J, et al. Assignment of homology to genome sequences using a library of hidden Markov models that represent all proteins of known structure. J. Mol. Biol. 2001;313:903–919. doi: 10.1006/jmbi.2001.5080. [DOI] [PubMed] [Google Scholar]
- Greenman C, et al. Patterns of somatic mutation in human cancer genomes. Nature. 2007;446:153–158. doi: 10.1038/nature05610. [DOI] [PMC free article] [PubMed] [Google Scholar]
- Hanahan D, Weinberg RA. Hallmarks of cancer: the next generation. Cell. 2011;144:646–674. doi: 10.1016/j.cell.2011.02.013. [DOI] [PubMed] [Google Scholar]
- Iengar P. An analysis of substitution, deletion and insertion mutations in cancer genes. Nucleic Acids Res. 2012;40:6401–6413. doi: 10.1093/nar/gks290. [DOI] [PMC free article] [PubMed] [Google Scholar]
- Kaminker J, et al. Distinguishing cancer-associated missense mutations from common polymorphisms. Cancer Res. 2007a;67:465–473. doi: 10.1158/0008-5472.CAN-06-1736. [DOI] [PubMed] [Google Scholar]
- Kaminker J, et al. CanPredict: a computational tool for predicting cancer-associated missense mutations. Nucleic Acids Res. 2007b;35:W595–W598. doi: 10.1093/nar/gkm405. [DOI] [PMC free article] [PubMed] [Google Scholar]
- Kullback S, Leibler RA. On information and sufficiency. Ann. Math. Stat. 1951;22:79–86. [Google Scholar]
- Li B, et al. Automated inference of molecular mechanisms of disease from amino acid substitutions. Bioinformatics. 2009;25:2744–2750. doi: 10.1093/bioinformatics/btp528. [DOI] [PMC free article] [PubMed] [Google Scholar]
- Li J, et al. CanProVar: a human cancer proteome variation database. Hum. Mutat. 2010;31:219–228. doi: 10.1002/humu.21176. [DOI] [PMC free article] [PubMed] [Google Scholar]
- Mort M, et al. In silico functional profiling of human disease-associated and polymorphic amino acid substitutions. Hum. Mutat. 2010;31:335–346. doi: 10.1002/humu.21192. [DOI] [PMC free article] [PubMed] [Google Scholar]
- Ng PC, Henikoff S. Predicting deleterious amino acid substitutions. Genome Res. 2001;11:863–874. doi: 10.1101/gr.176601. [DOI] [PMC free article] [PubMed] [Google Scholar]
- Ramensky V, et al. Human non-synonymous SNPs: server and survey. Nucleic Acids Res. 2002;30:3894–3900. doi: 10.1093/nar/gkf493. [DOI] [PMC free article] [PubMed] [Google Scholar]
- Reva B, et al. Predicting the functional impact of protein mutations: application to cancer genomics. Nucleic Acids Res. 2011;39:e118. doi: 10.1093/nar/gkr407. [DOI] [PMC free article] [PubMed] [Google Scholar]
- Sasidharan Nair P, Vihinen M. VariBench: a benchmark database for variations. Hum. Mutat. 2013;34:42–49. doi: 10.1002/humu.22204. [DOI] [PubMed] [Google Scholar]
- Shihab HA, et al. Predicting the functional, molecular, and phenotypic consequences of amino acid substitutions using hidden Markov models. Hum. Mutat. 2013;34:57–65. doi: 10.1002/humu.22225. [DOI] [PMC free article] [PubMed] [Google Scholar]
- Sonnhammer EL, et al. Pfam: a comprehensive database of protein domain families based on seed alignments. Proteins. 1997;28:405–420. doi: 10.1002/(sici)1097-0134(199707)28:3<405::aid-prot10>3.0.co;2-l. [DOI] [PubMed] [Google Scholar]
- Thomas PD, et al. PANTHER: a library of protein families and subfamilies indexed by function. Genome Res. 2003;13:2129–2141. doi: 10.1101/gr.772403. [DOI] [PMC free article] [PubMed] [Google Scholar]
- Thusberg J, et al. Performance of mutation pathogenicity prediction methods on missense variants. Hum. Mutat. 2011;32:358–368. doi: 10.1002/humu.21445. [DOI] [PubMed] [Google Scholar]
- Vihinen M. How to evaluate performance of prediction methods? Measures and their interpretation in variation effect analysis. BMC Genomics. 2012;13:S2. doi: 10.1186/1471-2164-13-S4-S2. [DOI] [PMC free article] [PubMed] [Google Scholar]
Associated Data
This section collects any data citations, data availability statements, or supplementary materials included in this article.