

Abstract
An important topic in systems biology is the reverse engineering of regulatory mechanisms through reconstruction of context-dependent gene networks. A major challenge is to identify the genes and the regulations specific to a condition or phenotype, given that regulatory processes are highly connected such that a specific response is typically accompanied by numerous collateral effects. In this study, we design a multi-layer approach that is able to reconstruct condition-specific genes and their regulation through an integrative analysis of large-scale information of gene expression, protein interaction and transcriptional regulation (transcription factor-target gene relationships). We establish the accuracy of our methodology against synthetic datasets, as well as a yeast dataset. We then extend the framework to the application of higher eukaryotic systems, including human breast cancer and Arabidopsis thaliana cold acclimation. Our study identified TACSTD2 (TROP2) as a target gene for human breast cancer and discovered its regulation by transcription factors CREB, as well as NFkB. We also predict KIF2C is a target gene for ER−/HER2− breast cancer and is positively regulated by E2F1. The predictions were further confirmed through experimental studies.
Availability: The implementation and detailed protocol of the layer approach is available at http://www.egr.msu.edu/changroup/Protocols/Three-layer%20approach%20to%20reconstruct%20condition.html.
Contact: krischan@egr.msu.edu
Supplementary information: Supplementary data are available at Bioinformatics online.
1 INTRODUCTION
The accumulation of high-throughput transcriptome data has driven the development and application of computational approaches to infer networks, elucidate gene regulation and identify targets. Initial network inference methods based on gene expression data were successful with prokaryotes (Faith et al., 2007). However, higher eukaryotes systems, with their higher number of genes, provided many more candidate genes (several hundred) and interactions (more than a thousand) [e.g. (Jaffrezic and Tosser-Klopp, 2009; Stephanopoulos et al., 2004)]. This generates numerous hypotheses, and with this sheer number, most of the candidates cannot be investigated or validated through experiments, making it difficult to assess the utility of the proposed approach on these systems.
Generating too many hypotheses arises, in part, due to disconnect between the computational and biological assumptions applied in the models. The direct applications of learning/mining methods aim to infer ‘functional interactions’ in accordance with certain presumed mathematical definitions, which may not be appropriate in a biological context. For example, biologically, the ‘candidate genes’ specific to a phenotype usually refer to genes that assume a major response for a condition or to causal genes involved in the development of a phenotype. In contrast, computationally, statistical analyses are applied to identify those that are expressed differentially that help to classify two conditions (Saeys et al., 2007), which does not define causal genes. In a biological context, interactions refer to direct physical or regulatory interactions, whereas computationally the interactions inferred are statistical correlations between gene expression that may not necessary indicate direct regulatory relationships (Markowetz and Spang, 2007; Segal et al., 2003; Wang et al., 2003; Werhli et al., 2006). To address this challenge, one could develop a model based on the biological question to be addressed. For example, a correlation between two genes could suggest ‘regulating’, ‘being regulated’ or an indirect relationship in a biological context. The model of ARANCE assumes indirect interactions should have lower correlations and is thereby able to predict transcriptional interaction by removing the indirect interactions (Margolin et al., 2006). Alternatively, incorporating physical interactions by integrating protein–protein interaction (PPI) and protein–DNA (P-DNA) data with gene expression data could help bridge and facilitate the interpretation of the computational results into biological context (Chuang et al., 2007; Ideker et al., 2002; Ulitsky and Shamir, 2007). In these previous studies, the genes are selected based on differential expression and correlation analyses and then superimposed onto a physical interaction network, which helped to interpret the identified genes/interactions.
Nevertheless, the aforementioned approaches still will provide large numbers of hypotheses with hundreds of genes and interactions identified in the reconstructed network. Notably, a majority of the candidate genes/interactions are often related to general processes that are not specifically responsive to the condition being investigated. With this large number of possible candidates literature search to ‘manually’ characterize many of these predicted candidates are typically performed to identify specific targets for further experimental investigation based on one’s expertise. Alternatively, enrichment analysis, such as gene set enrichment analysis (GSEA) (Subramanian et al., 2005) and GO (http://www.geneontology.org/) annotations have been applied in many reverse engineering studies to interpret the results, which provide understanding of the ‘general’ processes involved rather than the direct molecular mechanisms.
Another challenge is that a majority of the reconstruction methods used to identify transcriptional interactions/regulations are based on correlation. However, an absence of a correlation does not preclude a possible regulatory relationship, e.g. post-transcriptionally regulated interactions, including RNA processing, post-translational modifications (e.g. phosphorylation) or co-factors of transcription factors (TFs). Note that analyses of gene expression cannot distinguish the effect of RNA processing, protein modifications or protein co-factors; thus, all these events are considered as ‘post-transcriptional’ effects on the TF activity in this study, and throughout this article. Although more recently, methods have been developed to uncover these potential post-transcriptional interactions (Lefebvre et al., 2010; Wang et al., 2009). Notably these recent methods are not ‘reconstruction approach’ in the strict sense and further require expert knowledge that the user must provide. For example, the user has to provide the TF and target gene pair along with a list of potential regulators to determine the potential post-transcriptional modulators.
The overall objective here is to provide regulatory hypotheses that are more specific to the condition of interest rather than those related to general responses. Our approach separates the network reconstruction into multiple levels, each addressing a specific biological question wherein a particular scenario of biological regulation is modeled. There are two major steps; first is to identify the candidate genes that are specific to the phenotype and have distinct expression pattern under the condition of interest (layer I). We note that the problem of generating too many hypotheses is because the predictions are not specific enough. For example, in biological systems, a specific and direct response to a perturbation usually is accompanied by a cascade of collateral effects on many genes and dozens of regulatory modules in the network. For example, Stephanopoulos et al. (2004) showed that in an experiment that knocked out the GAL80 gene in yeast, and comparing the transcriptomes before and after the treatment showed that such modulation of a single pathway eventually caused a global effect throughout the whole biomolecular interaction network. The specific response of the knock out experiment is the activation of the galactose-processing pathways by eliminating GAL80’s repression on the GAL4 transcription factor; nevertheless, the repression of this one pathway resulted in hundreds of differentially expressed genes and dozens of activated modules, making it difficult to identify the essential ‘trigger’, i.e. the specific pathway in response to the perturbation. Therefore, in a typical network inference or module analysis, many of the genes and modules identified would likely be such ‘side effects’ or collateral responses rather than direct and specific effects. For example (Yang et al., 2010) in identifying the activity of the p450 gene in human liver, network analysis (clustering and network reconstruction based on correlation) identified >5000 differentially expressed traits spanning many general functional modules including immune response, cell cycle, lipid metabolism, macromolecule biosynthesis and so forth. This provides a ‘rough measurement’ of the overall influence, but it is difficult to identify from this list the specific pathway(s) that regulates these effects and to guide the experimental design for further in-depth functional studies. Therefore, the specific responses are usually concealed by many less specific effects, which are difficult to distinguished based on current network analysis methods.
We address this challenge by taking an alternative approach to identify the target genes that are specific for the condition of interest, and which may not necessary be hubs in a network (Basso et al., 2005). Our approach compares the condition of interest with multiple conditions, where the multiple conditions are grouped together, which is in contrast to current studies that evaluate multiple conditions (Churchill, 2004; McCarthy et al., 2012; Smyth, 2004). Thus, in this first step of our network reconstruction framework, we integrate microarray data from a diverse set of conditions to provide a common context (more and better controls) for the expression behaviors of the genes and apply advanced feature selection technique to identify the target genes that are most specific to the condition being investigated. Incorporating these diverse conditions for comparison in the feature selection of genes and interactions reduces the false-positive rate and enhances the specificity.
The second step of our method identifies the TFs of these genes, including post-transcriptionally regulated TFs, by incorporating interaction data to account for the TF activity, beyond the expression level of the TF. Thus, from these ‘specific’ target genes identified in layer I, the network is expanded in layer II based on known and predicted interactions with these genes, obtained from the PPI and protein–DNA networks, which provides conditional gene regulations. A filtering approach based on mutual information is applied to the physical interaction network to reconstruct the regulatory pathway from the candidate genes. In layer III, we infer the conditional TF activity to identify the major regulators in the gene network, accounting for post-transcriptional regulation. The multiple layers of learning with their distinct biological assumptions at each level capture different biological features in the regulation to achieve reconstruction of condition-specific gene networks that account for both transcriptional and post-translational molecular interactions. We establish the accuracy of our methodology against synthetic datasets, as well as a yeast dataset. Finally, we extend the framework to the application of higher eukaryotic systems.
2 METHODS
2.1 Assumptions
The specific genes: we define the genes that are ‘specific for a condition or phenotype’ as the genes that have distinct expression pattern that are unique to the condition of interest (thus, the biological phenotype in the condition is represented by unique combination of expressions). Genes that can be identified as differentially expressed by comparing two conditions in the traditional setting may not necessary be ‘specific’ genes, as they could include genes involved in collateral changes on general processes. Nevertheless, when a gene is identified to be specific for a given condition, it does not preclude the possibility that the gene plays a role in other conditions, just that it may play a more significant role for the given condition, and thus is ranked higher under this condition than in other conditions, which contributes to their distinct expression pattern. A limitation in identifying these specific genes is that there could be genes that encode for proteins that are expressed at a similar level but have functional changes across conditions (e.g. because of post-transcriptional modifications), these targets will not be identified from gene expression data. We do not assume the gene expression to be independent, and we do not use linear combination of genes as in discriminant analysis to identify genes, as the biological meaning of such linear combination of expression is unclear.
The specific interactions: we defined the specific interactions as the regulations by TFs of the specific genes, which could be responsible for the distinct expression pattern of these genes under the condition of interest. In layer II, similar to previous network reconstruction approaches, we assume the TFs’ and their target genes’ expression are correlated to some degree, and more importantly, there should be an increase in correlation for the condition where a TF is activated. It is possible that a TF’s activity depends on its co-factors; thus, the interacting proteins of a TF are also taken into account when computing the correlations. The potential connections are based on P-DNA (for TF–gene) and PPI (for protein–TF) information, and then these interactions are scored by computing the conditional mutual information (MI)—unconditional MI to determine interactions that are condition specific (higher conditional MI than unconditional MI). In layer III, a correlation between the expression of the TFs and their target genes is not assumed. To account for TF activity, the putative target genes’ expression is assumed to reflect the TF activity. Intuitively, a TF could be activated if many of its putative targets suddenly seem to be highly expressed for a given condition. However, that does not suggest or assume that the TF can regulate these targets under all conditions, or that the TF should regulate all of its targets for any given condition. Thus, the assumption in layer III is similar to MARINa (GSEA) in which the information of the putative targets is used in estimating the TF activity. The information would not need to be complete, but the quality of the putative target is important to achieve a good estimation of the TF activity, as false positives could introduce irrelevant effects. Thus, in layer III when applied to the human and plant datasets, the putative targets are restricted to those that are identified from the literature-curated databases.
2.2 Identification of features
To identify features (genes and TFs) that can distinguish one phenotype from all the other phenotypes, we need an approach that from a biological perspective should fulfill the following requirements: (i) the approach should weigh and rank genes according to their ‘importance’. (ii) The approach should account for the fact that features (genes) are not all independent. Gene expression is controlled by a complex regulatory network; thus, there are intrinsic relationships between genes. (iii) There are relationships between phenotypes whereby some phenotypes have transcriptomes similar to our phenotype of interest; these phenotypes should be more relevant for comparison to understand the unique changes in our conditions.
Therefore, the approach should adopt a learning model that fulfills these requirements:
- A selection process that maps from the original feature space X to a new feature space X’, by scaling each dimension with weight w.

To account for the fact that features (genes) are not all independent, each feature should be evaluated in the context of other features and samples, which suggests a ‘local learning’ model.
By comparing the transcriptomes, for a sample xn, we attempt to find its ‘nearest neighbor’ of the same phenotype is Hxn, whereas its nearest neighbor from a different phenotype is Mxn and define a ‘margin’: ρn = d(xn ,Mxn) −d(xn ,Hxn). We try to find a mapping such that the distance between the different phenotypes d(xn,Mxn) are as large as possible, whereas samples within a phenotype d(xn,Hxn) are as close as possible. Hence, the problem can be formularized to maximize the margin:
Based on the modeling, there is a family of algorithm called ‘Relief’ that can solve this optimization problem, which we applied to identify the most specific genes and TFs for a given phenotype.
2.3 The ReliefF algorithm
The basics of the ReliefF algorithm (Kononenko, 1994; Robnik-Šikonja and Kononenko, 2003) are provided in the Supplementary Methods. When ReliefF is used to identify condition-specific genes, the feature vector for each gene is the expression of the gene in different samples. When ReliefF is used to identify condition-specific TF activity change, the feature vector for each TF is the summation of the expression of its target genes in different samples based on the TRN (potential transcriptional regulatory network, see Supplementary Methods).
2.4 Identification of regulatory relationships
We compute the differences between conditional mutual information and unconditional mutual information:
MI(gene pair|condition) −MI(gene pair in all conditions)
for genes on paths to the target genes in the reference physical interaction network (PPI and P-DNA network), and each gene pair consists a potential ‘regulator’ and a ‘target gene’ in the network (Supplementary Methods).
2.5 Datasets
We used yeast, human and plant gene expression datasets, PPI data and P-DNA interaction data (see Supplementary Methods).
2.6 Experimental studies
We performed experimental studies on human mammary epithelial and breast cancer cell lines. The detail methods of the cell culture, quantitative real-time polymerase chain reaction (RT–PCR), western blotting, RNA interferences and the statistical analysis of RT–PCR results are in the Supplementary Methods.
3 RESULTS
3.1 Layer I. Identification of candidate genes
In contrast to traditional microarray analysis where one compares the condition(s) of interest with a single ‘untreated’ condition as the control, we propose that integrating multiple conditions of gene expression data and applying a context-sensitive algorithm ReliefF (see Section 2) identifies the genes that specifically respond to the condition being investigated. Unlike previous applications of pairwise comparison with ReleifF (Wang, 2004), we apply ReliefF to a diverse set of conditions. To model this, we generate a simulated expression dataset (Fig. 1A and Supplementary Methods) with specific and general changes for each condition. Different methods are applied to identify the genes that change uniquely for a given condition (condition A in Fig. 1A). The ROC curves in Figure 1B shows that ReliefF applied on multiple conditions performs best.
Fig. 1.
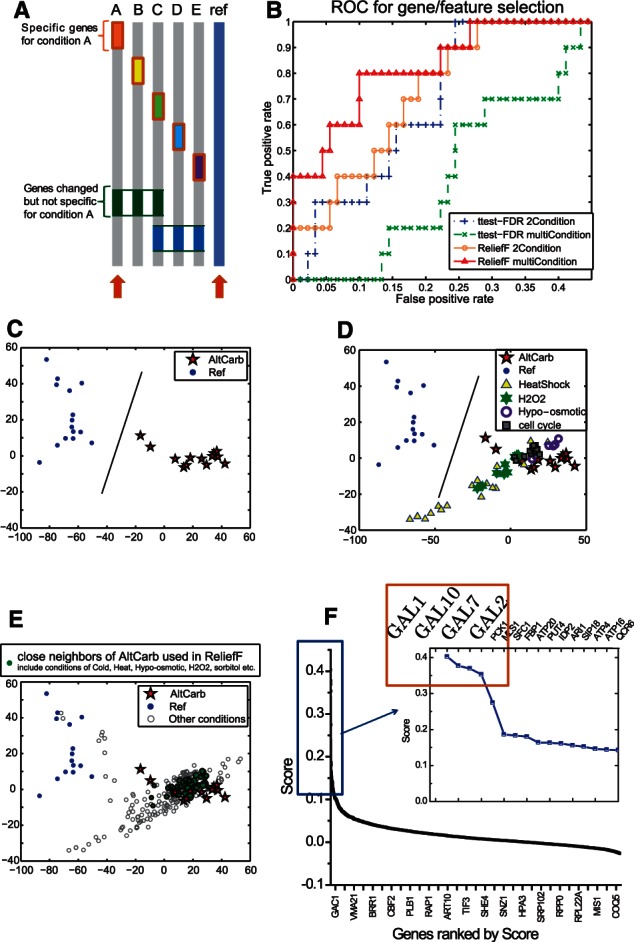
Application of ReliefF on the integrated dataset with multiple conditions. (A) The data are a simulated dataset with five conditions (conditions A–E) plus a reference condition (ref). The goal is to identify the genes that change uniquely for a given condition (condition A). Traditional approach compares condition A with the reference condition, whereas we suggest applying ReliefF on condition A against all the other conditions that are available. (B) The ROC curves for identification of specific genes for the condition of interest (condition A). We compare two different approaches: traditional approach based on t-test and the ReliefF algorithm; under two different scenarios: with only condition A and reference control, and integrating all the conditions available and comparing against condition A. The AUC (area under curve): ReliefF with multiple conditions > ReliefF with two conditions > t-test with two conditions > t-test with multiple conditions. (C–E) The ‘MEGA’ yeast microarray dataset: the samples are plotted in 2D with their first two principle components. The condition ‘AltCarb’ is the condition of interest. (C) A traditional treated/untreated analysis. (D) We plot other conditions, such as hyperoxide stimulation, heat stress, etc. The samples of these conditions are similar to samples in the ‘AltCarb’ condition as compared with the same ‘untreated’ reference samples; thus, the gene lists that are identified could be similar. (E) The integrated dataset provides better coverage of the sample space, and ReliefF compares ‘AltCarb’ samples with all other samples in different conditions to achieve better specificity. Nearest neighbors of AltCarb condition used in the ReliefF procedure are shown in green. The Principle Component Analysis (PCA) plot and ReliefF are performed in MATLAB with customized codes. (F) The score of the yeast genes provided by the ReliefF analysis correlates with the importance or relevance of the gene to the specific condition
We then evaluate our approach by reconstructing a gene network for the ‘AltCarb’ condition, i.e. adding extra alternative carbon source, in which the essential regulatory pathway is known a priori—namely, the GAL pathway. When adding extra carbon sources into the yeast media, if the carbon source is galactose, the GAL pathway, also known as the ‘Leloir pathway’ will turn ON, if it is other types of carbon source, such as glucose, the Leloir pathway is turned OFF leading to ‘glucose repression’ (Rubio-Texeira, 2005). A successful gene selection procedure is expected to identify the entire GAL pathway—the four GAL genes (GAL1, GAL2, GAL7 and GAL10), which are the essential transporters and enzymes for this condition.
In contrast to traditional analysis where conditions are compared with a same, untreated reference (Fig. 1C–D), our algorithm analyzes an integrated reference pool (we use the ‘MEGA yeast’ dataset, see Supplementary Methods) as a representation of the diversity of gene expression behaviors to identify the most specific genes for a target condition (Fig. 1E). The scoring of the genes for the ‘AltCarb’ condition by ReliefF is shown in Figure 1F. The four GAL genes are ranked as the top four genes by ReliefF, and their scores (0.3–0.4) are much higher than the rest of the other genes (majority of which scored <0.2). Therefore, our approach is able to re-discover all four specific genes in the yeast Leloir pathway, which constitutes the core metabolic processing by yeast in response to changes in the carbon sources.
To compare with a traditional approach, we also performed a per-gene permutation-based t-test between the galactose treated and the control (untreated) yeast samples, which is a standard method often applied to microarray analysis to uncover differential expression. This analysis identified 236 genes (P < 0.01) with GAL7, GAL2, GAL1, GAL10 ranked at 17th, 53rd, 87th and 124th, respectively, based on their P-value. Many of the genes identified are related to more general processes of stress or environmental changes, e.g. MSN2/4 for general stress responses, which are not directly associated with the condition under investigation. Therefore, our approach identified the most likely effectors, and the integration of multiple seemingly unrelated conditions, in fact, effectively reduced the number of non-specific gene candidates.
3.2 Layer II. Identification of the potential gene regulatory relationships
To explore the regulatory mechanisms of the candidate gene ‘effectors’ identified in layer I for a given condition, we integrate PPI and P-DNA or TRN (from motif search, ChIP-chip data or literature information if available) data of the same system (denoted as the reference network) and apply mutual information on the expression data to identify potential regulators of these target genes.
Traditional approaches to determine gene regulatory relationship are commonly based on mutual information (or correlation) between pairs of genes (Ideker et al., 2002; Li et al., 2007; Margolin et al., 2006), with comparison between a condition of interest and a reference condition. Instead of using a single ‘untreated’ reference condition, we suggest incorporating multiple conditions to provide a better reference pool and compute the difference between the conditional and unconditional mutual information (see Section 2 and Supplementary Methods). This idea is essentially an extension of the two-way relationship (gene x and gene y) to three-way dependencies (gene-pair x1, x2 and y) in calculating the mutual information from gene expression, such that the regulators of y, genes x1 and x2 could be readily distinguished. This approach, also called causal-filtering, was initially suggested by Bontempi and Meyer (2010).
Therefore, Layer II can be used to identify the factors (i.e. genes or proteins) that directly (physically) interact with and causally regulate the target genes. The information on the physical interactions is derived from PPI and protein–DNA interaction data, and the potential causal factors are inferred based on the condition mutual information computed from the gene expression data of these interactions.
We establish the accuracy of our methodology against a yeast dataset of conditional TF binding. There are 34 ChIP-chip datasets for yeast samples treated with H2O2 (Harbison et al., 2004). We used the TF–gene binding indicated in these conditional ChIP-chips experiments (with binding P-value <0.001) as the true TF–gene regulatory relationships, and applied our method in layer II to infer conditional regulatory information for these 34 TFs. Figure 2 shows the ROC curves for inferring the TF–gene regulatory relationships. Incorporating information of potential TRN based on binding motifs on the gene promoters and literature information (solid lines in different colors) significantly reduce the false-positive rate as compared with approaches that do not take advantage of such information, shown in dotted lines (e.g. mutual information only based approaches). Our approach of incorporating multiple conditions enhances the specificity, which is shown by the red solid and dotted lines (corresponding to with and without TRN) as compared with the traditional setting denoted by the green solid and dotted lines.
Fig. 2.
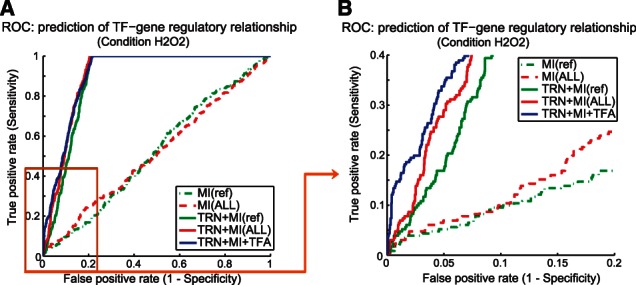
The ROC curves for inferring TF–gene regulatory relationships. (A) The ROC curve for TF–gene relationships predicted. (B) Part of the ROC curve for the top 20% of the predictions. The prediction of TF–gene regulatory relationships are based on mutual information (MI) between TFs and their target genes. The traditional setting is MI(condition of interest) − MI(a ref condition), shown in green dotted lines, whereas we propose to use a variety of conditions as reference: MI(condition of interest) − MI(multiple conditions as refs), shown in red dotted lines. We apply the same approaches but incorporate the information of potential TRN based on binding motifs and other literature evidences (data from www.yeastract.com), shown in solid lines, green: traditional setting compared with reference condition, red: compared with a variety of conditions as reference. Further, we use the sum of the target gene expression as a feature of TF activity for a given condition and apply ReliefF to identify the TFs and genes that have distinct activity and expression profile for the condition of interest (H2O2). Those TF–gene pairs with significant changes (top 30) on both TF activity and gene expression are elevated to the top of the list of potential TF–gene regulatory relationship based on MI measurement of the multiple condition setting. The result is shown in blue solid lines
We applied layer II on the yeast ‘AltCarb’ condition to reconstruct a condition-specific network, which resulted in 27 nodes and 88 interactions (Supplementary Fig. S1). The GAL switch genes identified in layer I are used as the targets in this layer to retrieve their potential regulators. Many known regulators of the GAL pathway, such as GAL4 and GAL80, are identified in the network because their expression level (e.g. GAL80) or their interacting partners’ (e.g. GAL80 as the interacting partner of GAL4) expression level is correlated with the target genes under this condition, leading to a potential regulatory pathway to the target genes. For comparison, we applied ARACNE and obtained thousands of nodes and interactions, but for its top-ranked module, we cannot find evidences in the current literature to suggest the involvement in the GAL response (see Supplementary Text). This suggests that many ‘collateral responses’ may be as stronger as the GAL response. Therefore, by integrating the PPI and P-DNA interactions and combining layers I and II, our approach effectively reduced the number of hypothesis, focused on the most specific candidates and identified potential ‘causal’ and ‘direct’ regulators.
Nevertheless, similar to many previous network reconstruction approaches, layer II is based on statistical dependencies between gene expression, assuming a correlation between the expression of the regulator and its targets, which may not necessarily hold in all cases, especially when the transcriptional regulation involves a transcription factor that requires post-transcriptional modifications or co-factors to be activated (Wu and Chan, 2011). Thus, we add another layer in our framework, layer III, to address this challenge by accounting for the TF activity.
3.3 Layer III. Inference of TF activity and transcriptional regulation
In eukaryotes, post-transcriptional modifications (includes post-transcriptional, post-translational modifications or protein co-factors) are required for many TFs to be activated to regulate their target gene expressions. Although such information cannot be directly measured with microarrays, the target genes’ expression can reflect such regulatory events. Therefore, given potential target genes predicted from motif search, ChIP-chip data or literature information, we can infer the changes in TF activity. In this layer, we use the summation of target gene expression level as the feature of a TF in the sample and apply ReliefF to identify TFs that show distinct activity (i.e. features) in the condition of interest as compared with all the other conditions.
Layer III is applied to the yeast H2O2 condition, and the results are shown by the blue lines in Figure 2. With the inference of the TF activity, the ROC shows a further increase in the specificity (achieve a false-positive rate of <0.01) of the predicted relationships that are ranked at the top 10%.
We also applied layer III to identify the TFs that regulate the expression of the GAL genes under the AltCarb (adding extra carbon source) condition. We use the top three predicted TFs to reconstruct an essential regulatory network for the GAL system, based on known PPI- and P-DNA-binding information. The results shown in Figure 3D demonstrate that our approach can re-discover the true network that includes the regulators GAL4, GAL80 and IMP2, the three specific TFs that regulate the GAL pathway for galactose utilization and glucose repression (Rubio-Texeira, 2005). In contrast, previous approaches based on TF expression level (TYPE 1, approaches based on mutual information or correlation, e.g. Bayesian Network), differences in target and non-target gene expressions (TYPE 2) or correlations within target genes (TYPE 3) (Wu and Chan, 2011) did not correctly identify the essential regulatory network (Fig. 3). In particular, GAL4 is post-transcriptionally regulated by its protein interaction with GAL80 (Rubio-Texeira, 2005), whose activity changes can be captured by our approach but not the other approaches compared. A GSEA-based approach (e.g. MARINA) may be able to find the enrichment of the target gene groups for these TFs; however, it gives a lower specificity, as many other TFs are identified to be more enriched for the AltCarb condition than the 3 GAL regulators (Supplementary Table S1).
Fig. 3.
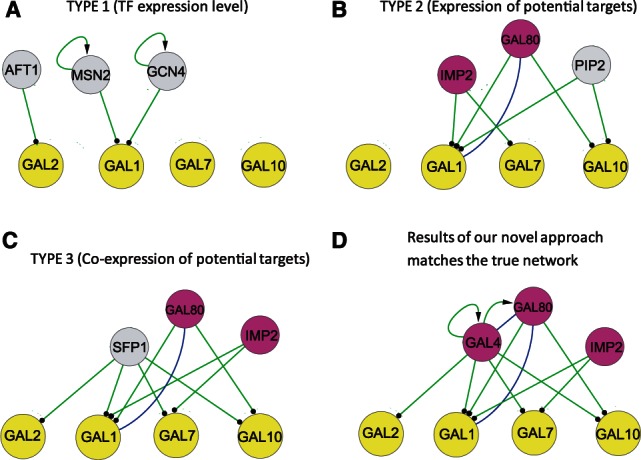
Network reconstruction of the GAL pathway. We estimate the activity of the 25 transcription factors that can bind to GAL genes in the TRN and use the top three TFs predicted to reconstruct the essential regulatory networks, with the interactions extracted from the TRN (green lines with arrow or dot at ends) and the PPI (blue lines, PPI information obtained from www.yeastgenome.org). We compare different approaches in estimating the TF activity (Wu and Chan, 2011): (A) TYPE 1: TF activity is determined by its expression level; (B) TYPE 2: TF activity is determined by the differential expression of potential target genes; (C) TYPE 3: TF activity is implicated by the co-expression of the target genes; (D) our approach: use the target gene expression information and integrate a wide range of conditions to determine the change of TF activity. The true network includes regulators GAL4, GAL80 and IMP2 (ranked 1, 2 and 3, respectively, in our approach) shown by the nodes colored in magenta, which are specific TFs regulating the GAL pathway for galactose utilization and glucose repression in the AltCarb condition. Nodes colored in gray are non-specific TFs for the AltCarb condition, including AFT1 (iron utilization and homeostasis), MSN2 (general stress response), GCN4 (amino acid biosynthesis), PIP2 (oleate response) and SFP1 (ribosome biogenesis and cell cycle). The functional annotations are based on SGD (http://www.yeastgenome.org)
3.4 Applications on human breast cancer
3.4.1 Layer I: Breast cancer
We apply our multi-layer inference approach on an integrated human gene expression dataset (ArrayExpress E-TABM-185, see Supplementary Methods) to identify potential biomarkers or targets and their regulators for ER (estrogen receptor)+ and ER− breast cancer subtypes. Applying differential expression analysis is problematic with such an integrated dataset. A per-gene permutation-based t-test results in thousands of differentially expressed genes for ER+ breast cancer. This high number of genes is hard to validate, whereas few genes are identified for ER− breast cancer because of the heterogeneity among the samples in this subtype.
Layer I of our novel approach identified candidate biomarkers for both ER+ and ER− breast cancer (Supplementary Table S2), some of which are well-known targets for these subtypes. Expression profile of the predicted genes shows distinctive patterns in the breast cancer samples (e.g. Supplementary Fig. S2). The well-known target ESR1 (estrogen receptor α) is correctly identified as the top feature for ER+ breast cancer, whereas the TACSTD2 (tumor-associated calcium signal transducer 2, a.k.a TROP2) gene is identified for both ER+ and ER− breast cancer, which we recently discovered could be a potential target for both ER+ and ER− breast cancer subtypes (Wu et al., 2011).
3.4.2 Layer II: ER positive and negative breast cancers
We then reconstruct a regulatory network for ESR1 in layer II and III, incorporating human PPI and P-DNA information. The results (see the Supplementary Text) show that our approach successfully identified many transcriptional regulators of ESR1. Inspired by the positive results obtained for ESR1, we applied this approach to identify the potential transcriptional regulators of TROP2. We previously identified TROP2 as an important biomarker for breast cancer (Wu et al., 2011); however, there is no information currently available on the regulation of TROP2. The ‘causal’ network inferred for TROP2 is shown in Figure 4. Based on this network, we predicted CREB1 is a likely transcription factor that regulates TROP2 expression. Our experiment (Supplementary Table S3) shows that the activation of CREB1 by FI (Forskolin-IBMX:3-isobutyl-1-methylxanthine) induces upregulation of TROP2 expression level in the breast cancer cells (Wu et al., 2011), which supports our model prediction that CREB1 is a regulator of TROP2.
Fig. 4.
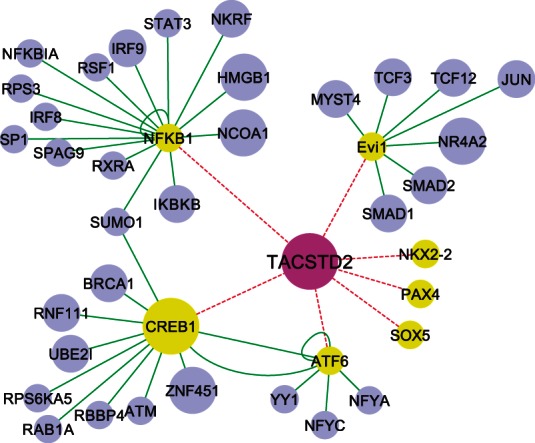
The regulatory network for TROP2. Seven transcription factors (colored in yellow) are predicted to bind to TROP2 based on motif search. Their interacting proteins are colored in blue. The causal impact (score) is represented with the size of the nodes in the network. Of the transcription factors that could regulate TROP2 only CREB1 shows a causal impact (a positive score), and it has the highest score among all the proteins in the network that is connected to TROP2
3.4.3 Layer III: Breast cancer
Although the human protein–DNA binding information is far from completed as compared with yeast, we obtained potential target genes of TFs for which binding motifs are known, including TP53, JUN and REST for ESR network and NFkB1, CREB and Evi1 for TROP2 network. The protein-DNA interaction is obtained from TargetMine database (Chen et al., 2011) based on both binding motif search on the gene promoter and literature curation. Application of layer III on these TFs identified that in the ESR network, TP53 activity changes the most, and in the TROP2 network. NFkB1 activity changes more than CREB1 and Evi1 (Supplementary Table S4). This predicts a potential regulatory role of TP53 on ESR, and NFkB1 on TROP2, and their activity could be controlled at the post-transcriptional level. It has been shown that TP53 transcriptionally regulates ESR1 expression and the regulation relies on many protein co-factors (Shirley et al., 2009), which supports this prediction. For TROP2, our approach predicted another potential transcriptional regulator: NFkB1, which is likely regulated at the post-transcriptional level, given that the activity of NFkB1 is primarily controlled by its cytosol-to-nucleic translocation (Gilmore, 2006). Experiment in human breast cancer cell lines (MCF10A and MDA-MB-231) shows that TROP2 gene expression is downregulated within 2 h on either the inhibition of NFkB’s protein activity or reducing its translocation by inhibiting IκB kinase (IKK) (Fig. 5), which confirms a regulatory role of NFkB on transcription of the TROP2 gene. This would be difficult to identify with current approaches, for example, applying GSEA on the known TFs (Supplementary Table S5) shows similar enrichment scores for almost all of the TFs, suggesting its lower specificity when applied on large datasets with diverse conditions. These results are similar to what is observed when GSEA is applied to the yeast dataset, where many of the enriched TFs show a zero P-value, whereas GAL4 was not detected (Supplementary Table S1). These results support that our approach can identify TFs whose activity is regulated at the post-transcriptional level.
Fig. 5.
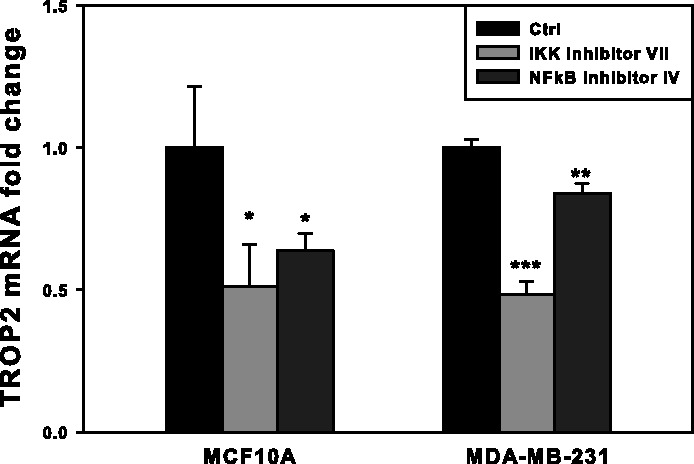
The TROP2 mRNA expression levels in different cell types. MCF10A and MDA-MB-231 were treated with IKK inhibitor VII and NFκB activation inhibitor IV for 2 h, respectively. The TROP2 mRNA levels were measured by quantitative real-time PCR (n = 3). *P < 0.05, **P < 0.01, ***P < 0.001. P-value was compared with control
As the completion of our study, two research articles have been published in ONCOGENE (Guerra et al., 2013; Trerotola et al., 2012) that provide experimental evidence in human cancer tissues to support TROP2 as an oncogene. These independent experimental studies confirm the effectiveness of our approach in predicting specific genes for a phenotype and potential targets for disease. Our discovery of the transcriptional regulators of TROP2 complements the network biology study of TROP2 in Guerra et al. (2013). We identified novel regulators of TROP2 that have not been discovered as yet based on previous approaches of network reconstruction. Our discovery of NFkB as a regulator of TROP2, together with the evidences provided in Guerra et al. (2013) that TROP2 regulates NFkB expression, suggests a potential positive feedback structure that supports the ‘switching’ behavior of TROP2 expression, which was uncovered in a previous analysis (Wu et al., 2011).
3.4.4 ER−/HER2− breast cancer
Furthermore, our ReliefF (layer I) analysis predicted KIF2C gene (also called mitotic centromere-associated kinesin, MCAK) as a specific biomarker for ER−/HER2− breast cancer (Supplementary Table S2 and Supplementary Fig. S2). Application of layers II and III suggests that the transcription factor E2F1 regulates KIF2C expression in ER−/HER2− breast cancer (Supplementary Table S6). E2F was the top ranked TF for KIF2C in both layers II and III. It seems counterintuitive that the relationship between E2F1, a transcription factor that controls cell proliferation (Wells et al., 2002), and KIF2C, one of the many kinesin genes involved in cell mitosis (Verhey et al., 2011), has been predicted to be ‘specific’ for ER−/HER2− breast cancer. To test this hypothesis, we perform experiments on ER+/HER2− (MCF7) and ER−/HER2− (MDA-MB-231) breast cancer cell lines. RNA interference was performed to knock down E2F1 in both cell lines (Fig. 6A and B). A significant decrease of the KIF2C expression is observed in MDA-MB-231 cells on E2F1 knock down, whereas the expression of KIF2C does not change in MCF7 cells (Fig. 6C). This confirms that the regulatory relationship of E2F1 on KIF2C is specific to ER−/HER2− cells.
Fig. 6.
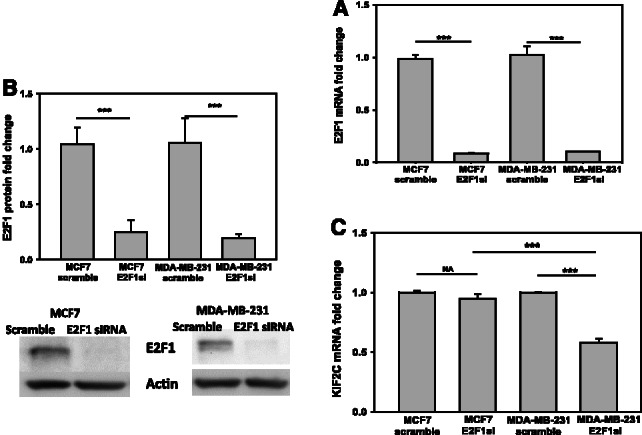
(A) The mRNA expression level of E2F1 in breast cancer cells MCF7 and MDA-MB-231. Scramble siRNA and siRNA targeting E2F1 were transfected into MCF7 and MDA-MB-231 cells. The mRNA of E2F1 was detected by real-time PCR (n = 3). *P < 0.05, **P < 0.01, ***P < 0.001. A line indicates comparison between the two bars connected by the line. (B) The protein expression level of E2F1 in breast cancer cells MCF7 and MDA-MB-231. Scramble siRNA and siRNA targeting E2F1were transfected into MCF7 and MDA-MB-231 cells. The protein of E2F1 was detected by western blot, actin was used as a loading control (n = 3). *P < 0.05, **P < 0.01, ***P < 0.001. A line indicates comparison between the two bars connected by the line. (C) KIF2C expression level in breast cancer MCF7 and MDA-MB-231 cells. E2F1 was silenced with specific siRNA in both MCF7 and MDA-MB-231 cells, and scramble siRNA was used as control. The mRNA of KIF2C was detected by real-time PCR (n = 3). *P < 0.05, **P < 0.01, ***P < 0.001. A line indicates comparison between the two bars connected by the line
Indeed, higher KIF2C has been reported to be associate with cancer (Jun et al., 2008), and especially in ER negative and triple negative phenotypes, KIF2C has been suggested to be the best prognostic target based on gene expression and immunohistochemistry studies of patient samples (Abdel-Fatah et al., 2012). The regulation of KIF2C gene has been studied in Jurkat cells where E2F1 binds to and suppresses the expression of KIF2C (Jun et al., 2008, p. 1). Nevertheless, our analysis shows that previous understanding cannot be generalized to breast cancer cells. In contrast to previous studies, knock down of E2F1 decreases KIF2C expression, and such regulation is specific to ER−/HER2− cells.
It has been suggested that ER negative breast cancer cells have an altered regulatory system that is different from ER positive subtypes (Moggs et al., 2005; Stender et al., 2007). For example, when estrogen or estrogen receptors are introduced, growth and proliferation of ER+ cells are activated; however, these processes are suppressed in ER− cells (Moggs et al., 2005). Thus, tamoxifen or other ER antagonist would have negative effects on the ER− subtype (Moggs et al., 2005). Elucidating the mechanism of the differences in regulation is important for the characterization and treatment of ER− patients. E2F1 signaling could be an important factor that mediates such of a difference (Stender et al., 2007; Wang et al., 1999). The three-layer approach was able to infer KIF2C as a specific target for ER−/HER2− breast cancer and also predicted that KIF2C is regulated by E2F1. This was confirmed experimentally to be specific to MDA-MB-231 (ER+ cells) as compared with MCF7 (ER−) cells, thus providing new evidence that connects a biomarker with a possible underlying mechanism in the regulation of the ER− subtype.
Overall, the application on human breast cancer shows that our approach can be used to capture specific targets and regulatory relationships.
3.5 Applications on cold acclimation in plant
Next, we show an application of the three-layer inference approach in Arabidopsis thaliana (Arabidopsis) to study cold acclimation; the process whereby plants increase their freezing tolerance in response to low non-freezing temperatures (Ruelland et al., 2009). One of the most well-studied cold-responsive pathways is the CBF pathway. This pathway comprises three genes that encode members of the ERF/AP2 transcription factor family, C-repeat binding factor 1 (CBF1), C-repeat binding factor 2 (CBF2) and C-repeat binding factor 3 (CBF3)—also known as dehydration responsive element-binding protein 1B (DREB1B), dehydration-responsive element-binding protein 1C (DREB1C) and dehydration-responsive element-binding protein 1A (DREB1A), respectively—which are induced within 15 min of exposing plants to low temperature (4°C). The three CBF TFs bind the CRT/DRE DNA regulatory element (rCCGAC) present in the promoters of ∼100 target genes, known as the CBF regulon, and induce their expression leading to an increase in freezing tolerance. The goal is to use the three-layer inference approach to identify condition-specific genes, as well as their potential regulators (e.g. TFs).
3.5.1 Layer I:
ReliefF is applied on the Arabidopsis integrative gene expression dataset (see Supplementary Methods) to identify genes that are most specific to the condition of interest (e.g. cold acclimation). Based on the ReliefF results (Supplementary Table S7), the three CBF genes are ranked among the top seven genes according to their ReliefF scores (CBF1, CBF2 and CBF3 were ranked seventh, second and first, respectively). Thus, ReliefF retained three known cold-responsive genes as top ranked genes based on their scores. To compare with a traditional approach, we also performed a permutation-based t-test. This analysis identified thousands of genes (P < 0.01) with CBF1, CBF2 and CBF3 ranked at 3072nd, 832nd and 933rd, respectively, based on their P-value. Furthermore, many of the genes identified by t-test are related to more general processes, which are not directly associated with the condition under investigation. For instance, cytochrome P450, a protein located in the chloroplast and involved in oxidation–reduction process, was the top ranked gene based on P-value ranking. Similarly, Low-molecular-weight Cysteine-Rich 67 (LCR67), a protein coding gene located in the extracellular regions and involved in physiological defense response, gibberellic acid-mediated signaling pathway and gibberellin biosynthetic process, HVA22B, a protein involved in seed dormancy process, and EM1, a protein located in the cytoplasm and involved in many biological processes (e.g. cell division, seed dormancy process, seed germination, lipid storage and regulation of flower development …), were ranked as the second, third and fourth, respectively, based on their P-value. Therefore, ReliefF was able to identify cold-responsive genes (e.g. CBF1, CBF2 and CBF3) as the top ranked genes as compared with a permutation-based t-test.
3.5.2 Layer II
In layer II, the regulatory network is reconstructed for the top two ranked genes (CBF2 and CBF3). The predicted regulatory network based on motif analysis contained 14 TFs as potential regulators of CBF2 and 15 TFs as potential regulators of CBF3. The top regulators of CBF2 and CBF3 based on the difference between the conditional and unconditional mutual information are shown in Supplementary Table S8. Circadian clock associated 1 (CCA1) and late elongated hypocotyl (LHY), which are MYB-related transcription factors, have been found to be involved in cold acclimation by regulating the CBF cold pathway (e.g. CBF1, CBF2 or CBF3) (Dong et al., 2011). Calmodulin-binding transcription activator 3 (CAMTA3) was found to regulate CBF2 gene expression (Doherty et al., 2009). Additionally, RAV1 and ABF1 have been found to be induced in response to low temperature.
3.5.3 Layer III
Next, the top regulators of CBF2 and CBF3 based on the ReliefF scores are listed in Supplementary Table S9. A reconstructed regulatory network based on the top four TFs of CBF2 or CBF3 is shown in Supplementary Figure S4. Based on the predicted regulatory network, CCA1, LHY, CAMTA3 and a member of the R2R3 factor gene family (MYB15) are the top TFs that regulate CBF2 gene expression. Similarly, CCA1, LHY and MYB15 are the top TFs that regulate CBF3 gene expression. From the literature, CAMTA3 has been found to be a positive regulator of CBF2 gene expression (Doherty et al., 2009). Specifically, using blot analysis and RT–PCR, they found that a mutation of CAMTA3 resulted in a statistically significant decrease in the transcription of CBF2 between cold-condition CAMTA3-mutated plants versus cold-conditioned wild-type plants. Similarly, MYB15 has been shown to be involved in the CBF pathway by negatively regulating the gene expression of CBF2 and CBF3 (Agarwal et al., 2006). MYB15 was found to bind to the MYB recognition sites present in the promoter regions of CBF2 and CBF3, and overexpression of MYB15 decreased the transcription levels of CBF2 and CBF3 genes, which reduced the plants’ freezing tolerance. On the other hand, mutation of MYB15 induced the expression levels of CBF2 and CBF3 and increased the plants’ freezing tolerance. These results suggest that MYB15 plays an important role in cold acclimation through the regulation of CBF2 and CBF3 gene expressions. Among the top seven regulators based on layer III, there are five transcription factors known to be involved in regulating CBF2 or CBF3 gene expression (LHY, CCA1, CAMTA3, MYB15 and PIF4), as well as one potential novel regulator (ATB2). Therefore, the three-layer inference approach retrieved known regulators of CBF2 and CBF3.
4 DISCUSSIONS
4.1 Integration of multiple conditions to achieve better specificity in network reconstruction
Identification of conditional-specific genes and ranking of the changes in TF activity can be modeled as ‘feature selection’, which is to select the best features (genes and TFs) that can determine a class (phenotype/condition). Typical approaches, i.e. t-test, ANOVA and other linear models (i.e. generalized linear model), are used to determine differential expression from pairwise data (Churchill, 2004; McCarthy et al., 2012; Smyth, 2004), as shown in Figure 1C. Although some of the applications include multi-factor (-condition) experiments, each comparison is pairwise either between two conditions or with a same untreated group. The problem with traditional approaches is that they do not explicitly distinguish specific responses from collateral and general responses (Fig. 1D); thus, it is less likely to achieve the specificity required to identify the unique genes in response to a given stimulation.
In contrast to traditional microarray analysis, we suggest using an integrated reference dataset as a representation of the diversity of gene expression behavior that exists to identify the specific genes for a target condition (Fig. 1E). By comparing our condition of interest against such a wide range of ‘controls’, one can obtain a more accurate boundary for the condition under investigation (Fig. 1E, green nodes versus red nodes). The integration of multiple conditions increases the coverage of the problem- or state-space to provide a better boundary, which increases the specificity of the genes discovered by our approach. The ReliefF algorithm that we applied is able to find important samples close to the boundary by searching in the feature space for the ‘nearest neighbors’ of the same/different classes and comparing them with the given condition to achieve better specificity. From a biological perspective, this is essentially determining better reference conditions by looking for transcriptomes in other samples that are similar to the transcriptome for the condition of interest, to enhance the specificity to identify genes for the condition under investigation.
ReliefF is designed to deal with datasets that contain highly interdependent features (Liu and Motoda, 2007; Ruiz et al., 2003), which is another advantage of this algorithm for gene selection. The majority of feature selection methods used in microarray analysis assumes conditional independence of features (genes) in different classes (conditions) and evaluates the features separately. These include differential expression analysis based on t-test, ANOVA and many consistency-based methods (searching for the smallest subset of the features that is as consistent as possible with the classification) (Almuallim and Dietterich, 1991). However, in biological networks, genes interact with each other and one cannot assume that they are independent. ReliefF is a context-sensitive method that accounts for the distinctive state of a set of features for a specific condition.
ReliefF has been applied in genetic analysis to identify association between SNPs and phenotypes (Chen and Lonardi, 2009; Moore and White, 2007). In addition to these genome-wide association studies, ReliefF has also been applied to small and clearly curated microarray datasets as a pre-processing step to enhance the accuracy of classification, where the improvements have been minimal (Yuhang Wang and Makedon, 2004; Zhang et al., 2008). This is because the microarray applications were based on a traditional setting in which only two conditions (e.g. cancer and control, a more limited search space) were compared and did not take advantage of the full capabilities of ReliefF. In such a two-class setting, ReliefF would not perform significantly better than other feature selection methods (Fig. 1B).
A limitation in the identification of biomarkers/targets based on gene expression changes is that there are proteins that could be expressed at similar levels but have functional changes across conditions. These cases are not readily discovered from gene expression data.
4.2 Inference of regulatory relationships
Methods that use statistical inference to identify the interaction between two genes are mostly based on the concept of ‘conditional independences’ (Markowetz and Spang, 2007), i.e. ‘is gene X independent/dependent of gene Y given genes Z’. In a full conditional model, all genes other than X and Y are included in Z, which is usually implemented with Gaussian graphic models, e.g. (Schäfer and Strimmer, 2005a, b) or Bayesian network, e.g. (Imoto et al., 2002, 2003). The challenge with such models is that they have too many parameters to be estimated with limited number of microarray samples. In contrast, approaches based on low-order conditional independence, whereby Z is a single gene, e.g. ARACNE (Margolin et al., 2006), are attractive because the model is less complex and may provide clearer biological interpretation of genes X, Y and Z.
Nevertheless, these methods have been shown to capture only part of the relevant biological information. Indeed, a critical analysis of the underlying assumptions of most in silico learning approaches applied to expression data demonstrate that statistical dependencies in microarray date alone do not readily provide direct mechanistic insights or interactions from functional genomics (Wu and Chan, 2011). In our approach, the combined layers II and III can infer the transcriptional regulation for cases when the TF is regulated at the transcriptional level (layer II incorporating P-DNA), as well as when the TF is post-transcriptionally regulated (layer II incorporating PPI and layer III). The computation of the scores in these two layers uses different information, and the scores are independent of each other and independent of the selection of the candidate genes in layer I. For example, in cases when the candidate genes are known a priori or provided by other sources, one could directly apply layers II and III to identify the regulators. Furthermore, in cases when the information of the candidate gene expression is limited (e.g. newly identified ncRNAs that only appear in RNAseq but not in microarray data), one could use its potential or predicted TFs and apply only layer III to filter out the TFs that are less likely to be activated for the specified condition.
4.3 Computational approaches to reconstruct gene network
There have been numerous computational approaches developed to reconstruct context-dependent gene network based on gene expression profiles. The field has been studied and reviewed [e.g. (Wu and Chan, 2011)] extensively but predominantly from the perspective of computational assumptions and methodologies. We attempt to clarify the biological problems and hypothesis that can be solved or predicted by these different approaches. In Supplementary Table S10, we summarize and compare our approach with different computational approaches that are currently applied on gene network reconstruction. Approaches based on Bayesian network or correlation network (e.g. in module analysis) infer a ‘functional network’ where the connections predict statistical influences (i.e. correlation) between gene expression, which does not necessary provide clear information on the regulatory relationships and mechanisms. This also includes applications based using graphic model (Segal et al., 2003; Wang et al., 2003) in which ‘conditional clustering’ of the co-expressed genes for a given condition implies potential functional connections but not necessarily direct regulation unless further interpreted with expert knowledge. ARACNe (Margolin et al., 2006) and MINDy (Wang et al., 2009) aim to study transcriptional regulation, which is built on the correlation between the mRNA level of the TF and its target genes. However, MARINA (Lefebvre et al., 2010) and NCA (Galbraith et al., 2006; Liao et al., 2003) can account for post-transcriptional regulation and infer TF activity by incorporating known protein–DNA interactions. MARINA applies GSEA to select the active TFs, where the gene sets contain the targets genes of the TFs, whereas NCA requires many samples to solve its complex parametric model—which raises another concern. Methods such as GLM and graphic models have been applied effectively to human-scale data to identify target genes (Li et al., 2010), but to identify TF–gene relationships the common constraints in statistics applied, for example, to illustrate a four-way relationship requires one to have at least four samples [e.g. ‘the number of samples need to be at least larger than the number of genes’ (Wang et al., 2003)]. The design of our approach reduces the number of candidates using a layered manner; thus, the information can be focused to address few specific regulatory relationships at each level rather than learning a general model for all genes and TFs. Other methods for estimating TF activity usually require specific perturbation data, e.g. time-series data (Ernst and Bar-Joseph, 2006; Shi et al., 2009) or special experimental design of systematic perturbations on the gene network (Ideker et al., 2000; Tegner et al., 2003). Therefore, the primary goal of this study is to develop a framework that can be widely applicable to the community in which the current availability of expression data can be capitalized on along with interaction data to identify TFs, including post-transcriptionally regulated TFs. In our approach, the PPI and P-DNA (TRN) information is incorporated with the gene expression data, and the inference of the genes and their regulatory relationships is separated into three layers that represent distinct biological scenarios. Based on currently known and available information, the approach would be able to identify the regulators (TFs) of the targets genes (selected to be most specific to the condition) and are regulated either transcriptionally (which other methods can do) or post-transcriptionally (which current methods are not able to perform, without first providing a list of potential regulators a priori). In each of the layers, multiple conditions are integrated to compare with the condition of interest to infer the specific changes.
Similar to previous studies in TRN reconstruction, the limitation of the approaches is primarily because of incomplete/inaccurate information of protein–DNA interactions in higher eukaryotic system. Similar to MARINA (or GSEA), the TF activity estimation in layer III depends on the quality of the putative target sets obtained from P-DNA information. Such information is widely available in yeast for most of its TFs but the predictions from binding motifs in human are incomplete. This is partially why most current applications of TRN reconstruction focus on yeast or prokaryotes (Faith et al., 2007; Segal et al., 2003; Wang et al., 2003). In our approach, an incomplete putative target set would not affect the prediction of the TF activity if the given targets have been authenticated and are representative of the entire target set. Therefore, when applying layer III to human data, we only use information from literature-curated databases, which essentially provides another piece of information independent of the P-DNA predicted from motif information in layer II. Given the same limitations (i.e. incomplete elucidation of the human network), the three-layer method was able to identify regulators that are post-transcriptionally regulated. Our approach was compared and validated with yeast data, which existing tools were not able to recapitulate, namely, the regulators of the GAL genes, despite the fact that the regulation is well-known. We present examples of the application of the approach in eukaryotic systems (human breast cancer, plant cold acclimation), which show the generalizability of the approach. The results obtained with the human data, at present, have not been achieved with current approaches, and further experimental validation was performed to confirm that a post-transcriptionally regulated TF is involved in the regulation of TROP2 (shown in Fig. 5), and the regulation of KIF2C by E2F1 is specific to ER−/HER2− breast cancer cells, which is a novel finding. Currently the approach is limited or constrained by the availability of regulatory and binding data, however, as more and more data are released from sequencing projects to identify functional elements in gene regulation (e.g. the ENCODE project: http://www.genome.gov/10005107, the modENCODE project: http://www.modencode.org/), collating and incorporating these condition-specific binding information will benefit future applications and improve the inference of gene regulation.
Supplementary Material
ACKNOWLEDGEMENT
The authors thank Dr Michael Thomashow for his insights and suggestions on the A.thaliana.
Funding: NIH (R01GM079688, R21RR024439 and 1R01GM089866) (in part); NSF (CBET 0941055, CBET 1049127 and DBI 0701709); MSU Foundation.
Conflict of Interest: none declared.
REFERENCES
- Abdel-Fatah T, et al. P4-09-11: kinesin family member 2C (KIF2C) is a new surrogate prognostic marker in breast cancer (BC) Cancer Res. 2012;71:P4–09–11. [Google Scholar]
- Agarwal M, et al. A R2R3 type MYB transcription factor is involved in the cold regulation of CBF genes and in acquired freezing tolerance. J. Biol. Chem. 2006;281:37636–37645. doi: 10.1074/jbc.M605895200. [DOI] [PubMed] [Google Scholar]
- Almuallim H, Dietterich TG. Proceedings of The Ninth National Conference on Artificial Intelligence. Menlo Park, CA: AAAI Press; 1991. Learning with many irrelevant features; pp. 547–552. [Google Scholar]
- Basso K, et al. Reverse engineering of regulatory networks in human B cells. Nat. Genet. 2005;37:382–390. doi: 10.1038/ng1532. [DOI] [PubMed] [Google Scholar]
- Bontempi G, Meyer PE. Causal filter selection in microarray data. ICML. 2010:95–102. [Google Scholar]
- Chen JY, Lonardi S. Biological Data Mining. 1st edn. Boca Raton, FL: Chapman and Hall/CRC; 2009. [Google Scholar]
- Chen YA, et al. TargetMine, an integrated data warehouse for candidate gene prioritisation and target discovery. PLoS One. 2011;6:e17844. doi: 10.1371/journal.pone.0017844. [DOI] [PMC free article] [PubMed] [Google Scholar]
- Chuang HY, et al. Network-based classification of breast cancer metastasis. Mol. Syst. Biol. 2007;3:140. doi: 10.1038/msb4100180. [DOI] [PMC free article] [PubMed] [Google Scholar]
- Churchill GA. Using ANOVA to analyze microarray data. Biotechniques. 2004;37:173–175, 177. doi: 10.2144/04372TE01. [DOI] [PubMed] [Google Scholar]
- Doherty CJ, et al. Roles for arabidopsis CAMTA transcription factors in cold-regulated gene expression and freezing tolerance. Plant Cell. 2009;21:972–984. doi: 10.1105/tpc.108.063958. [DOI] [PMC free article] [PubMed] [Google Scholar]
- Dong MA, et al. Circadian clock-associated 1 and late elongated hypocotyl regulate expression of the C-repeat binding factor (CBF) pathway in Arabidopsis. Proc. Natl Acad. Sci. USA. 2011;108:7241–7246. doi: 10.1073/pnas.1103741108. [DOI] [PMC free article] [PubMed] [Google Scholar]
- Ernst J, Bar-Joseph Z. STEM: a tool for the analysis of short time series gene expression data. BMC Bioinformatics. 2006;7:191. doi: 10.1186/1471-2105-7-191. [DOI] [PMC free article] [PubMed] [Google Scholar]
- Faith JJ, et al. Large-scale mapping and validation of escherichia coli transcriptional regulation from a compendium of expression profiles. PLoS Biol. 2007;5:e8. doi: 10.1371/journal.pbio.0050008. [DOI] [PMC free article] [PubMed] [Google Scholar]
- Galbraith SJ, et al. Transcriptome network component analysis with limited microarray data. Bioinformatics. 2006;22:1886–1894. doi: 10.1093/bioinformatics/btl279. [DOI] [PubMed] [Google Scholar]
- Gilmore TD. Introduction to NF-kappaB: players, pathways, perspectives. Oncogene. 2006;25:6680–6684. doi: 10.1038/sj.onc.1209954. [DOI] [PubMed] [Google Scholar]
- Guerra E, et al. The trop-2 signalling network in cancer growth. Oncogene. 2013;32:1594–1600. doi: 10.1038/onc.2012.151. [DOI] [PubMed] [Google Scholar]
- Harbison CT, et al. Transcriptional regulatory code of a eukaryotic genome. Nature. 2004;431:99–104. doi: 10.1038/nature02800. [DOI] [PMC free article] [PubMed] [Google Scholar]
- Ideker T, et al. Discovering regulatory and signalling circuits in molecular interaction networks. Bioinformatics. 2002;18(Suppl. 1):S233–S240. doi: 10.1093/bioinformatics/18.suppl_1.s233. [DOI] [PubMed] [Google Scholar]
- Ideker TE, et al. Discovery of regulatory interactions through perturbation: inference and experimental design. Pac. Symp. Biocomput. 2000;5:302–313. doi: 10.1142/9789814447331_0029. [DOI] [PubMed] [Google Scholar]
- Imoto S, et al. Bayesian network and nonparametric heteroscedastic regression for nonlinear modeling of genetic network. J. Bioinform. Comput. Biol. 2003;1:231–252. doi: 10.1142/s0219720003000071. [DOI] [PubMed] [Google Scholar]
- Imoto S, et al. Estimation of genetic networks and functional structures between genes by using Bayesian networks and nonparametric regression. Pac. Symp. Biocomput. 2002:175–186. [PubMed] [Google Scholar]
- Jaffrezic F, Tosser-Klopp G. Gene network reconstruction from microarray data. BMC Proc. 2009;3:S12. doi: 10.1186/1753-6561-3-S4-S12. [DOI] [PMC free article] [PubMed] [Google Scholar]
- Jun DY, et al. Regulation of the human mitotic centromere-associated kinesin (MCAK) promoter by the transcription factors Sp1 and E2F1. Biochim. Biophys. Acta. 2008;1779:356–361. doi: 10.1016/j.bbagrm.2008.03.013. [DOI] [PubMed] [Google Scholar]
- Kononenko I. Estimating Attributes: Analysis and Extensions of RELIEF. Secaucus, NJ: Springer-Verlag New York, Inc.; 1994. pp. 171–182. [Google Scholar]
- Lefebvre C, et al. A human B-cell interactome identifies MYB and FOXM1 as master regulators of proliferation in germinal centers. Mol. Syst. Biol. 2010;6:377. doi: 10.1038/msb.2010.31. [DOI] [PMC free article] [PubMed] [Google Scholar]
- Li C, et al. Network-based empirical bayes methods for linear models with applications to genomic data. J. Biopharm. Stat. 2010;20:209–222. doi: 10.1080/10543400903572712. [DOI] [PMC free article] [PubMed] [Google Scholar]
- Li Z, et al. A three stage integrative pathway search (TIPS©) framework to identify toxicity relevant genes and pathways. BMC Bioinformatics. 2007;8:202. doi: 10.1186/1471-2105-8-202. [DOI] [PMC free article] [PubMed] [Google Scholar]
- Liao JC, et al. Network component analysis: reconstruction of regulatory signals in biological systems. PNAS. 2003;100:15522–15527. doi: 10.1073/pnas.2136632100. [DOI] [PMC free article] [PubMed] [Google Scholar]
- Liu H, Motoda H. Computational Methods of Feature Selection. Boca Raton, FL: Chapman and Hall/CRC; 2007. [Google Scholar]
- Margolin AA, et al. ARACNE: an algorithm for the reconstruction of gene regulatory networks in a mammalian cellular context. BMC Bioinformatics. 2006;7(Suppl. 1):S7. doi: 10.1186/1471-2105-7-S1-S7. [DOI] [PMC free article] [PubMed] [Google Scholar]
- Markowetz F, Spang R. Inferring cellular networks—a review. BMC Bioinformatics. 2007;8:S5. doi: 10.1186/1471-2105-8-S6-S5. [DOI] [PMC free article] [PubMed] [Google Scholar]
- McCarthy DJ, et al. Differential expression analysis of multifactor RNA-Seq experiments with respect to biological variation. Nucleic Acids Res. 2012;40:4288–4297. doi: 10.1093/nar/gks042. [DOI] [PMC free article] [PubMed] [Google Scholar]
- Moggs JG, et al. Anti-proliferative effect of estrogen in breast cancer cells that re-express ERalpha is mediated by aberrant regulation of cell cycle genes. J. Mol. Endocrinol. 2005;34:535–551. doi: 10.1677/jme.1.01677. [DOI] [PubMed] [Google Scholar]
- Moore JH, White BC. Proceedings of the 5th European conference on Evolutionary computation, machine learning and data mining in bioinformatics. 2007. Tuning ReliefF for genome-wide genetic analysis. EvoBIO’07, pp. 166–175. Springer-Verlag, Berlin, Heidelberg. [Google Scholar]
- Robnik-Šikonja M, Kononenko I. Theoretical and empirical analysis of ReliefF and RReliefF. Mach. Learn. 2003;53:23–69. [Google Scholar]
- Rubio-Texeira M. A comparative analysis of the GAL genetic switch between not-so-distant cousins: Saccharomyces cerevisiae versus Kluyveromyces lactis. FEMS Yeast Res. 2005;5:1115–1128. doi: 10.1016/j.femsyr.2005.05.003. [DOI] [PubMed] [Google Scholar]
- Ruelland E, et al. Advances in Botanical Research. Philadelphia, PA: Elsevier; 2009. Chapter 2 Cold signalling and cold acclimation in plants; pp. 35–150. [Google Scholar]
- Ruiz R, et al. Fast feature ranking algorithm. In: Palade V, et al., editors. Knowledge-Based Intelligent Information and Engineering Systems. Berlin, Heidelberg: Springer; 2003. pp. 325–331. [Google Scholar]
- Saeys Y, et al. A review of feature selection techniques in bioinformatics. Bioinformatics. 2007;23:2507–2517. doi: 10.1093/bioinformatics/btm344. [DOI] [PubMed] [Google Scholar]
- Schäfer J, Strimmer K. A shrinkage approach to large-scale covariance matrix estimation and implications for functional genomics. Stat. Appl. Genet. Mol. Biol. 2005a;4:Article32. doi: 10.2202/1544-6115.1175. [DOI] [PubMed] [Google Scholar]
- Schäfer J, Strimmer K. An empirical bayes approach to inferring large-scale gene association networks. Bioinformatics. 2005b;21:754–764. doi: 10.1093/bioinformatics/bti062. [DOI] [PubMed] [Google Scholar]
- Segal E, et al. Module networks: identifying regulatory modules and their condition-specific regulators from gene expression data. Nat. Genet. 2003;34:166–176. doi: 10.1038/ng1165. [DOI] [PubMed] [Google Scholar]
- Shi Y, et al. A combined expression-interaction model for inferring the temporal activity of transcription factors. J. Comput. Biol. 2009;16:1035–1049. doi: 10.1089/cmb.2009.0024. [DOI] [PMC free article] [PubMed] [Google Scholar]
- Shirley SH, et al. Transcriptional regulation of estrogen receptor-alpha by p53 in human breast cancer cells. Cancer Res. 2009;69:3405–3414. doi: 10.1158/0008-5472.CAN-08-3628. [DOI] [PMC free article] [PubMed] [Google Scholar]
- Smyth GK. Linear models and empirical bayes methods for assessing differential expression in microarray experiments. Stat. Appl. Genet. Mol. Biol. 2004;3:Article3. doi: 10.2202/1544-6115.1027. [DOI] [PubMed] [Google Scholar]
- Stender JD, et al. Estrogen-regulated gene networks in human breast cancer cells: involvement of E2F1 in the regulation of cell proliferation. Mol. Endocrinol. 2007;21:2112–2123. doi: 10.1210/me.2006-0474. [DOI] [PubMed] [Google Scholar]
- Stephanopoulos G, et al. Exploiting biological complexity for strain improvement through systems biology. Nat. Biotechnol. 2004;22:1261–1267. doi: 10.1038/nbt1016. [DOI] [PubMed] [Google Scholar]
- Subramanian A, et al. Gene set enrichment analysis: a knowledge-based approach for interpreting genome-wide expression profiles. Proc. Natl Acad. Sci. USA. 2005;102:15545–15550. doi: 10.1073/pnas.0506580102. [DOI] [PMC free article] [PubMed] [Google Scholar]
- Tegner J, et al. Reverse engineering gene networks: integrating genetic perturbations with dynamical modeling. Proc. Natl Acad. Sci. USA. 2003;100:5944–5949. doi: 10.1073/pnas.0933416100. [DOI] [PMC free article] [PubMed] [Google Scholar]
- Trerotola M, et al. Upregulation of Trop-2 quantitatively stimulates human cancer growth. Oncogene. 2012;32:222–233. doi: 10.1038/onc.2012.36. [DOI] [PubMed] [Google Scholar]
- Ulitsky I, Shamir R. Identification of functional modules using network topology and high-throughput data. BMC Syst. Biol. 2007;1:8. doi: 10.1186/1752-0509-1-8. [DOI] [PMC free article] [PubMed] [Google Scholar]
- Verhey KJ, et al. Kinesin assembly and movement in cells. Annu. Rev. Biophys. 2011;40:267–288. doi: 10.1146/annurev-biophys-042910-155310. [DOI] [PubMed] [Google Scholar]
- Wang J, et al. MGraph: graphical models for microarray data analysis. Bioinformatics. 2003;19:2210–2211. doi: 10.1093/bioinformatics/btg298. [DOI] [PubMed] [Google Scholar]
- Wang K, et al. Genome-wide identification of post-translational modulators of transcription factor activity in human B cells. Nat. Biotech. 2009;27:829–837. doi: 10.1038/nbt.1563. [DOI] [PMC free article] [PubMed] [Google Scholar]
- Wang W, et al. Transcriptional activation of E2F1 gene expression by 17beta-estradiol in MCF-7 cells is regulated by NF-Y-Sp1/estrogen receptor interactions. Mol. Endocrinol. 1999;13:1373–1387. doi: 10.1210/mend.13.8.0323. [DOI] [PubMed] [Google Scholar]
- Wang Y. Proceedings of the 2004 IEEE Computational Systems Bioinformatics Conference. New York City: IEEE press; 2004. Application of relieff feature filtering algorithm to selecting informative genes for cancer classification using microarray data; pp. 477–478. [Google Scholar]
- Wells J, et al. The identification of E2F1-specific target genes. PNAS. 2002;99:3890–3895. doi: 10.1073/pnas.062047499. [DOI] [PMC free article] [PubMed] [Google Scholar]
- Werhli AV, et al. Comparative evaluation of reverse engineering gene regulatory networks with relevance networks, graphical gaussian models and bayesian networks. Bioinformatics. 2006;22:2523–2531. doi: 10.1093/bioinformatics/btl391. [DOI] [PubMed] [Google Scholar]
- Wu M, et al. Identification of novel targets for breast cancer by exploring gene switches on a genome scale. BMC Genomics. 2011;12:547. doi: 10.1186/1471-2164-12-547. [DOI] [PMC free article] [PubMed] [Google Scholar]
- Wu M, Chan C. Learning transcriptional regulation on a genome scale: a theoretical analysis based on gene expression data. Brief. Bioinform. 2011;13:150–161. doi: 10.1093/bib/bbr029. [DOI] [PMC free article] [PubMed] [Google Scholar]
- Yang X, et al. Systematic genetic and genomic analysis of cytochrome P450 enzyme activities in human liver. Genome Res. 2010;20:1020–1036. doi: 10.1101/gr.103341.109. [DOI] [PMC free article] [PubMed] [Google Scholar]
- Yuhang W, Makedon F. 2004 IEEE Computational Systems Bioinformatics Conference, 2004 (CSB 2004. Proceedings) New York City: IEEE press; 2004. Application of Relief-F feature filtering algorithm to selecting informative genes for cancer classification using microarray data; pp. 497–498. [Google Scholar]
- Zhang Y, et al. Gene selection algorithm by combining reliefF and mRMR. BMC Genomics. 2008;9(Suppl. 2):S27. doi: 10.1186/1471-2164-9-S2-S27. [DOI] [PMC free article] [PubMed] [Google Scholar]
Associated Data
This section collects any data citations, data availability statements, or supplementary materials included in this article.