

Abstract
Objectives
Cardiorespiratory instability may be undetected in monitored step-down unit patients. We explored whether using an integrated monitoring system that continuously amalgamates single noninvasive monitoring parameters (heart rate, respiratory rate, blood pressure, and peripheral oxygen saturation) into AN instability index value (INDEX) correlated with our single-parameter cardiorespiratory instability concern criteria, and whether nurse response to INDEX alert for patient attention was associated with instability reduction.
Design
Prospective, longitudinal evaluation in sequential 8-, 16-, and 8-wk phases (phase I, phase II, and phase III, respectively).
Setting
A 24-bed trauma step-down unit in single urban tertiary care center.
Patients
All monitored patients.
Interventions
Phase I: Patients received continuous single-channel monitoring (heart rate, respiratory rate, blood pressure, and peripheral oxygen saturation) and standard care; INDEX background was recorded but not displayed. Phase II: INDEX was background-recorded; staff was educated on use. Phase III: Staff used a clinical response algorithm for INDEX alerts.
Measurement and Main Results
Any monitored parameters even transiently beyond local cardiorespiratory instability concern triggers (heart rate of <40 or >140 beats/min, respiratory rate of <8 or >36 breaths/min, systolic blood pressure of <80 or >200 mm Hg, diastolic blood pressure of >110 mm Hg, and peripheral oxygen saturation of <85%) defined INSTABILITYmin. INSTABILITYmin further judged as both persistent and serious defined INSTABILITYfull. The INDEX alert states were defined as INDEXmin and INDEXfull by using same classification. Phase I and phase III admissions (323 vs. 308) and monitoring (18,258 vs. 18,314 hrs) were similar. INDEXmin and INDEXfull correlated significantly with INSTABILITYmin and INSTABILITYfull (r = .713 and r = .815, respectively, p < .0001). INDEXmin occurred before INSTABILITYmin in 80% of cases (mean advance time 9.4 ± 9.2 mins). Phase I and phase III admissions were similarly likely to develop INSTABILITYmin (35% vs. 33%), but INSTABILITYmin duration/admission decreased from phase I to phase III (p = .018). Both INSTABILITYfull episodes/admission (p = .03) and INSTABILITYfull duration/admission (p = .05) decreased in phase III.
Conclusion
The integrated monitoring system INDEX correlated significantly with cardiorespiratory instability concern criteria, usually occurred before overt instability, and when coupled with a nursing alert was associated with decreased cardiorespiratory instability concern criteria in step-down unit patients.
Keywords: cardiorespiratory, instability, physiologic monitoring, integrated monitoring system, rapid response system, medical emergency team, medical emergency treatment
Potentially unstable patients are transferred out of intensive care units (ICUs) to step-down units (SDUs) for further care. Although SDUs usually use continuous noninvasive monitoring and have nurse-to-patient ratios higher than those on general wards, it is not clear if this strategy improves patient care and safety. We have shown that continuous noninvasive monitoring of cardiorespiratory parameters on SDUs (e.g., electrocardiography, automated sphygmomanometry, and pulse oximetry to estimate vital signs of heart rate [HR], respiratory rate [RR], blood pressure [BP], and peripheral arterial O2 saturation [SpO2]) is not reliably implemented and even when used identifies abnormalities often unnoticed by caregivers (1). Nevertheless, rescue of unstable patients is dependent upon the nurse’s ability to first detect and then recognize instability (2). Following detection and recognition is intervention: rescue can range from application of simple measures to correct abnormal physiology when instability is detected early, up through activation of a rapid response system leading to a team response for medical emergency treatment (MET) to rescue patients with more severe instability (3). Several groups have created instability rules to guide decision making. Early warning scores and modified early warning scores that calculate a composite score from multiple vital signs have proven beneficial in enabling caregivers to quantify concern for instability and support the decision to intervene or call for help (4, 5). However, modified early warning scores still require the bedside presence of a caregiver for recording vital signs and performing the modified early warning scores calculations intermittently (4, 5). In contrast, integrated monitoring systems (IMSs) provide for automated amalgamation of the continuous noninvasive bedside monitor parameters of HR, RR, SpO2, and BP into a single instability index score that is updated several times per minute, and alarms to notify staff when an instability threshold is reached. The IMS has been proven to be more sensitive and specific at detecting instability than standard single-parameter monitors in ICUs (6). It seems intuitive that the SDU with its lower nurse-to-patient ratios and decreased beside caregiver presence would benefit the most from improved instability detection. However, IMS has not yet been tested as to its correlation with instability in the SDU population or its ability to improve instability detection in SDUs. We conducted a quality improvement project to determine whether IMS alerts were correlated to cardiorespiratory instability in the SDU patient population and whether using the IMS would decrease the incidence and duration of patient instability on the SDU when compared with standard single-channel continuous noninvasive monitoring of HR, RR, SpO2, and BP.
MATERIALS AND METHODS
Patients and Setting
Our patient safety committee approved the study as a quality improvement initiative; therefore written informed consent from evaluation participants was not required. The evaluation unit, a 24-bed adult surgical trauma SDU (level I trauma center), was equipped with bedside monitors (model M1204, Philips Medical, Bothell, WA). Demographic and clinical data were obtained from clinical and administrative databases. Monitoring data from continuous HR (3-lead electrocardiogram), RR (bioimpedance signaling), SpO2 (pulse oximeter model M1191B, Phillips, Boeblingen, Germany), and intermittent noninvasive BP (minimum frequency 2 hrs) were collected into an IMS (see below). Alarms set around individual vital sign parameters resulted in audible bedside and central nursing station alerts. No staff was dedicated to central monitor observation. The nurse-to-patient ratio was 1:4–8 depending on patient census and acuity, not time of day. This hospital utilizes a well-established critical care physician-led MET model for the responders in their rapid response system.
Equipment and Procedures
We used the Visensia (OBS Medical, Carmel IN) IMS monitor that integrates HR, RR, BP, and SpO2 based on neural networking (6). The Visensia device is a U.S. Food and Drug Administration-approved patient monitoring system that usually integrates five vital signs to produce a single-parameter IMS index value (INDEX). The input variables include HR, RR, BP, SpO2, and temperature. We were unable to record temperature continuously, so the INDEX was adjusted by the manufacturer to evaluate the remaining four variables by using a similar proprietary probabilistic equation. The data fusion method used to calculate the IMS INDEX utilizes neural networking to develop a probabilistic model of normality in these four or five vital sign dimensions as previously learned from a training set of 150 ICU patients (6). Variance from this data set is then used to evaluate the probability that the patient-derived vital signs are considered normal. A derived INDEX is generated, from 0 (no instability) to 10 (severe instability). An INDEX alert at a threshold value of 3.0 represents a departure from normality for ICU patients at approximately ± 3 SDs for a single variable, or by smaller amounts of multiple variables (7). Alerts are generated only when the INDEX exceeds threshold for ≥80% of a sliding 5-min window (6). The Visensia was installed at every bed space on the evaluation unit.
Study Phases
The quality improvement project was conducted in three phases (Table 1) with a total project duration of 32 wks (November 2006 to August 2007) chosen to limit confounding due to time, history, or staff turnover. In phase I (P1), 8 wks long (P1 previously reported) (1), the IMS was active but not displayed for staff use. The continuously monitored vital signs along with the nonvisible INDEX were background recorded for evaluation. Patients received standard care, including established institutional MET activation (8). In phase II (P2), 16 wks long, the INDEX was displayed on bedside and central monitors, and nurses and physicians were educated on its meaning but received no requirements for utilization. During P2, we sought to use the blinded P1 data to develop a SDU-specific INDEX alert threshold that was sensitive and specific to detect cardiorespiratory instability as defined by our single-parameter vital sign criteria for instability concern, which also serve as MET activation triggers. Specifically, these were an HR of <40 or >140 beats/min, an RR of <8 or >36 breaths/min, systolic BP of <80 or >200 mm Hg, diastolic BP of >110 mm Hg, and SpO2 of <85%. Using post hoc receiver-operator curve analyses of these P1 data, we found that the best balance between cardiorespiratory instability concern criteria and the INDEX threshold was achieved at a sensitivity of 70.5% and specificity of 71% when the INDEX alert threshold was set at ≥3.2. We then performed a retrospective analysis of the P1 dataset by using the ≥3.2 threshold, and then prospectively used the ≥3.2 INDEX value for staff alert to an instability state in phase III (P3) (see below). During P2 the project leadership also collaborated with the unit staff to develop a clinical algorithm for nursing response to an INDEX alert state (Fig. 1). Training on algorithm use occurred during P2 for staff nurses, physicians, and nurse practitioners (no formal assessment of education effectiveness was conducted). In P3, INDEX ≥3.2 alerts were audible and visible at the bedside and central station. The algorithm for INDEX alert response called for the nurse to go immediately to the bedside and evaluate the patient. If after direct evaluation the nurse judged that a MET call was warranted, the nurse did so. If patients were unstable but not exceeding MET trigger criteria by the time of nursing presence at the bedside, the nurses could either perform further evaluation and nursing interventions or call upon a provider, whichever they judged appropriate. The INDEX alert itself was not a MET activation criterion. Rather, the INDEX alert was used as a parsimonious signal for the nurse to attend immediately to a patient who had exceeded the instability concern threshold and evaluate their status. There were no changes to the institutional MET trigger criteria or to MET protocols across the phases.
Table 1.
Quality improvement project action timetable
| Preparation | Phase I | Phase II | Phase III |
|---|---|---|---|
| Multidisciplinary brainstorming and planning | Measures current practice | Transition from current to changed practice | Measures practice after change |
| 6 months | 8 wks | 13 wks | 8 wks |
| Continuous noninvasive parameter monitoring | Continuous noninvasive parameter monitoring | Continuous noninvasive parameter monitoring | |
| Begin IMS installation | IMS bedside display inactive but background recorded | Activate IMS display | Activate IMS display and audible alerts |
|
|
|
|
IMS, integrated monitoring system; UPMC, University of Pittsburgh Medical Center; SDU, step-down unit.
Figure 1.

The University of Pittsburgh Medical Center clinical decision rules for Visensia red alerts. VSI, Visensia Index; MET, medical emergency treatment; HR, heart rate; BP, blood pressure; RR, respiratory rate; SpO2, peripheral oxygen saturation; MD, medical doctor; CRNP, certified registered nurse practitioner; PA, physician assistant; VS, vital sign.
Data Analysis
We blindly scored all P1 and P3 data off-line, independent of phase. We analyzed the time plots of the single-parameter physiologic data (HR, RR, SpO2, and BP) to determine the total time when variables were within the normal physiologic range (no INSTABILITY) and then the incidence and duration of any episodes wherein the cardiore-spiratory instability concern criteria were exceeded even minimally for any reason, even if for artifact (defined as an INSTABILITYhit episode). These INSTABILITYhit episodes were further evaluated to exclude episodes judged as due to artifactual causes of criterion violation. The remaining episodes judged as truly physiologically plausible (defined as an INSTABILITYmin episode) were measured for incidence and duration. Finally, the INSTABILITYmin episodes were further evaluated to judge those consistent with serious instability (INSTABILITYfull) and the total INSTABILITYfull time. INSTABILTYfull was defined as being serious, persistent, and generally displaying multiparameter abnormality. These categorizations were performed independently by the two critical care medicine physician investigators (MAD and MRP) fluent in cardiorespiratory instability with the data blinded to data phase and using only the parsimonious definitions described above. Initial inter-rater variability of their independent scoring was 61%. In a second review, the physician scorers met together and reviewed each instance of divergent categorization to derive a consensus judgment. In cases of disagreement, the higher INSTABILITY level was assigned to the episode. Finally, the continuous IMS data were reviewed, and INDEX alerts were categorized along the same guidelines as INDEXhit, INDEXmin, or INDEXfull episodes. Statistical analyses were performed by using Student’s t tests, chi-square or Fisher exact comparisons, and Spearman’s rho correlation. Significance corresponds to p < .05.
RESULTS
INSTABILITY Criteria vs. Index Alerts
The correlations between the numbers of INSTABILITY and INDEX episodes were significant, with the correlation coefficients becoming stronger as the degree of instability increased (Table 2). The correlations between the duration of time the patients spent in an INSTABILITY state and an INDEX alert state followed a similar pattern. Of 1,327 INSTABILITYmin episodes, 45% were accompanied by INDEX alerts. Of 1,381 occurrences of INDEXmin alerts, 43% were accompanied by INSTABILITYmin. When episodes were both INSTABILITYmin and INDEXmin, the INDEX alert state ensued before the patient crossed over an INSTABILITY concern threshold in 80% of occurrences, with a mean advance time of 9.4 ± 9.2 mins. Episodes that were isolated INSTABILITYmin (no coexistent INDEX alert within the episode) tended to be very short, with only 98% of isolated INSTABILITYmin having a duration of <4 mins. Because INDEX alert requires an abnormality duration of >4 mins, these data suggest that the isolated INSTABILITYmin episodes were fleeting.
Table 2.
Correlation between instability states according to the University of Pittsburgh Medical Center cardiorespiratory instability concern criterion (INSTABILITY) and the integrated monitoring system index alert state (INDEX) for phases I and III combined (n = 631)
| Instability Category | Spearman’s rho Correlation Coefficient | p |
|---|---|---|
| Number of INSTABILITY episodes | ||
| INSTABILITYhit and INDEXhit | .664 | <.0001 |
| INSTABILITYmin and INDEXmin | .714 | <.0001 |
| INSTABILITYfull and INDEX full | .792 | <.0001 |
| Duration of INSTABILITY episodes | ||
| INSTABILITYhit and INDEXhit | .641 | <.0001 |
| INSTABILITYmin and INDEXmin | .713 | <.0001 |
| INSTABILITYfull and INDEX full | .815 | <.0001 |
hit, vital-sign-monitoring parameters across instability concern thresholds for any cause, including artifact; min, subset of hit for instability that was physiologically real (i.e., nonartifactual) even if transient; full, subset of min for instability judged as serious and persistent and in need of intervention.
Comparisons of P1 and P3 Cohorts
Data from 326 monitored patients in P1 and 306 patients in P3, representing all patients admitted to this SDU during these intervals, were studied. Seven deaths occurred in P1 (2%) and three in P3 (1%). Six of seven deaths in P1 were unexpected (one patient had a comfort-measures-only designation) whereas there were no unexpected deaths in P3 (all comfort measures only). We eliminated deceased patients from the analyses to minimize confounding of the instability duration data (i.e., spuriously short or long depending on when death occurred following the instability onset). Comparison of the demographic characteristics of the remaining patients in P1 (n = 319) and P3 (n = 303) revealed no significant between-phase differences in the cohorts (Table 3). Three subjects, all in P1, were extreme outliers with respect to both the number and duration of instability episodes. Their values were truncated to the value of the fourth-highest subject to minimize impact on data distribution.
Table 3.
Comparison of phase I and phase III patient demographics (alive, n = 622)
| Demographics | Phase I (n = 319) | Phase III (n = 303) | p |
|---|---|---|---|
| Age (mean years) | 57.5 ± 20 | 57.4 ± 20 | .935 |
| Gender (%) | |||
| Male | 58.9% | 58.7% | .962 |
| Race (%) | .391 | ||
| White | 73.4% | 71.9% | |
| Black | 12.9% | 13.9% | |
| Other | 13.7% | 14.2% | |
| Past medical history (%) | |||
| Myocardial infarction | 12% | 8% | .100 |
| Congestive heart failure | 13% | 8% | .30 |
| Peripheral vascular disease | 9% | 12% | .211 |
| Cardiovascular disease | 5% | 7% | .309 |
| Chronic obstructive pulmonary disease | 20% | 16% | .239 |
| Peptic ulcer disease | 3% | 2% | .452 |
| Diabetes mellitus | 25% | 16% | .010 |
| Renal | 1% | 1% | .687 |
| Malignancy | 3% | 2% | .49 |
| Charlson comorbidity index score (Deyo method) (%) | .162 | ||
| 0 | 45.1% | 53% | |
| 1 | 22.4% | 24.2% | |
| 2 | 16.4% | 13.2% | |
| 3 | 7.3% | 3.3% | |
| 4 | 4.1% | 3% | |
| 5 | 2.5% | .7% | |
| 6 | .9% | 1.3% | |
| 7 | .6% | .7% | |
| 8 | .3% | .3% | |
| 9 | .3% | .3% | |
| Admitting diagnosis by ICD-9 code | .322 | ||
| 959 Injury | 39.5% | 47.2% | |
| 780 General symptoms | 5.3% | 2.0% | |
| 786 Respiratory system/other chest | 5% | .7% | |
| 789 Other abdominal/gastrointestinal | 1.6% | 3% | |
| 444 Arterial embolism | 3.5% | 1.7% | |
| 560 Intestinal obstruction | 3% | 2.3% | |
| Other (≤2/code category) | 42% | 43.1% |
P1 and P3 were similar in total monitoring hours (18,258 hrs vs. 18,314 hrs), average monitoring hours/admission (54 hrs vs. 58 hrs), and median monitoring hours/admission (27 hrs vs. 34 hrs). Four P1 and five P3 patients who were discharged and readmitted to the study unit in the same hospitalization were treated as new admissions, yielding 323 P1 and 308 P3 admissions.
When examining the overall impact of the project upon the unit as a whole (Fig. 2), the cumulative number of episodes in the phase wherein patients were across instability criterion thresholds decreased in P3 by 58% from P1 (Fig. 2A). Likewise, the cumulative duration of time that patients on the unit spent across instability concern thresholds decreased in P3 by 60% from P1 (Fig. 2B). When looking descriptively at the per-patient impact (Table 4), the mean number of occurrences that patients were in INSTABITY states decreased in P3, as did the mean duration of time patients spent in unstable states.
Figure 2.

Comparison of the cumulative number of occurrences in which patients were across the thresholds of instability concern criteria for each phase (A), and cumulative duration of time in which patients were across the thresholds (B). hit, vital-sign-monitoring parameters across instability concern thresholds for any cause, including artifact; min, subset of hit for instability that was physiologically real (i.e., nonartifactual) even if transient; full, subset of min for instability judged as serious and persistent and in need of intervention; INSTABILITY, vital sign monitoring parameters were beyond instability-concern thresholds.
Table 4.
Comparison of the mean numbers of times admissions in each phase experienced an episode of instability and mean durations of times admissions in each phase were in unstable states (n = 631)
| Parameter | Phase I | Phase III |
|---|---|---|
| Total number of admissions alive at discharge | 323 | 308 |
| INSTABILITYhit episodes (mean ± sd) | ||
| Average number of INSTABILITYhit per admission (mean) | 4.0 ± 9 | 2.5 ± 5 |
| Average duration of INSTABILITYhit per admission (mean min) | 57 ± 129 | 25 ± 57 |
| INSTABILITYmin episodes (mean ± sd) | ||
| Average number of INSTABILITYmin per admission (mean) | 2.2 ± 6 | 1.5 ± 4 |
| Average duration of INSTABILITYmin per admission (mean min) | 28 ± 76 | 13 ± 41 |
| INSTABILITYfull episodes (mean ± sd) | ||
| Average number of INSTABILITYfull per admission (mean) | .9 ± 3 | .4 ± 1.5 |
| Average duration of INSTABILITYfull per admission (mean min) | 16 ± 53 | 7 ± 27 |
hit, vital-sign-monitoring parameters across instability concern thresholds for any cause, including artifact; min, subset of hit for instability that was physiologically real (i.e., nonartifactual) even if transient; full, subset of min for instability judged as serious and persistent and in need of intervention.
When performing statistical comparisons of the number of admissions experiencing at least one episode of an instability state per phase (Table 5), similar percentages of admissions experienced INSTABILITYmin in P1 and P3 (35% vs. 33%, p = .57), and there was a nonsignificant trend toward fewer admissions progressing to INSTABILITYfull in P3 (INSTABILITYfull 20% vs. 15%, p = .09).
Table 5.
Statistical comparisons of the number of admissions experiencing at least one episode of an instability state for phases I and III (n = 631)
| Parameter | Phase I | Phase III | p |
|---|---|---|---|
| Total number of admissions alive at discharge | 323 | 308 | |
| INSTABILITY | |||
| Admissions at least one INSTABILITYhit episode (n, %) | 173 (52%) | 158 (51%) | .57 |
| Admissions at least one INSTABILITYmin episode (n, %) | 114 (35%) | 102 (33%) | .565 |
| Admissions at least one INSTABILITYfull episode (n, %) | 68 (20%) | 48 (15%) | .09 |
Hit, vital-sign-monitoring parameters across instability concern thresholds for any cause, including artifact; min, subset of hit for instability that was physiologically real (i.e., nonartifactual) even if transient; full, subset of min for instability judged as serious and persistent and in need of intervention.
Due to the non-normality of the distribution in both the numbers and duration of instability episodes across subjects (skewing toward zero; wide variability), a post hoc categorization of the numbers of instability episodes and duration of instability was determined after evaluating the total sample distribution. Based on the distribution, the number of instability occurrences (number of times each individual admission went beyond instability concern threshold) were categorized as follows: INSTABILITYhit: none, 1–10, 11–20, >20; INSTABILITYmin: none, 1–5, 6 –10 and >10; and INSTABILITYfull: none, 1–2, 3–4, >4. The data for duration of instability per admission (total duration of time each individual admission was beyond instability concern threshold) were categorized as follows: none (never any instability), 1–30, 31–90, and >90 mins. Although of INSTABILITYmin occurrences were experienced by similar percentages of admissions (Fig. 3), the duration of time each spent in the INSTABILITYmin state decreased in P3 (p = .018). This decrease in was most prominently noted in the INSTABILITYmin duration categories of 31–90 mins (8.7% vs. 6.2%) and >90 mins (10.2% vs. 4.9%). The number of INSTABILITYfull occurrences experienced per admission significantly decreased in P3 (p = .033), and there was significantly less time spent in INSTABILITYfull per admission (p = .05), most notably in the >90 mins category (5.9% vs. 2.3%) (Fig. 3).
Figure 3.
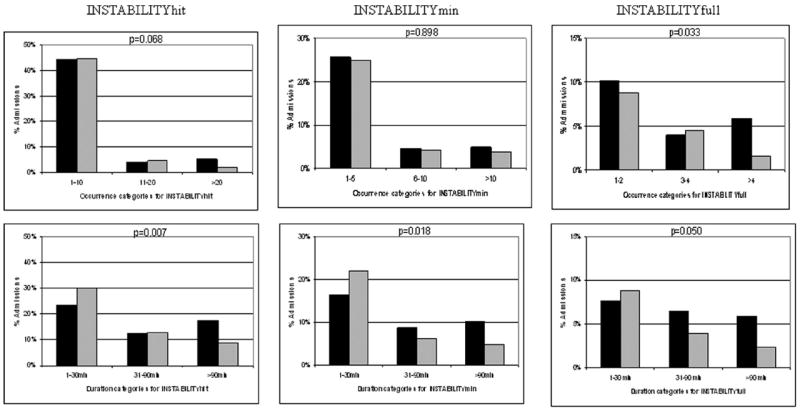
Comparisons of instability for only patients who experienced it in phase 1 (black bars) and phase 3 (gray bars). The percentages of admissions in each phase are compared with respect to the number of times each individual went beyond the instability concern threshold (top row) and the duration of time each individual spent in an instability state (bottom row). hit, vital-sign-monitoring parameters across instability concern thresholds for any cause, including artifact; min, subset of hit for instability that was physiologically real (i.e., nonartifactual) even if transient; full, subset of min for instability judged as serious and persistent and in need of intervention; INSTABILITY, vital sign monitoring parameters were beyond instability-concern thresholds.
Finally, there were 68 INSTABILITYfull admissions with seven MET activations for cardiorespiratory causes in P1 (1 MET call for every 9.7 INSTABILITYfull admissions) compared with only 48 INSTABILITYfull admissions with nine MET activations in P3 (1 MET call for every 5.3 INSTABILITYfull admissions).
DISCUSSION
Our study, which provides information on the largest continuous collection of cardiorespiratory variables in a non-ICU patient population to date, has three important findings. First, there was a high degree of correlation between cardiorespiratory instability (according to continuously derived vital sign data excursion beyond our instability thresholds) and the IMS alert detection of an unstable state. Further, the IMS alert preceded the achievement of vital sign instability concern thresholds in the majority of cases. Second, the majority of SDU patients remained stable throughout their stay, and those who did have an episode of instability were nevertheless stable most of the time, demonstrating that the preponderance of patients who are judged by providers to be at risk for instability requiring SDU evaluation in fact never became unstable. Thus, we conclude that there is a need for better predictive models to identify patients with higher instability risk warranting SDU care while triaging those not predicted to become unstable to lower-cost areas. Third, the use of an IMS to alert staff to an instability episode was associated with a marked decrease in both instability duration and the numbers of occurrences of serious instability episodes per admission.
With regard to our first finding, the derived INDEX values were closely correlated to cardiorespiratory instability once the INDEX alert threshold was adjusted for the SDU patient population. This is the first literature reporting use of an IMS to detect instability in an SDU. The IMS was adjusted to alert at a threshold sensitive and specific to the vital sign abnormalities related earlier. Further, using the IMS alerts to call staff attention to unstable patients was associated with a concordant decrease in the presence of criterion-defined instability. Patients satisfying abnormal vital sign criteria (including ours) (4), and some by use of cardiorespiratory instability concern criteria that were even less restrictive than ours (9-11), have been repeatedly shown to be at increased risk for death. Using an IMS that is sensitive and specific in alerting staff to the unstable state may prove to be beneficial. In addition, the IMS detected instability in advance of reaching our criterion threshold for single vital sign abnormality in the majority of cases. Using the IMS INDEX as the actionable alarm also has the potential to decrease “nuisance” alarms. Nuisance alarms are typically due to artifact and do not result from an adverse condition but may cause alarm fatigue and delay reaction time or reduce the probability of the nurse responding (12, 13). Because 98% of isolated INSTABILITYmin episodes that were not accompanied by an INDEX alert were of <4 mins in duration, and since the IMS INDEX alert requires >4-min abnormal values to trigger, these data suggest that the isolated INSTABILITYmin episodes were primarily fleeting deviations of individual monitor alarms that self-corrected. Therefore, using IMS alerts instead of vital sign alerts to warn the nurse of instability has the potential to reduce markedly the number of false positive alerts to which nurses respond. Of course, some vital sign alerts need to be continued because of the benefit of immediate response to such events as asystole or apnea where a 4-min delay is unacceptable.
Active IMS monitoring did not alter the number of patients who experienced at least one INSTABILITYmin episode per phase, implying that the IMS does not change the propensity of patients to initially develop instability. However, IMS monitoring in conjunction with our clinical action algorithm was associated with a decrease in the number of instability occurrences each patient experienced once the patient became unstable, as well as the time spent in the unstable state. In addition, the data demonstrated that in P3 there was an increase in the likelihood that the MET would be activated for serious instability. A scientific trial with both more patients and more rigors in educational reinforcement than is possible within the context of a quality improvement project might yield even more impressive results. Nevertheless, the importance of improving nurses’ ability to detect instability cannot be overemphasized. A recent review showed that episodic insufficiency had occurred in advance of 51–86% of cardiopulmonary arrests (14). In addition, a post hoc analysis of the medical early response intervention and therapy cluster randomized, controlled trial of MET deployment (23 public hospitals in Australia across 700,000 admissions) found that MET activation, when called in advance of cardiac arrest, reduced unexpected cardiac deaths, overall cardiac arrests, and overall unexpected deaths, supporting the approach that early review of instability is desirable (15).
Our data also demonstrated that instability is usually associated with repetitive cycling of vital signs above and below critical values. Patterns of circulatory deterioration before death display similar cycles over several hours preceding trauma-related death (16). Even in instability that does not progress to death, our patients cyclically deteriorated, rallied, and deteriorated again until compensatory mechanisms were eventually exhausted and alerts were persistent (example in Fig. 4). These cyclic patterns lend insight into why, when direct observation of SDU patients by caregivers is only intermittent (even when supplemented by traditional continuous single-parameter noninvasive monitoring), instability can be missed (17). Our data further demonstrated that IMS implementation was associated with a decrease in the average number of INSTABILTYfull occurrences for each patient experiencing that state, as well of the duration of time they spent in INSTABILITYfull. Nevertheless, how decreasing instability occurrences and duration definitively translates into improved patient outcomes will require further study. ICU patients appear to respond better to interventions when their deterioration is identified earlier (15, 18). Whether earlier identification of unstable SDU patients impacts the response to therapy and both physiologic and resource utilization outcomes must still be explored.
Figure 4.

Example from phase 1 of cyclic nature of instability episodes ramping upward to form instability events, which can be unrecognized in the early stages with only intermittent observation. A, The patient begins to have decrease in SpO2 shortly after 2:30 AM, which triggers tachypnea and resultant rise in heart rate briefly. B, Between 6:00 AM and 9:00 AM, SpO2 persistently trends downward. C, Between 10:00 AM and 2:30 PM, there are five bouts of instability episodes. VSI, Visensia Index; HR, heart rate; BP, blood pressure; RR, respiratory rate; SpO2, peripheral oxygen saturation.
Our study has several limitations. We did not gather data on how using the IMS impacted care delivery once it called clinicians to the bedside. We have anecdotal information that nurse attention was called to the patient sooner yet parsimoniously but cannot demonstrate that interventions were applied earlier. In future studies, information regarding the time from alert to intervention and the types of interventions will need to be determined to demonstrate definitively whether this technology was causative of the associations noted. Also, we did not gather information from the nurses on their satisfaction with or impressions of the IMS, although informal feedback was favorable. Also, our study was underpowered to detect any change in patient outcomes based on IMS utilization. Aiken et al (19) identified that the odds of patient mortality increase by 7% for each additional patient added to a nursing caseload of four patients. Thus, identifying means to improve the ability of nurses to monitor patients for deterioration in SDU settings by using systems that are both effective and efficient is vital. Although using the IMS decreased both the number of seriously unstable patients and the duration of instability, further study to determine whether IMS use in larger cohorts can demonstrate impact on patient outcomes and resource utilization is needed.
CONCLUSIONS
Our data demonstrate that an IMS-alerting system can be adjusted to be highly correlative with cardiorespiratory instability concern criteria in SDU patients. We further demonstrate that an IMS can detect cardiorespiratory instability effectively and in most cases sooner than when traditional single vital sign parameter alerts are utilized by nurses caring for multiple patients in the SDU environment. Using the IMS was associated with a decreased duration of instability and decreased incidence of serious instability. Finally, using the IMS increased the likelihood that the MET team would be called for serious instability.
Acknowledgments
Supported, in part, by the U.S. Department of Health and Human Services, National Heart, Lung and Blood Institute (HL67181). OBS Medical (Carmel, IN) provided the Visensia monitors on a rent-free lease agreement.
Footnotes
The authors have not disclosed any potential conflicts of interest.
References
- 1.Hravnak M, Edwards L, Clontz A, et al. Defining the incidence of cardiorespiratory instability in patients in step-down units using an electronic integrated monitoring system. Arch Intern Med. 2008;168:1300–1308. doi: 10.1001/archinte.168.12.1300. [DOI] [PMC free article] [PubMed] [Google Scholar]
- 2.US Department of Health and Human Services, Agency for Healthcare Research and Quality. AHRQ Quality Indicators: Patient Safety Indicators. Rockville, MD: Agency for Healthcare Research and Quality; 2006. [Google Scholar]
- 3.Devita MA, Bellomo R, Hillman K, et al. Findings of the first consensus conference on medical emergency teams. Crit Care Med. 2006;34:2463–2478. doi: 10.1097/01.CCM.0000235743.38172.6E. [DOI] [PubMed] [Google Scholar]
- 4.Smith GB, Prytherch DR, Schmidt PE. Review and performance evaluation of aggregate weighted ‘track and trigger’ systems. Resuscitation. 2008;77:170–179. doi: 10.1016/j.resuscitation.2007.12.004. [DOI] [PubMed] [Google Scholar]
- 5.Subbe CP, Kruger M, Rutherford P, et al. Validation of a modified Early Warning Score in medical admissions. QJM. 2001;94:521–526. doi: 10.1093/qjmed/94.10.521. [DOI] [PubMed] [Google Scholar]
- 6.Tarassenko L, Hann A, Young D. Integrated monitoring and analysis for early warning of patient deterioration. Br J Anaesth. 2006;97:64–68. doi: 10.1093/bja/ael113. [DOI] [PubMed] [Google Scholar]
- 7.Tarassenko L, Hann A, Patterson A, et al. Biosign: Multi-parameter monitoring for early warning of patient deterioration. Medical Applications of Signal Processing; 3rd IEE International Seminar on Medical Applications of Signal Processing; London, UK. 2005. pp. 71–76. [Google Scholar]
- 8.DeVita MA, Braithwaite RS, Mahidhara R, et al. Use of medical emergency team responses to reduce hospital cardiopulmonary arrests. Qual Saf Health Care. 2004;13:251–254. doi: 10.1136/qshc.2003.006585. [DOI] [PMC free article] [PubMed] [Google Scholar]
- 9.Bell MB, Konrad D, Granath F, et al. Prevalence and sensitivity of MET-criteria in a Scandinavian university hospital. Resuscitation. 2006;70:66–73. doi: 10.1016/j.resuscitation.2005.11.011. [DOI] [PubMed] [Google Scholar]
- 10.Fuhrmann L, Lippert A, Perner A, et al. Incidence, staff awareness and mortality of patients at risk on general wards. Resuscitation. 2008;77:325–330. doi: 10.1016/j.resuscitation.2008.01.009. [DOI] [PubMed] [Google Scholar]
- 11.Burch VC, Tarr G, Morroni C. Modified early warning score predicts the need for hospital admission and inhospital mortality. Emerg Med J. 2009;26:466. doi: 10.1136/emj.2007.057661. [DOI] [PubMed] [Google Scholar]
- 12.Graham KC, Cvach M. Monitoring alarm fatigue: Standardizing use of physiological monitors and decreasing nuisance alarms. Am J Crit Care. 2010;19:28–34. doi: 10.4037/ajcc2010651. quiz 35. [DOI] [PubMed] [Google Scholar]
- 13.Korniewicz DM, Clark T, David Y. A national online survey on the effectiveness of clinical alarms. Am J Crit Care. 2008;17:36–41. [PubMed] [Google Scholar]
- 14.Naeem N, Montenegro H. Beyond the intensive care unit: A review of interventions aimed at anticipating and preventing inhospital cardiopulmonary arrest. Resuscitation. 2005;67:13–23. doi: 10.1016/j.resuscitation.2005.04.016. [DOI] [PubMed] [Google Scholar]
- 15.Chen J, Bellomo R, Flabouris A, et al. The relationship between early emergency team calls and serious adverse events. Crit Care Med. 2009;37:148–153. doi: 10.1097/CCM.0b013e3181928ce3. [DOI] [PubMed] [Google Scholar]
- 16.Chien LC, Lu KJ, Wo CC, et al. Hemodynamic patterns preceding circulatory deterioration and death after trauma. J Trauma. 2007;62:928–932. doi: 10.1097/01.ta.0000215411.92950.72. [DOI] [PubMed] [Google Scholar]
- 17.DeVita MA, Smith GB, Adam SK, et al. “Identifying the hospitalised patient in crisis”—A consensus conference on the afferent limb of rapid response systems. Resuscitation. 2010;81:375–382. doi: 10.1016/j.resuscitation.2009.12.008. [DOI] [PubMed] [Google Scholar]
- 18.Downey AW, Quach JL, Haase M, et al. Characteristics and outcomes of patients receiving a medical emergency team review for acute change in conscious state or arrhythmias. Crit Care Med. 2008;36:477–481. doi: 10.1097/01.CCM.0000300277.41113.46. [DOI] [PubMed] [Google Scholar]
- 19.Aiken LH, Clarke SP, Sloane DM, et al. Hospital nurse staffing and patient mortality, nurse burnout, and job dissatisfaction. JAMA. 2002;288:1987–1993. doi: 10.1001/jama.288.16.1987. [DOI] [PubMed] [Google Scholar]