Abstract
This paper presents results from an investigation on a special optical fiber as a load sensor for application in Weigh-in-Motion (WIM) systems to measure wheel loads of vehicles traveling at normal speed on highways. The fiber used has a unique design with two concentric light guiding regions of different effective optical path lengths, which has the potential to enable direct measurement of magnitudes as well as locations of forces acting at multiple points along a single fiber. The optical characteristic of the fiber for intended sensing purpose was first assessed by a simple fiber bending experiment and by correlating the bend radii with the output light signal intensities. A simple laboratory load transmitting/fiber bending device was then designed and fabricated to appropriately bend the optical fiber under applied loads in order to make the fiber work as load sensor. The device with the optical fiber was tested under a universal loading machine and an actual vehicle wheel in the laboratory. The test results showed a good relationship between the magnitude of the applied load and the output optical signal changes. The results also showed a good correlation between the time delay between the inner and outer core light pulses and the distance of the applied load as measured from the output end of the fiber.
Keywords: Fiber optics sensor, Weigh-In-Motion (WIM), Highway vehicle weight, Vehicle wheel Loads, Traffic data collection, Civil infrastructure monitoring
1. Introduction
Accurate measurement of static axle or wheel load has long been a major objective of highway engineers. The static weight of a vehicle is used to provide a basis for pavement analysis and design. Traditionally, these weights have been collected by pulling the vehicles off the roadway and weighing them at weigh stations while the vehicles are at rest. The static weighing of vehicles in highways has several disadvantages, including being time consuming, expensive, and dangerous on heavily traveled roads.
The concept of Weigh-In-Motion (WIM) was introduced more than fifty years ago [1]. WIM is the process by which the static weights of vehicles are determined by measuring wheel loads while the vehicles are in motion. There are several advantages of weighing vehicles while they are in motion rather than at rest [2]. These include savings in time and cost, and being safer to operate on busy roads.
A number of different WIM systems for weighing highway vehicles have been developed during the past five decades [2-4]. These systems have been used generally by public agencies for collecting vehicle weights as well as several other statistical traffic data to aid in the pavement design, construction, and maintenance, highway safety assessment and improvement, and other several transportation and highway related planning and decision making objectives (For example, see [2-9]). The three WIM systems that are used most often are capacitive pad transducers, piezoelectric cables, and load cell systems. However, these WIM systems can give inconsistent readings due to temperature fluctuations, vehicle speed variations and environmental factors. They are also relatively complex in design and require complex data acquisition and analysis systems. An extensive evaluation of the advantages and disadvantages of these systems have been reported (see for example, Refs. [3-6]).
Sensing systems based on fiber optics have found increasing applications in telecommunications, electrical devices, aerospace structures and in the medical field. Optical fibers have several positive attributes, including small diameter, light weight, immunity to electromagnetic interference, utility in hostile environments (such as in presence of high voltage and high temperature), high sensitivity and ability to sense as well as transmit information. Due to these positive attributes of optical fibers, efforts have been directed towards developing sensors for civil engineering infrastructures, including WIM systems and bridge monitoring, using fiber optics technology [10-24]. Optical fiber techniques proposed for WIM systems, include those based on light polarization and interferometry [10,15,17,23], bending loss, modulation of light intensity through an optical fiber having a single core [11, 13, 14], and on the concept of bragg grating [19, 20, 24]. However, none of these have found widespread practical use so far.
Mechanical forces acting at different points on an optical fiber, which cause the ejection of light propagating along the fiber core due to bending, have been estimated previously using the optical time domain reflectometry (OTDR) technique. This technique determines the magnitudes of the forces by measuring the decrease they cause on the intensity of the Rayleigh-backscatter from the interrogating light pulses. A serious shortcoming of this technique, besides its polarization variant, is that it throws away the ejected light, and instead it provides an estimate of its intensity indirectly from a difference between two weak and noisy Rayleigh-backscatter signals.
Other fiber optic techniques investigated for WIM systems include those based on light polarization, interferometry [10,15]; measurement of transmitted light intensity through the fiber having a single core [11, 13, 14]; and on the concept of fiber Bragg grating [17,18,14]. Interferometric techniques are complicated and require a different interferometer for each fixed sensing point, separated from other interferometers by a system of fiber optic couplers. The main disadvantage of the polarization technique is that a polarization change at any point along the fiber affects the polarization state of the fiber at other sensing points. The technique based on the light transmission through a single core fiber has the drawback of not being able to determine locations of forces/weight (or deflection/bending) applied at multiple points along the fiber length. The fiber Bragg grating sensors are less sensitive than interferometric sensors [12] and has limitations on number of gratings that can be written and its dynamic range to detect fast moving forces/loads.
The optical fiber investigated in this study allows capture and direct measurement, by forward time division multiplexing (FTDM), of the light escaped out of the fiber core caused by forces acting at multiple points along the fiber length, and thus generating stronger light signals than Rayleigh backscattered signals. This special FTDM fiber has shown its potential ability to directly sense and measure magnitude as well as location of forces/loads [25-26]. It has the potential to measure magnitudes and locations of forces/deflections applied at the multiple points simultaneously on the same fiber. For highway data collection applications, this can facilitate measurement of wheel loads of vehicles moving in multiple lanes as well as several other important parameters, such as vehicular speed, inter-axle distance, width of the vehicles, etc.
This paper presents results from laboratory studies done on the special FTDM optical fiber having two concentric light guiding regions to measure magnitude as well as locations of an applied forces/loads, with specific application in measuring wheel loads of vehicles traveling at normal speed in highways. The principle of load sensing is based on light loss under the bending of the fiber. Changes in output light intensity in the fiber due to various bending radii were evaluated. A simple laboratory device to transmit the applied load to the fiber and bending of the fiber was designed and fabricated. With this device the fiber was tested under loading machine and a passenger vehicle wheel load in the laboratory.
2. Description of Optical Fiber and Load/ Force Sensing Concept
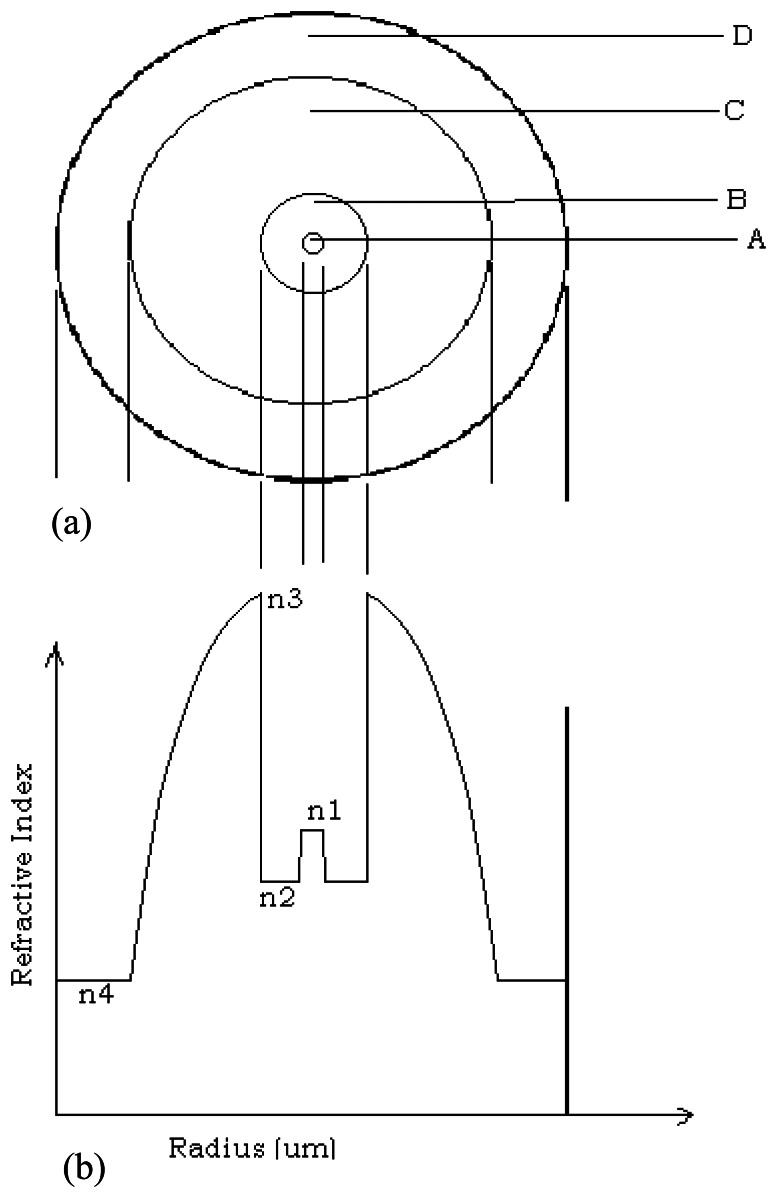
Schematic diagrams of the cross section and the refractive index profile of the special fiber evaluated for load sensing in this study are shown in Figure 1 [25-26]. The fiber structure is based on the Forward Time Division Multiplexing (FTDM) principle. The fiber comprises of the four concentric regions (Figure 1a): (i) a small single mode central (inner) core light guiding region (A), (ii) a cladding (B) around the single mode core, (iii) a second multimode graded index light-guiding region (C) around cladding, B, and finally (iv) an outer cladding region (D).
Figure 1.
Dual core FTDM fiber (a) cross-section, (b) schematic of representative refractive index Profile.
When a train of light pulses of short duration is launched into the fiber core at one end, a lateral mechanical force applied at any point along the fiber will cause bending of the fiber and as a result deflect a fraction of the intensity of each of these interrogating light pulses from the inner core, A, to the graded index region, C (outer core). Because of the arrangement of the refractive index profile of the fiber (Figure 1b), the deflected light is captured within this graded index core, C, and transmitted to the other end of the fiber.
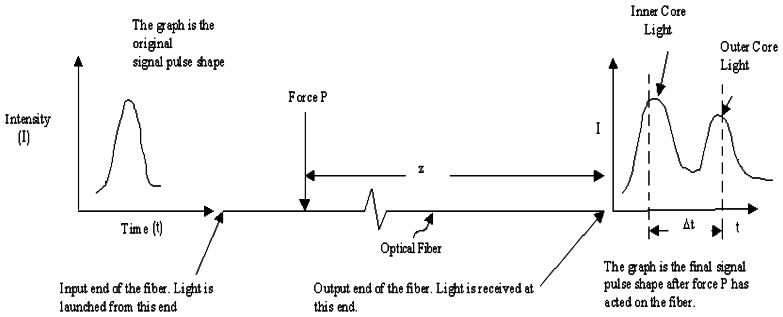
Since the refractive index of the outer light guiding region, C, is substantially greater than the refractive index of the inner light guiding region, A, the light pulses carried by the outer core will arrive at the fiber output end Δt seconds after the arrival of the undeflected light pulses transmitted by the central inner core (Figure 2). This time difference or interval is proportional to the distance of the location at which the force is applied measured from the output end of the fiber.
Figure 2.
Input and output light signals through the fiber.
For practical purposes, this relation between the time delay (Δt) between the inner and outer light peaks and the distance of the bend or the applied load from the output end of the fiber can be written as:
| (1) |
where z is the distance from the output end of the fiber to the location where the force is applied; c is the speed of light in free space; and (n1)eff and (n3)eff are effective values of refractive indices, n1 and n2 of inner and outer core regions respectively as shown in Figure 1 and (Δn31)eff is the difference between these effective refractive index values of the inner and outer light guiding regions.
Since some of the light escapes into the outer core, there is a loss in the intensity of the light traveling in the inner core. The magnitude of the force that bends the fiber can be determined from the changes in the intensities of the light signals traveling along the inner and/or outer cores.
3. Investigation of Fiber Light Loss Characteristics by Bending
This section describes laboratory tests on the optical fiber to determine the light loss due to bending and presents some of the more significant results.
3.1. Experimental Set-up
The experimental set-up for the fiber bending test is shown in Figure 3. The experimental set up consisted of the following main components:
A light source. (This consisted of a laser diode driven by a pulse generator.)
The dual core FTDM optical fiber.
The apparatus for receiving the light pulses and converting the light energy to electrical energy. (This consisted of the photo detector).
The apparatus to display the output electrical signals. (This was the oscilloscope.)
Figure 3.
Optical fiber experimental/ test set-up.
In the laboratory experiment, the interrogating light pulses were obtained by modulating the laser diode with a pulse generator (Avtech Model no. AVM-2-C). The pulsed light beam from the laser diode was focused with a lens system onto the fiber so that the light entered the inner core. Fiber holders were used to firmly position the input end of the fiber.
3.2. Physical Properties of the Fiber Used
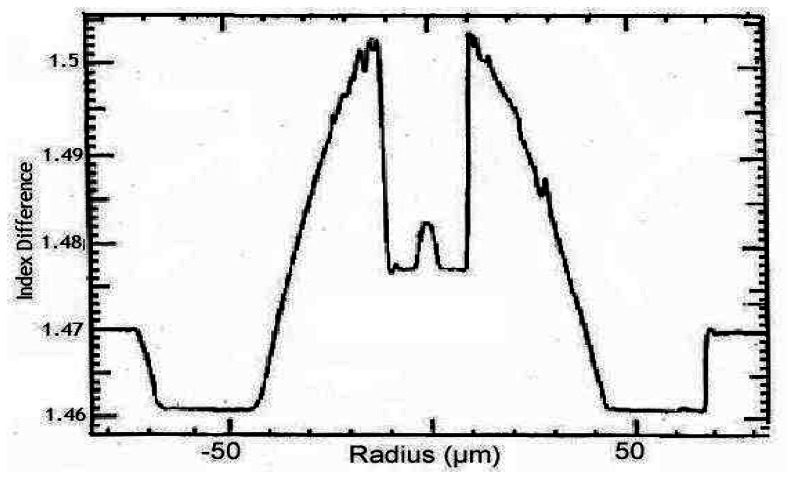
A fiber having outer diameter of 140 μm was used for the results presented in this paper. Dimensions and refractive index values of various regions of the fiber cross-section are shown in Figure 4. These values are approximately as follows: (1) Inner single mode core, A: Diameter ≈ 7μm; Refractive index, n1 ≈ 1.4826; (2) Inner cladding, B: Outer diameter ≈ 18 μm; Refractive index, n2 ≈ 1.4771; (3) Outer multimode light guiding core, C: Outer diameter ≈ 85 μm; Refractive index, n3 ≈ 1.5030; and (4) Outer cladding, D: Outer diameter ≈ 140 μm (outermost diameter of the fiber); Refractive index, n4 ≈ 1.4607.
Figure 4.
Refractive index profile of 140-μm outer diameter dual core FTDM fiber.
3.3. Optical Characteristics of Fiber - The Bending Experiment
The optical characteristic of the fiber was assessed by bending the fiber by hand and measuring the output light signals. The purpose of these bending tests was to validate the theoretical principle of the fiber and to study the relationship between the degree of bending and the optical signal output. This information is crucial in designing the mechanical system that is needed to transmit wheel load to the fiber. The 140 μm outer diameter fiber having approximately 100 m length was bent at a point into circular loops of different radii near the light input end of the fiber. The corresponding light output signals were measured using the HP 54720D oscilloscope.
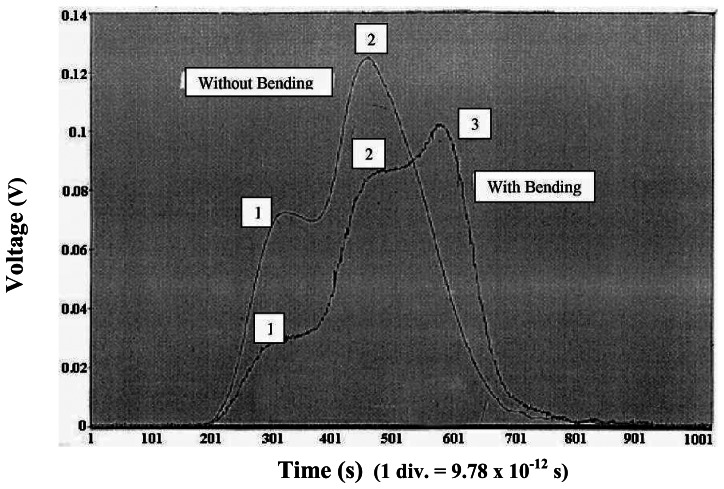
Figure 5 shows representative oscilloscope traces of the output signals from the fiber with and without bending. The oscilloscope trace with peaks 1 and 2 corresponds to the case when there was no bending. Peak 1 corresponds the output light from the inner core. The exact cause for Peak 2 could not be identified. Several possible causes could give rise of the extra peak [26, 27]. Some possible reasons for this extra peak could be attributed to the fabrication of the fiber and/or to the combination of light being launched directly from the source into the outer core (graded index multi mode region) and mode mixing of the light in this region. When the fiber was bent, the inner core light pulse (Peak 1) decreased while a new pulse (Peak 3) to the right of the inner core light pulse appeared. This light peak (Peak 3) corresponds to the light output from the outer core that was leaked from the inner core to the outer core at the bending location of the fiber.
Figure 5.
Oscilloscope traces of the output light pulses from the special fiber with and without bending cases.
From the oscilloscope traces (Figure 5), it can be readily seen that for the bending introduced near the light input end of the approximately 100 m long fiber (i.e. z ≈ 100 m), the time delay (Δt) between the inner and outer core peaks (1 and 3) is about 2.2494 × 10⁻⁹ s. With the value of speed of light (c) equal to 3 × 10⁸ m/s, the effective difference in refractive index values (Δn31)eff between the inner and outer light guiding regions of the optical fiber can be determined from Equation (1) as equal to approximately 0.00675.
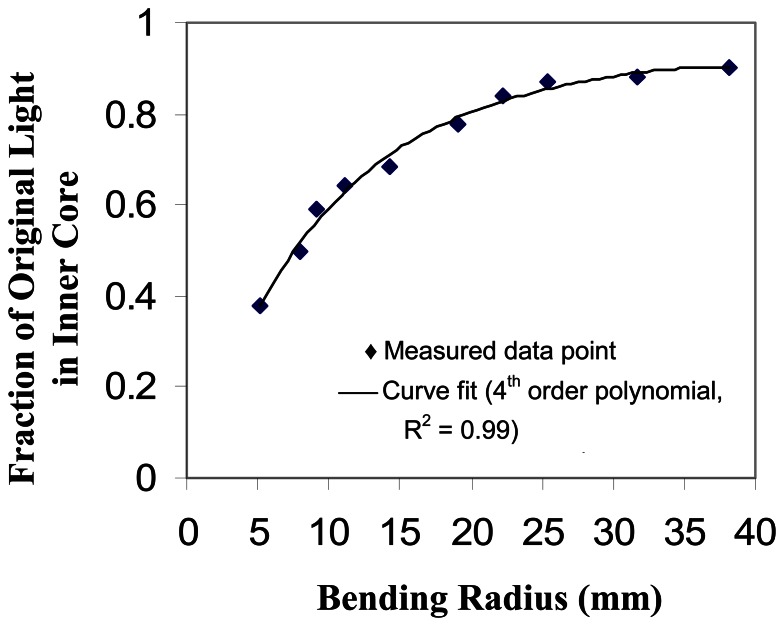
Figure 6 shows the calibration curve developed between the bending loop radius versus the amount of inner core light output (Peak 1, Figure 5) expressed as a fraction of the light intensity before the fiber was bent. It was observed that a 10% decrease in the magnitude of the light in the inner core (i.e. 90% of the original value) corresponds to a bend radius of 36 mm. A 50% decrease in light corresponds to a bend radius of 7 mm. The experiment also gave us the range of the fiber loop radius for which we get a distinct output signal. The minimum radius of circular loop that gave maximum leakage of light from the inner core to outer core without breaking was 5.5 mm. The maximum loop radius above which we did not observe any change in the inner core signal was 70 mm.
Figure 6.
Bending radius of fiber loop vs. fraction of original light in inner core.
4. Development and Fabrication of Load Transmitting/Fiber Bending Device
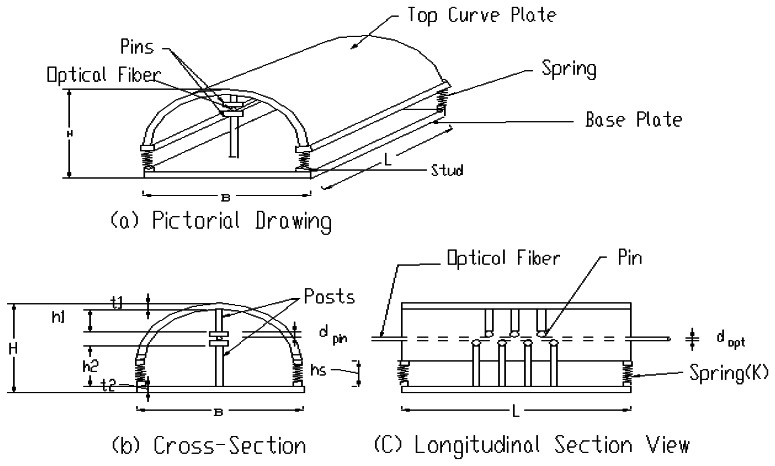
For the fiber to act as a load sensor, a device is necessary to bend the fiber when a load (e.g. a vehicle wheel load) is applied. The schematic diagrams of a laboratory load transmitting/fiber bending device used in this study are shown in Figure 7 [27-28]. The device was based on a pin and spring mechanism. It consisted of a semi-circular steel top supported by four springs supported at the four corners on a steel base plate. There were two rows of circular pins of diameter approximately 0.953 cm (0.375 in) arranged in staggered fashion. One row of pins was attached to the semi circular top and the other attached to the steel plate below. The center to center spacing between any two pins in a row was approximately 2.07 cm (0.815in). The spring constant, pin diameter, and spacing between the pins were adequately selected to introduce suitable bending of the fiber to have the proper amount of light leakage from the inner core to the outer core of the fiber.
Figure 7.
Schematic of fiber bending/load transmitting device.
The optical fiber was placed between the top and bottom layers of the pins and load applied on top of the device. The spring serves a few important roles. First, upon the application of load on the top surface, the springs get compressed causing the upper pins to push down on the fiber and create desired bending of the fiber. Second, after the removal of the load, e.g. passage of a vehicle wheel, the springs return to their original position bringing the fiber in the straight horizontal position. Third, by choosing springs with a proper spring constant, they can be designed to carry excessive loads and thus prevent the fiber from breaking. The top of the device was designed curved keeping in mind the following major practical benefits: the curve surface allows vehicles to pass over the device smoothly. For durability purpose, it is desirable that the device be placed underground. This will prevent the device from being removed by snow plowing machine and damaged by other elements. The curve design of the top surface makes it possible to place the sensor device underground with just a very small portion of the top exposed at the road surface level to sense the wheel load. Figure 8 shows the photograph of the laboratory fabricated device for the experimental testing.
Figure 8.
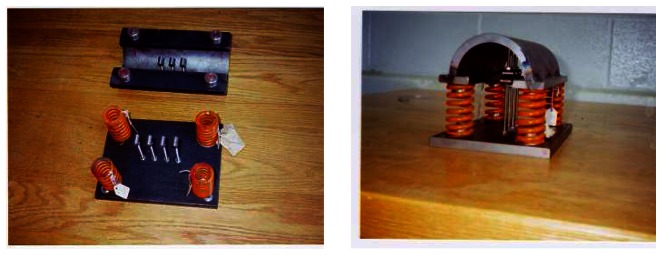
Photographs of fiber bending/load transmitting device.
5. Laboratory Testing Sensor System, Results, and Analysis
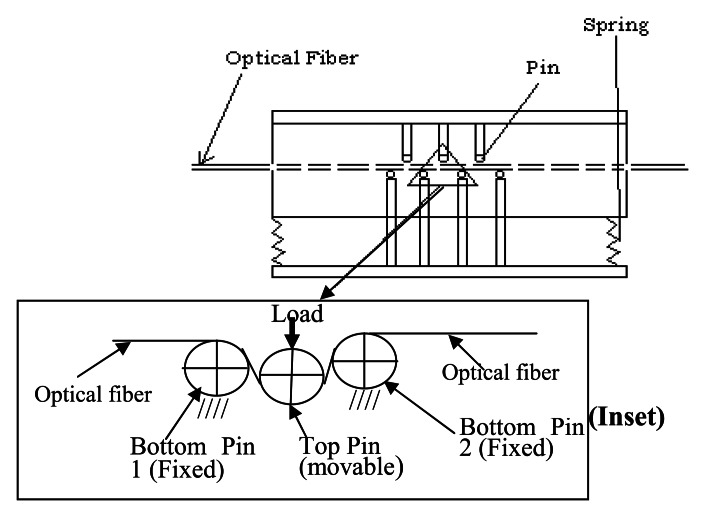
The sensor system (fiber with the load transmitting/fiber bending device) was tested in the laboratory under both the SATEC Universal loading machine and a vehicle wheel to evaluate its performance. The length of the 140 μ diameter fiber used in these testing was approximately 36.90 m (121 ft). The load by the SATEC machine or the car wheel was applied at a distance of approximately 24.38 m (80 ft) from the output end of the fiber. Results are presented herein with the test done using the load transmitting device having 3-pin configuration (one pin on the top and two at the bottom, see Figure 9 inset for schematic).
Figure 9.
Fiber bending by three pins.
5.1. Tests under SATEC Loading Machine
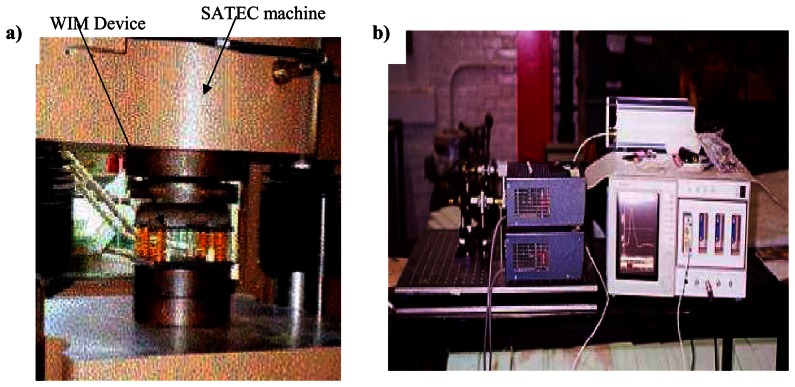
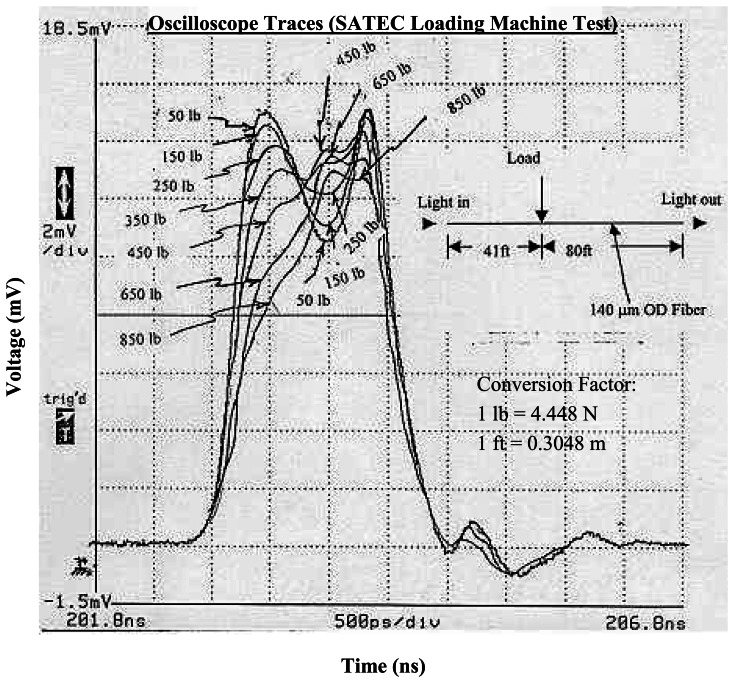
The load transmitting/ fiber bending device with 3-pin configuration was placed in a SATEC universal loading machine (Figure 10) with the special fiber placed horizontally in between the top and bottom layers of the pins. The load was applied to the device in the downward direction in an increment of 0.445 kN (100 lbs) starting from 0.222 kN (50 lbs) to a maximum of 3.781 kN (850 lbs), and then reduced to zero (loading and unloading). The vertical displacements of the device or the fiber and the output light intensity from the oscilloscope traces (Figure 11) corresponding to each load increment were recorded. Table 1 shows these values recorded in the loading phase of the experiment.
Figure 10.
Prototype load transfer device testing (a) using SATEC machine, (b) optical instruments including oscilloscope with light pulse trace.
Figure 11.
Oscilloscope traces of output light signals when the fiber is bent with the 3-pin load transfer device under SATEC loading machine (Unit conversion factor: 1 lb = 4.448 N; 1 ft = 0.3048 m)
Table 1.
Output light intensity change from the bending of fiber by Three-Pin device under SATEC loading machine
| Load | Vertical Displacement (mm) | Inner Core Output Peak Intensity, Vo (mV) | Vo/Vref* (%) | |
|---|---|---|---|---|
| (lb) | (N) | |||
| 0 | 0 | 0 | 15.5 | 100 |
| 50 | 222.4 | 1.532 | 15.5 | 100 |
| 150 | 667.2 | 3.652 | 15.1 | 97.42 |
| 250 | 1112.0 | 4.623 | 14.3 | 92.26 |
| 350 | 1556.8 | 5.760 | 13.1 | 84.52 |
| 450 | 2001.6 | 6.761 | 11.9 | 76.77 |
| 550 | 2446.4 | 7.764 | 10.7 | 69.03 |
| 650 | 2891.2 | 8.780 | 10 | 64.52 |
| 750 | 3336.0 | 9.805 | 9.3 | 60.00 |
| 850 | 3780.8 | 10.802 | 8.9 | 57.42 |
Vref = Light output (V0) intensity when there is no load
The vertical displacements recorded ranges from approximately zero value when there was no load applied to 3.656 m (0.144 in) for 0.667 kN (150 lbs) load to approximately 10.808 mm (0.426 in) for the maximum of 3.781 kN (850 lbs) load.
The oscilloscope traces of the light pulses coming out of the output end of the fiber showed two peaks when there was no load applied (see Figure 11, curve indicated by 50 lb). The left peak was the light output from the inner core. The right peak could be caused by the light entering the outer core at the input end and coming out at the output end (see end of this subsection for more elaboration on this). When the fiber was bent by the pins in the device under the applied load, the middle peak resulting from light being leaked out of the inner core to the outer core at the loading point (or bend location) was observed. The results presented in Figure 11 and Table 1 show the left peak intensity decreases as the loading increases. This is expected since larger load creates larger deflection, giving rise to longer bent length of the fiber, which, in turn, causes more light loss from the inner core. The middle peak intensity shows an increase up to a loading of 450 lbs and decreases on additional loading. This decrease could be caused by light escaping from the outer core due to excessive bending under larger applied loading. The same reason could also be the reason for the decrease in the intensity of the right most light peak.
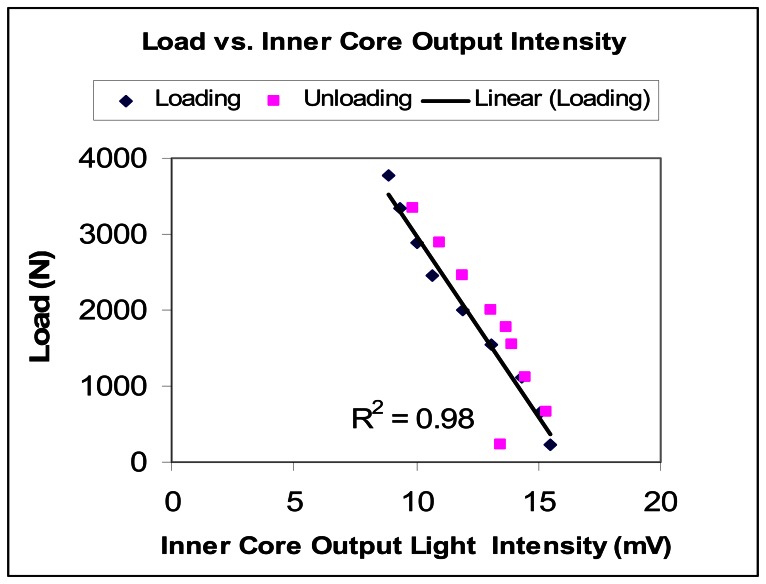
In order to create a reliable WIM system, a strong relationship between the output signal and the applied load must exist. From the observation mentioned in the preceding paragraph, the more reliable pulse to track is the inner core light output pulse intensity as it decrease continuously as the load is increased (or bending is increased). The variation of the inner core light output (left peak) intensities with the applied load has been shown in Figure 12 for both loading and unloading cases. It can be seen that there is a slight difference in the data point values between the loading and unloading cases. Since the tests were done at the same environmental condition (room condition) and during a relatively short period of time (a couple of hours), this difference in measured values from the loading and unloading experiments can be attributed to the preliminary nature of the mechanical device and connection between the mechanical components, rather than the optical fiber. As can be seen from Figure 12, the linear relationship of the inner core light output (left peak) intensity to the applied load (amount of bending of the fiber) is quite strong, with the value of the coefficient determination for the regression, R2, for the linear curve fit being 0.98. Thus, the results seem to indicate that inner core light output reading is suited to adopt for the determination/detection of applied load magnitude.
Figure 12.
Load vs inner core output light pulse intensity.
From the oscilloscope traces in Figure 11, it can be seen that the spatial resolution is good. The load in the laboratory experiment was applied at a distance of approximately 24.38 m (80 ft) from the output end. For this distance, the left and middle peaks were seen to be 500 picoseconds apart. Therefore, for vehicles separated from each other by one lane width of 3.66 m (12 ft), the peaks will be separated by about 75 picoseconds. This should to distinguish between vehicles wheel loads traveling in different lanes.
Considering the calibration value for (Δn31)eff equal to approximately 0.00675 as obtained from the fiber bending experiment described in Subsection 3.3 and with the value of speed of light (c) equal to 3 × 10⁸ m/s, for the time delay (Δt) value equal to approximately 500 × 10-12 s from the SATEC machine loading tests (Figure 11), the distance (z) of the applied force (or the location of the fiber bend) from the light output end of the fiber can be determined from Equation (1) to be approximately 22.22 m, which matches reasonably well with the actual distance of approximately 24.38 m used in the experiment. One cause for this slight difference between the actual and sensor measured/computed values of the location of the applied load/force could be attributed to the preliminary nature of the prototype fiber bending device.
The time interval (Δt) between the left peak and right most peak in Figure 11 is about 800 ps. Following the calculation as described above, this corresponds to a distance of approximately 35.5 m, which matches well with the total length of 36.90 m considered in the experiment. Therefore, this result supports that the extra peak (right peak) that existed from the beginning, when there was no load applied, was as a result of the light entering into the outer core at the input end and coming out of the fiber at the other end (output end.) If needed, one should be able to eliminate this extra outer core light output peak by having the light enter only inner core at the input end.
5.2. Car Wheel Load Tests
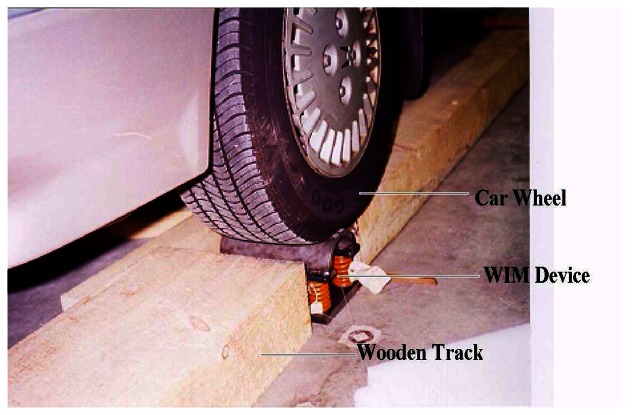
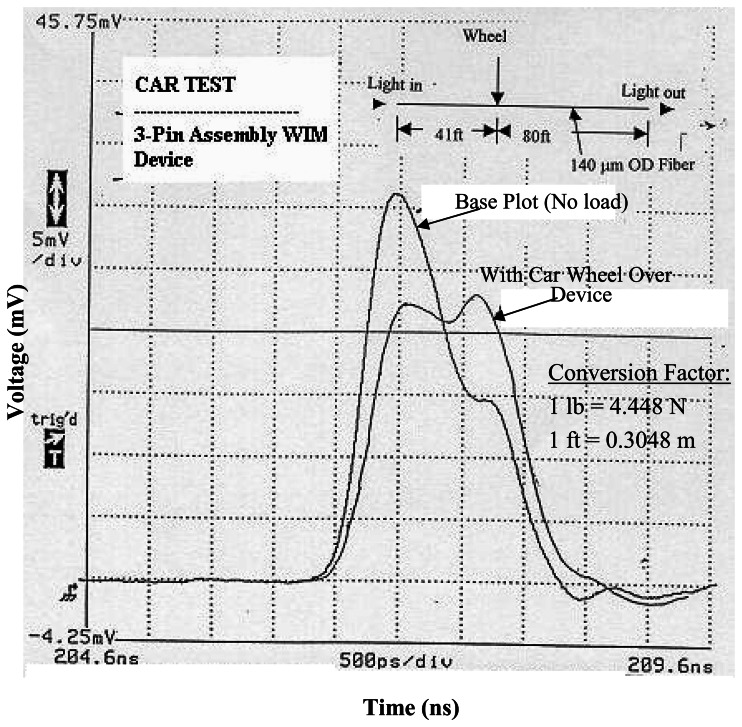
Two parallel wooden tracks at vehicle width apart, were built. The device was placed in the mid-length of one track (Figure 13). A car was driven over the device at crawling speed. The oscilloscope traces before and after the car wheel loading are shown in Figure 14. Before the vehicle wheel loading, there was one output light pulse, which was also the input light pulse traveling through the inner core. It could be observed that the left peak decreased and the right peak appeared, as a result of the wheel loading. The right peak is the fraction of the light being leaked out of the inner core to the outer core at the loading point (bending location). The decrease in the intensity of the left peak, thus, gives a measure of the wheel load magnitude.
Figure 13.
Testing of fiber sensor under car wheel load.
Figure 14.
Oscilloscope traces of output light signals when the fiber is bent with 3-pin load transfer device under car wheel loading (Unit conversion factor: 1 lb = 4.448 N; 1 ft = 0.3048 m).
Furthermore, from the oscilloscope traces (Figure 14), it can also be seen that the spatial resolution between the two peaks was good. The time delay between the two peaks gives the measure of the distance of the applied load from the output end of the fiber and thus pin-points the location of the applied wheel load. In the present case, the time difference between the two peaks was about 550 picoseconds for the load applied at a point approximately 24.38 m (80 ft) from the output end of the fiber. Using the value for the effective difference of the refractive indices (Δn31)eff equal to 0.00675 (Section 3.3) and the value of speed of light (c) equal to 3 × 10⁸ m/s in Equation (1), the time delay (Δt) value equal to approximately 550 × 10-12 s (Figure 14) gives the distance (z) of the applied wheel load (or the location of the fiber bend) from the light output end of the fiber to be 24.44 m, which matches very well with the actual distance of 24.38 m used in the experiment.
6. Conclusions
An optical fiber that has a special cross section structure consisting of two concentric light guiding regions of different refractive profile separated by cladding region was characterized and tested in laboratory in order to determine its potential application in measuring simultaneously the magnitude and location of wheel loads of moving highway vehicles. A prototype load transmitting/fiber bending device was designed and fabricated. With this device the fiber was tested under loading machine and on a passenger vehicle wheel load in the laboratory.
The loading machine test results on the load transmitting device along with the special fiber showed good relationship between the magnitude of the applied load and the changes in the output optical signal. In addition to the magnitude, the results showed that the location of the applied load could be determined to a fair degree of accuracy. Furthermore, the changes in the optical signal during testing with the car were quite similar to that obtained for the load machine. Thus, the laboratory test results from this study found to be encouraging for potential use of the special FTDM dual core optical fiber along with a suitable load transmitting mechanism in the Weigh-In-Motion (WIM) and other force/displacement measurement and detection applications.
Acknowledgments
The study was in part supported by the National Academy of Sciences, Washington D.C. under the National Cooperative Highway Research Program (NCHRP)-Innovations Deserving Exploratory Analysis (IDEA) Type 1 (Concept Feasibility) investigation (NCHRP Project - 42). The views expressed in this paper are those of the authors. The findings, conclusions or recommendations either inferred or specifically expressed herein do not necessarily indicate acceptance by the Academy or by the Federal Highway Administration. The support from MetriLight, Inc. MA (CEO: Marcos Kleinerman) providing the patented experimental optical fiber and valuable comments and information on the fiber during the study is gratefully acknowledged.
References
- 1.Norman O., Hopkins R. Highway Research Board, Bull.-50. Washington D.C.; 1952. Weighing Vehicles in Motion. [Google Scholar]
- 2.Lee C.E. Standards for Highway Weigh-In-Motion (WIM) Systems. ASTM Standardization News. 1991 Feb.:32–37. [Google Scholar]
- 3.Wyman J.H. An Evaluation of Currently Available WIM Systems. Proc. 3rd. National Conf. on Weigh-In-Motion; March 1989; pp. 6–176. [Google Scholar]
- 4.Cottrell B., Jr. Final Report. FHWA Report FHWA/VA-92-RB, VTRC 92-RB. Nat. Tech. Info. Service; Springfield VA: 1992. Evaluation of Weigh-In-Motion Systems; p. 100. [Google Scholar]
- 5.Papagiannakis A.T., Phang W.A., Woodrooffe J.H.F., Bergan A.T., Haas R.C.G. Transp. Res. Record 1215. TRB; Washington D.C.; 1988. Accuracy of Weigh-in-Motion Scales and Piezoelectric Cables; pp. 189–196. [Google Scholar]
- 6.Glover M., Newton W. RR 307. Transport and Road Research Lab; Crawthorne, England: 1991. Evaluation of a Multi-Sensor Weigh-In-Motion System. [Google Scholar]
- 7.Heywood R.J., O'Conner C. A Bridge Design and Evaluation Method Derived From Weigh-In-Motion Data. Can. J. of Civil Eng. 1992;19:423–431. [Google Scholar]
- 8.Hajek J.J., Billing J., Hoang P., Ugge A.J. Use of Weigh-In-Motion Scale Data for Safety-Related Traffic Analysis. TRR 1467, Traffic and Roadway Accident Analysis and Traffic Records Research. 1994:38–43. [Google Scholar]
- 9.Taylor B., Klashinsky R. Traffic Technology International. UK & International Press; Surrey, England: 1995. New Application for Weigh-In-Motion Technology; pp. 220–225. [Google Scholar]
- 10.Tardy A., Jurczyszyn M., Caussignac J.-M., Morel G., Briant G. High Sensitivity Transducer for Fibre-Optic Pressure Sensing Applied to Dynamic Mechanical Testing and Vehicle Detection on Roads. In: Arditty H.J., Dakin J.P., Kersten R.T., editors. Optical Fiber Sensors, Springer Proc. in Physics. Vol. 44. Springer-Verlag; Berlin: 1989. pp. 215–221. [Google Scholar]
- 11.Safaai-Jazi A., Ardekani S.A., Mehdikhani M. SHRP-IDEA/UFR-90-002,SHRP-89-ID03. Strategic Highway Research Program, NRC; TRB; Washington D.C.: 1990. A Low-Cost Fiber Optic Weigh-In-Motion Sensor; p. 62. [Google Scholar]
- 12.Stevens A., Spindlow J.R., Jones G.R. IEE Conf. Publication 320. IEE; Michael Foraday House: England: 1990. Fiber-Optic Axle Sensors for Vehicle Data Collection; pp. 148–152. [Google Scholar]
- 13.Muhs J.D., Jordan J.K., Scudiere M.B., Tobin K.W., Jr. Fiber Optic and Laser Sensors IX – 1584. SPIE; 1991. Results of a Portable Fiber-Optic Weigh-In-Motion System; pp. 374–386. [Google Scholar]
- 14.Tobins K.W., Jr., Muhs J.D. Specialty Fiber Optic Systems for Mobile Platforms – 1589. SPIE; 1991. Algorithm for a Novel fiber-optic weigh-in-motion sensor system; pp. 102–109. [Google Scholar]
- 15.Boby J., Teral S., Caussignac J.M., Siffert M. Weighing of Vehicles in Motion Using Fiber Optic Sensors. Electrical Communication 1stQuarter. 1994:74–77. [Google Scholar]
- 16.Udd E. Fiber optic sensor overview. In: Udd E., editor. Fiber Optic Smart Structures. Wiley; New York, NY: 1995. pp. 155–171. [Google Scholar]
- 17.Teral S. R., Larcher S. J., Caussignac J.M., Barbachi M. Fiber Optic Weigh-In-Motion Sensor: Correlation between Modeling and Practical Characterization. SPIE Smart Sensing, Processing and Instrumentation -271. 1996:417–426. [Google Scholar]
- 18.Malla R.B., Frantz G., Allyn M., Canistraro H. Braided intensity-based fiber sensor for civil infrastructure monitoring. SPIE Proc.-2682. 1996 Jan;:287–297. [Google Scholar]
- 19.Udd E., Kunzler M., Laylor M., Schulz W., Kreger S., Corones J., McMahon R. Fiber Grating Systems for Traffic Monitoring. SPIE-4696. 2002:238–243. [Google Scholar]
- 20.Casas J.R., Cruz P.J.S. Fiber Optic Sensors for Bridge Monitoring. J. Bridge Eng. 2003;8:362–273. [Google Scholar]
- 21.Cosentino P.J., von Eckroth W., Grossman B.G. Analysis of Fiber Optic Traffic Sensors in Flexible Pavements. J. Transp. Eng. 2003;129:549–557. [Google Scholar]
- 22.Li H.-N., Li D.-S., Song G. Recent applications of fiber optic sensors to health monitoring in civil engineering. Eng. Struc. 2004;26:1647–1657. [Google Scholar]
- 23.Yuan S., Ansari F., Liu X., Zhao Y. Optic fiber-based dynamic pressure sensor for WIM system. Sens. Actuat. A. 2005;120:53–58. [Google Scholar]
- 24.Moyo P., Brownjohn J.M.W., Suresh R., Tjin S.C. Development of fiber bragg grating sensors for monitoring civil infrastructure. Eng. Strutc. 2005;27:1828–1834. [Google Scholar]
- 25.Kleinerman M., Kelleher P.W. Distributed and Multiplexing Fiber Optic Sensors 1586. SPIE; 1991. A Distributed Force-Sensing Optical Fiber Using Forward Time Division Multiplexing; pp. 67–77. [Google Scholar]
- 26.Malla R.B., Garrick N., Sen A., Dua P. Fiber Optic Sensors for Construction Materials and Bridges. Technomic Publishing Co.; Lancaster, PA: May, 1998. A Dual Core Forward Time Division Multiplexing Optical Fiber for Weigh in Motion System; pp. 251–262. [Google Scholar]
- 27.Sen A. M.S. Thesis. Department of Civil and Environmental Engineering, University of Connecticut; Storrs, CT: Aug, 1999. Weigh-in-Motion Using a Special Forward Time Division Multiplexing Fiber Optic. (Major Advisor: R. Malla) [Google Scholar]
- 28.Malla R.B., Sen A., Garrick N. Proc. the 3rd Civil Engineering Conference in Asian Regions. The Asian Civil Engineering Coordinating Council; Seoul, Korea: Aug, 2004. A Special Dual Core Optical Fiber Sensor For Detecting Highway Vehicle Wheel Loads; pp. 359–363. [Google Scholar]


