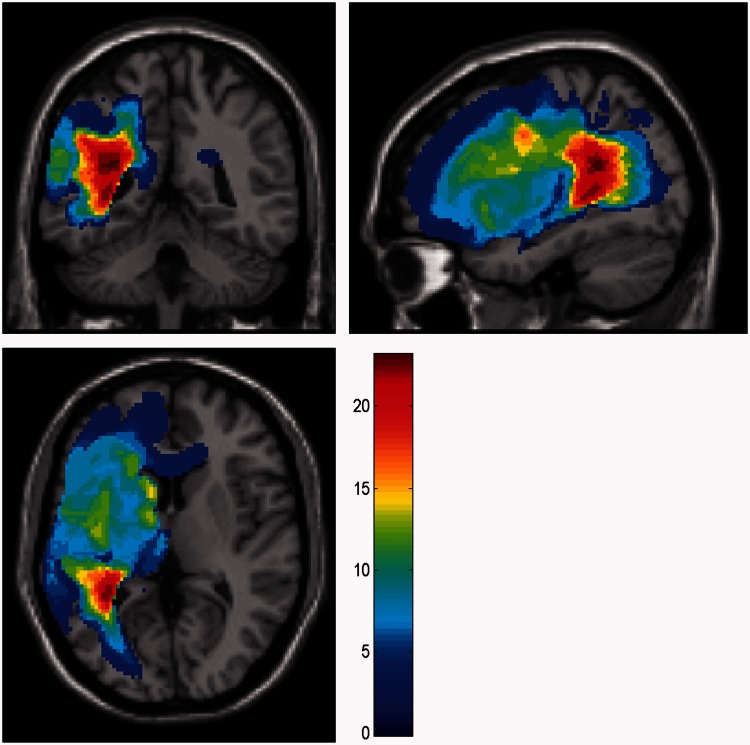
Figure 1.
Lesion overlap map for all aphasic stroke patients. Lesion overlap map for the stroke patients is presented in three different planes at the MNI coordinate (−32.5, −43.6, 6.4). Hotter voxels represent areas of common damage in a majority of patients while lighter voxels represent areas of minimal overlap in lesioned area across all the patients according to the colour scheme on the right.

