Abstract
Recognition of nucleic acids is important for our understanding of nucleic acid structure as well as for our understanding of nucleic acid-protein interactions. In addition to the direct readout mechanisms of nucleic acids such as H-bonding, shape recognition of nucleic acids is being increasingly recognized to play an equally important role in DNA recognition. Competition Dialysis, UV, Flourescent Intercalator displacement (FID), Computational Docking, and calorimetry studies were conducted to study the interaction of neomycin with a variety of nucleic acid conformations (shapes). At pH 5.5, these results suggest: (1) Neomycin binds three RNA structures (16S A site rRNA, poly(rA)•poly(rA), and poly(rA)•poly(rU)) with high affinities, Ka~107M−1. (2) The binding of neomycin to A-form GC-rich oligomer d(A2G15C15T2)2 has comparable affinity to RNA structures. (3) The binding of neomycin to DNA•RNA hybrids shows a three-fold variance attributable to their structural differences (poly(dA) •poly(rU), Ka=9.4×10⁶M−1 and poly(rA)•poly(dT), Ka=3.1×10⁶M−1). (4) The interaction of neomycin with DNA triplex poly(dA)•2poly(dT) yields a binding affinity of Ka=2.4×10⁵M−1. (5) Poly(dA-dT)2 showed the lowest association constant for all nucleic acids studied (Ka=<105). (6) Neomycin binds to G-quadruplexes with Ka~104-105M−1. (7) Computational studies show that the decrease in major groove width in the B to A transition correlates with increasing neomycin affinity. Neomycin’s affinity for various nucleic acid structures can be ranked as follows, RNAs and GC-rich d(A2G15C15T2)2 structures > poly(dA)•poly(rU) > poly(rA)•poly(dT) > T•A-T triplex , G-quadruplexes, B-form AT-rich or GC-rich DNA sequences. The results illustrate the first example of a small molecule based ‘shape readout’ of different nucleic acid conformations.
Aminoglycoside antibiotics are well-known chemotherapeutic agents that have been in clinical use for over six decades (1). Their activity against mycobacterium tuberculosis and other microorganisms has established them as life-saving drugs and aided significantly towards near eradication of tuberculosis. Aminoglycosides are known to bind to 16S rRNA subunit of the bacterial ribosome at the A-site and cause erroneous translation leading to disruption of protein synthesis in bacteria. The recent advancements in structural elucidations of aminoglycoside-RNA interactions (2-4) have greatly assisted in the understanding of their recognition and have revealed that bulged RNA sites serve as the most preferred binding sites for aminoglycosides. Thermodynamics of aminosugar binding to RNA and DNA sites have been investigated in the past decade (5-7). Combined with the knowledge obtained from structural studies, ligand-nucleic acid thermodynamics is important for a deeper understanding of small molecule binding, which can be further used for development of more efficient nucleic acid binding ligands.
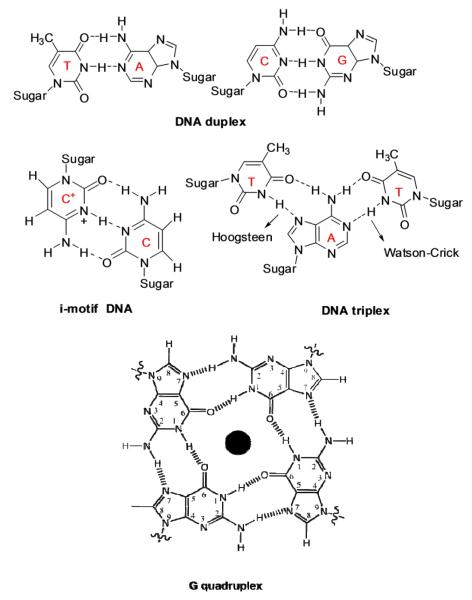
Aminoglycoside-nucleic acid recognition studies have primarily centered on binding to ribosomal targets due to the ribosome being their site of antibiotic action (8). There are other nucleic acid structural forms such as triplex, quadruplex, and hybrid structures (Figure 1) that play significant biological roles in a number of cellular processes and have been shown to bind aminoglycosides (9, 10). The binding of small molecules to nucleic acids and subsequent inhibition of their biological functions is a widely acceptable strategy for development of novel therapeutics. For example, targeting DNA duplex can inhibit DNA replication and transcription (11, 12). Binding of aminoglycosides to DNA targets has been reported recently (13). Targeting triplexes have been the focus of antigene strategy for gene regulation (14-16) while ligand interaction with the quadruplex can be utilized to inhibit the function of telomerase and disfavor the interactions of telomere end binding proteins (16-19). On the other hand, targeting DNA•RNA hybrids such as Okazaki fragments, which are transiently formed during the DNA replication, may also be useful to inhibit transcription (20). The studies in our laboratory have shown that binding of aminoglycosides leads to remarkable thermal stabilization of both DNA and RNA triple helices (21) and can induce hybrid triple helix formation (22). Other examples of DNA•RNA hybrids have been observed in the reverse transcription processes such as telomere elongation by telomerase. In addition to duplex and higher order nucleic acid structures, single stranded polynucleotide chains have also been known to modulate key cellular processes. A well-known example is poly A tail which is involved in RNA translation where it helps to cap the m-RNA and assists its translation. Thus, targeting nucleic acids by a small molecule can lead to varied therapeutic results. The reports mentioned above were the first examples of higher order DNA/RNA recognition by aminoglycosides and were later exploited to develop high affinity (23) and structure-selective nucleic acid binders (5). Among all the aminoglycosides, neomycin (Figure 2a) has been reported as the highest affinity ligand in studies conducted on triplexes, hybrids (10) and quadruplex nucleic acid structures (24).
Figure 1.
Representative hydrogen bonding patterns formed between DNA duplex, triplex, and G-quadruplex studied.
Figure 2.

Chemical structure of (a) neomycin (b) fluorescein-neomycin conjugate.
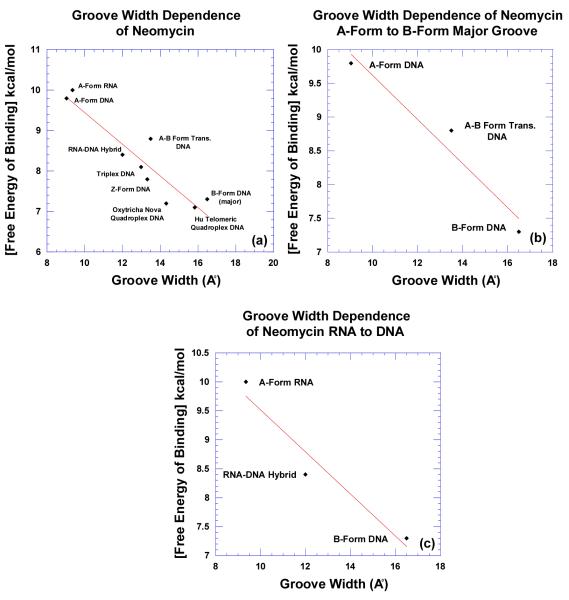
Studies have shown that aminosugars bind to the major groove of nucleic acids, for example, the Watson-Hoogsteen groove of the T-A•T triplex (25), or the major groove of poly(rI)•poly(rC) duplex (26). We have reported that aminoglycosides preferentially bind to nucleic acid structures that adopt A-like conformations (27). However, with the developments in synthetic conjugates (28), aminoglycoside conjugates can be developed to bind B-form DNA structures (5, 29). Neomycin-neomycin conjugates have been shown to bind B-DNA in the major groove with high affinities (Ka = 108 × M−1) (5). Similarly, by attaching aminosugars to other shape selective ligands such as methidium carboxylic acid, sub-nanomolar binding to hybrid nucleic acids has been obtained (30). The modification of aminoglycosides can be extended (31, 32) with the conjugation of shape and sequence ligands such as intercalators and minor groove binders to achieve specificity and selectivity for targeted nucleic acids (33, 34). These nucleic acid structures all bind to aminosugars, yet do so with varying affinities. Additionally, all the aforementioned nucleic acid structures present a wide variation of shapes with varying major and minor groove widths. In this report, we explore the correlations between nucleic acid shape, as determined by major groove widths, and their affinities to an aminosugar (neomycin). In particular, the interaction of neomycin with different nucleic acid structures ranging from B-form to A-form, that include single, double, triple, and quadruple strands is reported.
Materials and Methods
Nucleic Acids and Aminoglycosides
All aminoglycosides were purchased from ICN Biomedicals Inc. (Solon, OH) and used without further purification. All the polynucleotides were purchased from GE Healthcare Amersham Biosciences (Piscataway, NJ). The concentrations of all the polymer solutions were determined spectrophotometrically using the following extinction coefficients (in units of mol /nucleotide or bp/L−1cm−1): ε264= 8520 for poly(dT), ε260 = 6000 for poly(dA)•poly(dT), ε262 = 6600 for poly(dA-dT)•poly(dA-dT), ε254 = 8400 for poly(dG-dC)•poly(dG-dC), ε258 = 9800 for poly(A),ε260 = 9350 for poly(U), ε274 = 7400 for poly(dC). d(A2G15T15T2) was purchased from Integrated DNA technologies (ε260 = 301,200 /strand). 16S A-site rRNA was purchased from Dharmacon Inc. (Chicago, IL) and deprotected before use (ε260 = 253,300/strand). Calf thymus DNA was purchased from Sigma (ε260 = 12,824/ bp). All other oligomers used were purchased from Eurofin MWG Operon (Huntsville, AL) and used without further purification.
Ultra Violet (UV) Spectroscopy
All UV experiments were conducted on a Cary 1E UV-Vis spectrophotometer equipped with temperature controller. Quartz cells with a 1 cm path length were used for all the experiments. All samples were heated at 95 °C for 5 min, then cooled slowly to room temperature and allowed to incubate for at least 16 hours at 4 °C prior to use. Absorbance versus temperature profiles were recorded at 260/280/295 nm. For thermal denaturation experiments, the samples were heated from 5 °C to 95 °C at a rate of 0.2 °C/min followed by cooling to 10 °C at a rate of 5.0 °C/min. Data was recorded at 1 degree increments. For melting temperature (Tm) determination, first derivative was used. For all the thermal denaturation experiments, DNA concentrations were 15~30 μM in base pair/base triplet.
Isothermal Titration Calorimetry (ITC)
All isothermal calorimetric measurements were performed on a MicroCal VP-ITC (MicroCal, Inc., Northampton, MA) at 10 °C, except for temperature dependence experiments. In ITC studies, DNA concentrations were varied to obtain reliable signal. In every titration, 5 or 10 μL aliquots of aminoglycoside solution were injected into a sample cell containing 1.42 mL of nucleic acid solution. The injection spacing was either 240s or 300s, syringe rotation rate was 260 rmp, and duration of each injection was 20s. For each titration, a control experiment was performed by titrating the ligand into buffer. The resulting data was processed using Origin 5.0. Each heat burst curve corresponds to a signal drug injection. Integrating the area under each heat curve yielded the heat released upon ligand injection. The corresponding heat of dilution was subtracted to obtain the actual heat changes associated with the ligand-nucleic acid binding.
Differential Scanning Calorimetry (DSC)
The nucleic acid melting temperature and enthalpy changes in the absence of drug were obtained using a MicroCal VP-DSC (MicroCal, Inc., Northampton, MA). The scan rate was 1 °C/min, and the operating temperature range was 5 °C - 110 °C. After each DSC experiment, a corresponding control experiment was conducted with only buffer in the sample cell. The corrected DSC profile was obtained by subtracting the control data from the sample data. The enthalpy changes for the melting of nucleic acids structures in the absence of ligand (ΔHHS) were calculated by integrating the area under the heat capacity curves using Origin version 5.0.
Circular Dichroism (CD) Spectroscopy
All CD experiments were conducted at 20 °C on a JASCO J-810 spectrophotometer equipped with a thermoelectrically controlled cell holder. A quartz cell with a 1 cm path length was used in all CD studies. CD spectra were recorded as an average of three scans from 300 nm to 200 nm. In isothermal CD titration experiments, small aliquots of concentrated ligand solutions were added to nucleic acid solutions and allowed to equilibrate for at least 20 minutes prior to scanning.
Competition Dialysis
For each competition dialysis assay, 200 μl of different nucleic acids were placed in a MINI dialysis flotation device (Pierce Chemical Company; www.piercenet.com) and then dialyzed with 400 mL of 0.1 μM ligand in BPES buffer solution for 72 h at ambient temperature (20–22 °C). At the end of the experiment, 180 μl nucleic acids samples were carefully transferred to microfuge tubes, and were taken to a final concentration of 1% (w/v) sodium dodecylsulfate (SDS). Each mixture was allowed to equilibrate for 2 hours. The concentration of ligand after dialysis was determined by fluorescence (Fluoromax-3, Jobin Yvon, Inc.). Appropriate corrections were made due to volume changes. The amount of bound drug was determined by the relationship Cb = Ct-Cf, where Cf is the concentration of the free ligand solution, Ct is total ligand concentration and Cb is the concentration of the bound ligand. Data was plotted as a bar graph using Kaleidagraph Software (Version 3.5, Synergy Software). A calibration curve was made to determine Ct and Cf.
Fluorescence Intercalator Displacement (FID) Assays
FID experiments were conducted on either a Photon Technology International (Lawrenceville, NJ) or TECAN-Genois 96 well plate reader. The FID experiments were performed at 20-22 °C with the polynucleotides and 10 °C with the oligonucleotides. In the 96 well plate experiments, a total volume of 200 μL was used. The total volume used in the fluorimeter experiments was 1.8 mL. For polynucleotides, the nucleic acid concentration used was 0.88 μM /base pair or triplet with a 1.24 μM thiazole orange (TO) concentration. For 30-mer oligonucleotides, the nucleic acid concentration was 1 μM/duplex or triplex with a 15 μM TO concentration. All experiments were performed in a buffer containing 10 mM sodium cacodylate, 100 mM NaCl, and 0.5 mM EDTA, pH 5.5 or 6.8. TO was excited at 504 nm and the emission was recored from 515-600 nm. The ligand concentration required to displace 50% of the bound fluorescent probe was determined from a dose response curve and is expressed as AC50.
ΔTm Method
The following equation was used to calculate association constants at the corresponding melting temperatures where the nucleic acid was complexed with the ligand (35).
| (1) |
Tmo is the melting temperature of ligand free nucleic acid, Tm is the melting temperature of ligand bound nucleic acid, ΔHHS is enthalpy change corresponding to nucleic acid base pair melting in the absence of ligand (determined from a DSC measurement), L is free ligand concentration at Tm (estimated by one-half the total ligand concentration), and n is the binding site-size determined by CD and flurorescence experiments. After obtaining the association constants at Tm, the integrated Van’t Hoff equation (2) was used to calculate the association constants at 10 °C (36).
| (2) |
Where ΔHobs is the observed binding enthalpy of ligand to nucleic acid as derived from ITC excess site binding experiments at 10 °C, R is the gas constant, and ΔCp is the heat capacity chang determind from equation (3) by using binding enthalpies at various temperatures.
| (3) |
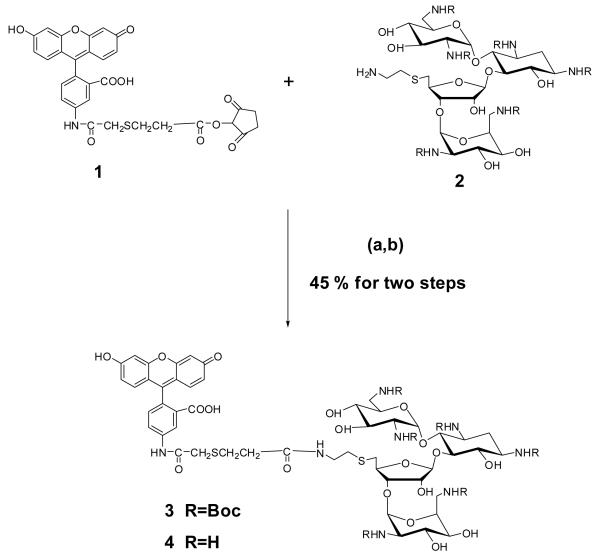
Synthesis of Fluorescein-neomycin conjugate (F-neo) (4)
Fluorescein-neomycin conjugate (4) was prepared by coupling an activated fluorescein ester (1) with neomycin amine (2) followed by deprotection of Boc groups using trifluoroacetic acid (TFA) (Scheme 1, Supporting Information Figures S43,S44).
Scheme 1.
Synthesis of F-neo conjugate 4. (a) Dimethylformamide (DMF), 4-dimethyl amino pyridine (DMAP), rt (b) TFA, dichloromethane (DCM), rt.
Synthesis of (4)
To a DMF solution (1 mL) of 1 (5 mg, 0.0086 mmol) and 4-dimethyl-aminopyridine (catalytic amount) was added 2 (10 mg, 0.0078 mmol) and stirred overnight at room temperature. The reaction mixture was concentrated under vacuum. Flash chromatography of the residue (8% (v/v) CH3OH in CH2Cl2) yielded the Boc protected F-neo conjugate as a yellow solid (10 mg): Rf 0.21 (10% (v/v) CH3OH in CH2Cl2). The product was then dissolved in CH2Cl2 (3 mL) and trifluoroacetic acid (0.5 mL) was added to it. The mixture was stirred at room temperature for 3 h. After removing the solvents under vacuum, the residue was dissolved in H2O (2 mL) and extracted with dichloromethane (3 × 2 mL). The aqueous layer was concentrated under vacuum to yield the desired product (7 mg, 45 % for two steps): UV-Vis (H2O); λ = 232, 455, 478 nm; ε (478 nm) = 13,260 M−1cm−1; 1H NMR (500 MHz, D2O) δ 8.34 (s, br, 1H), 7.86 (m, 2H), 7.47-7.45 (d, J = 9.3 Hz, 2H), 7.33- 7.32 (d, J = 8.20 Hz, 1H), 7.23 (s, br, 1H), 7.07-7.05 (d, J = 9.36 Hz, 1H), 6.74-6.73 (d, J = 6.73 Hz, 1H), 5.96-5.94 (m, 1H) (ring I-1′), 5.32-5.29 (br, 2H) (contains ring III-1″), 5.19 (s, br, 1H)(ring IV-1″′), 4.33-4.17 (m, 4H)(contains ring III-2″′, ring IV-3″), 4.01-3.97 (t, J = 9.67 Hz , 1H), 3.93-3.89 (t, J = 10.3 Hz, 1H), 3.83-3.78 (m, 2H), 3.71 (s, br, 1H), 3.61-3.57 (t, J = 9.89 Hz, 1H), 3.49-3.11 (m, 16H)(contains ring IV-2″′, ring II 1′, ring II-3′) , 3.07-2.99 (m, 3H), 2.87-2.84 (m, 2H), 2.73-2.61 (m, 2H), 2.55-2.53 (t, J = 6.52 Hz, 2H), 2.39-2.37 (br, 1H)(ring II, 2eq), 1.83-1.76 (m, 1H)(ring II-2ax); MS (MALDI-TOF) calcd m/z for C50H68N8O19S2 1148.40, found 1171.86[M+Na].
Docking Studies
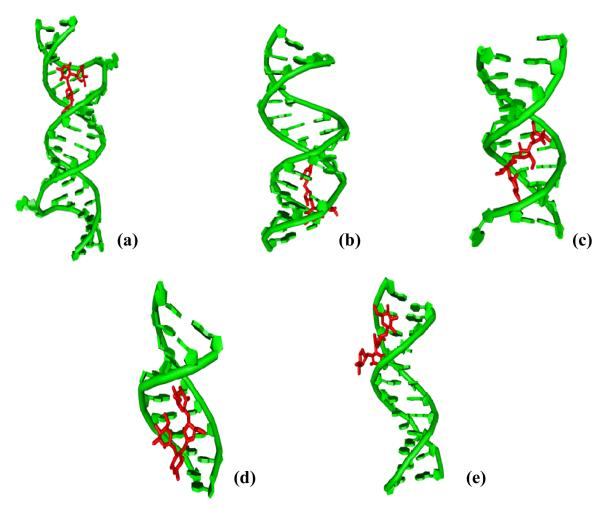
All dockings were performed as blind dockings using Autodock Vina 1.0 (37). Docking was performed using an “exhaustiveness” value of 12. All other parameters were used as default. All rotatable bonds within the ligand were allowed to rotate freely and the receptor was kept rigid. The Protein databank was used to download the nucleic acid receptors (ID codes are listed with sequences in Supporting Information Tables S1-S3). All ligand structures were created using Discovery Studio® Visualizer 2.5 and then brought to their energetically minimized structures by the Vega ZZ program (38) utilizing a conjugate gradient method with an SP4 forcefield. Autodock Tools version 1.5.4 (39) was used to convert the ligand and receptor molecules to the proper file formats for AutoDock Vina docking.
Results
Fluorescence Intercalator Displacement (FID)
FID assays have been shown to offer a means for qualitative comparison of relative binding affinities (40). Two separate but comparable FID methods were employed; fluorescence titrations and 96-well plate reader fluorescence titrations preformed in triplicate. In both methods, thiazole orange (TO) was used as the intercalator which was displaced by the ligand. In addition to neomycin, three other aminoglycosides (paromomycin, ribostamycin, and neamine) were screened to assess the relative binding of these structurally similar ligands. In addition to polynucleotides, 30 mer oligonucleotides were also studied with neomycin. The results are summarized in Tables 1 and 2.
Table 1.
AC50 Values Obtained From the FID Assay of the Polynucleotides. See Materials and Methods for Experimental Conditions.
| Nucleic Acid | AC50 (μM) |
|||
|---|---|---|---|---|
| neomycin | paromomycin | ribostamycin | neamine | |
| poly(rA)•poly(rU) | 0.02 ± 0.01 | 0.13 ± 0.02 | 0.32 ± 0.08 | 1.2 ± 0.2 |
| poly(rA)•2poly(rU) | 0.09 ± 0.01 | 0.45 ± 0.08 | 2.30 ± 0.60 | 7.40 ± 0.30 |
| poly(dA)•poly(rU) | 1.2 ± 0.2 | 1.5 ± 0.4 | 10 ± 3 | 119.00 a |
| poly(rA)•poly(dT) | 1.6 ± 0.2 | 40 a | 60 a | 234 a |
| poly(dA)•2poly(dT) | 2.4 a | 22.4 a | 37.2 a | 355 a |
| poly(dA-dT)2 | 5.1 ± 0.2 | 57 ± 3 | 239 a | 609 ± 17 |
Data obtained from FID titration experiments in a 3.0 mL quartz cell . All other experiments were carried in 96-well plate.
Table 2.
AC50 Values Obtained From the FID Assays of 30 mer Oligonucleotides. See Materials and Methods for Experimental Conditions.
| Nucleic Acid | AC50 neomycin (μM) |
|---|---|
| rA30•rU30 | 0.68 |
| rA30•2rU30 | 2.2 |
| dA30•rU30 | 6.6 |
| rA30•dT30 | 7.9 |
| dA30•dT30 | 8.9 |
| dA30•2dT30 | 53.7 a |
The AC50 value was obtained with an additional 150 mM KCl salt to ensure stable triplex formation.
The AC50 values represent the ligand concentration required to displace 50% of the bound fluorescent probe and are derived from sigmoidal fits for the fluorescence titration curves (Tables 1 and 2, Supporting Information Figures S1-S8). Lower AC50 values generally represent higher affinities as less ligand is required to displace the bound intercalator. 30 mer sequences generally followed the trend established in Table 1 with one exception, dA30•2dT30 triplex, which had an AC50 value substantially higher than the other complexes due to a higher salt concentration needed for formation (also see competition dialysis). Overall, the AC50 values for neomycin interactions with nucleic acids were found in the following order poly(rA)•poly(rU) ~ poly(rA)•2poly(rU) < poly(dA)•poly(rU) < poly(rA)•poly(dT) < poly(dA)•2poly(dT) < poly(dA-dT)2. In terms of individual aminoglycoside interactions with the nucleic acids, neomycin exhibited the lowest AC50 value followed by paromomycin, ribostamycin, and neamine.
Competition Dialysis
We have previously reported that in addition to the 16S A-site rRNA, aminoglycosides bind to nucleic acids that adopt A-form structures (21, 27). To explore aminoglycoside structure-selectivity, competition dialysis was used as a nucleic acid screening technique (41) to illustrate the binding of neomycin to different nucleic acid structures. Previous inquiries reported an acridine chromophore conjugated to neomycin that was used to follow the nucleic acid selectivity in the competition dialysis assay (42). Acridine, however, binds to several nucleic acids and therefore perturbs the selectivity of the free aminoglycoside. We herein report the competition dialysis studies using a fluorescein-neomycin conjugate (F-neo) (Figure 2b). As a control, binding of fluorescein to nucleic acids was investigated in the competition dialysis assay and showed negligible binding.
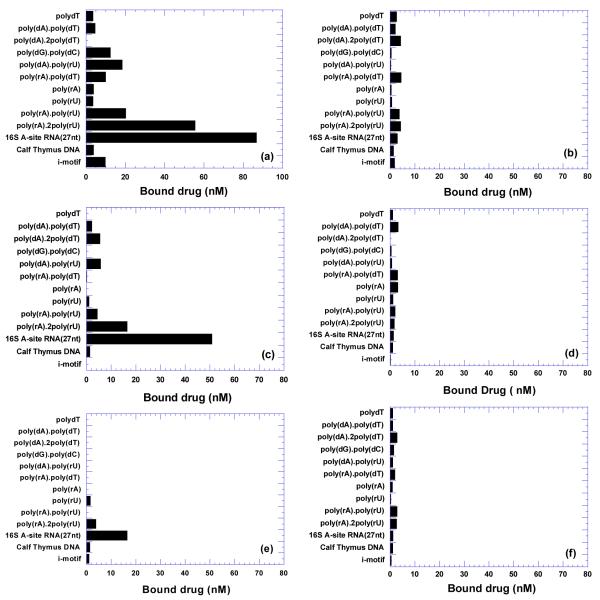
As shown in Figure 3 (a,c,e), comparative binding of F-neo to 14 different nucleic acid structures was examined which included single strand nucleic acids [poly(dT), poly(A), poly(U)], duplexes [poly(dA)•poly(dT), poly(rA)•poly(dT), poly(rA)•poly(rU), poly(dA)•poly(rU), poly(dG)•poly(dC), calf thymus], triplexes [poly(dA)•2poly(dT), poly(rA)•2poly(rU)], i-motif (polydC) and 16S A-site rRNA. The amount of F-neo bound to each nucleic acid is shown as a bar graph. Because all nucleic acids are dialyzed simultaneously in the same ligand solution, the amount of bound F-neo is directly proportional to its affinity for each nucleic acid (41).
Figure 3.
(a,c,e) Competition dialysis results of fluorescein-neomycin with various nucleic acids at (a) 100 mM Na+ (c), 150 mM Na+ (e) 200 mM Na+. (b,d,f) Competition dialysis results of fluorescein with various nucleic acids at (b) 100 mM Na+ (d) 150 mM Na+ (f) 200 mM Na+. 200 μL of different nucleic acids (7.5 μM per monomeric unit of each polymer) was dialyzed for 72 h with 400 mL 100 nM ligand in 6 mM Na2HPO4, 2 mM NaH2PO4, 1 mM Na2EDTA, pH 7.0 and various Na+ concentrations as indicated.
Figure 3 suggests the following conclusions. First, F-neo prefers to bind to 16S A-site rRNA yielding a bound ligand concentration of of 85 nM in 100 mM Na+, 50 nM in 150 mM Na+, and 15 nM in 200 mM Na+. Binding to the RNA triplex poly(rA)•2poly(rU) is comparable to A-site rRNA under low salt conditions, with 60 nM, 20 nM, and 5 nM bound F-neo in 100, 150, and 200 mM Na+ respectively. F-neo also shows significant binding to RNA duplex poly(rA)•poly(rU), DNA triplex poly(dA)•2poly(dT), and hybrid duplex poly(dA)•poly(rU) with approximately 10-20 nM bound drug under these salt conditions. However, F-neo exhibits moderate to very weak binding with the DNA duplex poly(dA)•poly(dT), hybrid duplex poly(rA)•poly(dT), calf thymus DNA, i-motif DNA, and all single-stranded nucleic acids studied here.
Second, the binding of F-neo to nucleic acids is affected by the salt concentration. As Na+ concentration increases from 100 to 200 mM, the amount of bound neomycin decreases approximately 4-5 times for each nucleic acid structure. These results are also consistent with the thermodynamic studies of neomycin-nucleic acids interaction, as discussed later (Table 4).
Table 4.
Thermodynamic Profiles of Neomycin Interaction With a Variety of Nucleic Acids. Buffer 10 mM Sodium Cacodylate, 0.5 mM EDTA, 100 mM NaCl at pH 5.5.
| ΔHwc (kcal/mol) |
Tm0 (°C) |
Tm (°C) |
ΔT (°C) |
n | ΔH(T1) (kcal/mol) |
ΔH(T2) (kcal/mol) |
ΔCp (cal/mol.K) |
KT(20°C) (M−1) |
|
|---|---|---|---|---|---|---|---|---|---|
| poly(dAdT)•poly(dAdT) | 3.90 | 62.4 | 63.2 | 0.8 | 7.3 | −2.1±0.1 (40°C) | −2.3±0.1 (53°C) |
−16±10 | (8.9±0.1)×104 |
| poly(dA)•2poly(dT) | 1.21 | 23.5 | 31.0 | 7.5 | 6.0 | −0.6±0.3 (5°C) | −3.2±0.5 (15°C) |
−264±30 | (2.4±0.1)×105 |
| poly(rA)•poly(dT) | 7.12 | 64.1 | 67.5 | 3.4 | 8.0 | −4.5±0.1 (35°C) | −5.0±0.2 (45°C) |
−50±20 | (3.4±0.4)×106 |
| poly(dA)•poly(rU) | 3.84 | 43.6 | 65.5 | 21.9 | 6.5 | 3.6±0.1 (15°C) | 2.8±0.1 (20°C) |
−160±18 | (9.4±0.1)×106 |
| d(A2G15C15T2)2a | 3.00 | 93.7 | 101.1 | 7.4 | 10.0 | −0.7±0.1 (20°C) | −2.7±0.1 (30°C) |
−173±23 | (1.8±0.6)×107 |
| poly(rA-rA) | 4.05 | 44.0 | 61.5 | 17.5 | 6.5 | −1.8±0.1 (5°C) | −2.1±0.1 (10°C) |
−60±25 | (1.7±0.2)×107 |
| poly(rA)•poly(rU) | 6.34 | 53.4 | 64.7 | 11.3 | 8.0 | 1.7±0.1 (15°C) | −0.7±0.1 (25°C) |
−245±7 | (2.9±0.1)×107 |
| poly(rA)•2poly(rU) | 1.40 | 45.5 | - | - | - | 2.42±0.02(15°C) | 0.02±0.01 (25°C) |
−240±3 | - |
| 16S A-site RNAa | 96.6b | 70.8 | 77.0 | 6.2 | 1.0 | −0.9±0.1 (10°C) | −2.4±0.1 (20°C) |
−151±12 | (8.7±0.9)×107 |
Data obtained from ITC titration experiments.
The melting enthalpy corresponds to the melting of a molecule of the nucleic acid.
Third, fluorescein itself shows little binding affinity to all nucleic acids under all three salt conditions as shown in Figure 3 (b,d,f). The concentration of bound fluorescein is less than 4 nM under all three salt conditions suggesting fluorescein’s contribution in the F-neo conjugate binding is insignificant.
Fourth, the counterintuitive and surprising absence of F-neo binding to poly(dA)•2poly(dT) under 100 mM Na+ can be explained by the non-formation of the DNA triplex under this salt concentration at ambient temperatures (~22 °C). As salt concentration is raised to 150 mM Na+, triplex formation is favored and ligand binding is observed.
Competition dialysis reveals that F-neo binds the natural target 16S A-site rRNA and also shows comparable binding to RNA triplex. Analysis of the nucleic acid structures that are favored by neomycin suggests that they all display features characteristic of A-form conformation. The hybrid duplex, especially poly(dA)•poly(rU), exhibits intermediate conformation between the A and B forms, but more like A-form (43). The low bound drug observed for poly(rA)•poly(dT) can be attributed to the fact that this hybrid can exist in the B-form (43, 44). In addition, GC-rich sequences are well known to adopt A-like conformation in aqueous solution (45). Highly ordered nucleic acids structures such as G-quadruplex and triplex also adopt a conformation exhibiting some A-form features (46) as indicated by a strong band in the vicinity of either 260 nm or 205 nm in their CD spectrum. More importantly, the size of their major grooves lies intermediate between the widths and depths of an A-form major groove, and a B-form major groove.
Thermodynamic study of nucleic acids-neomycin interactions
Polyadenylic acid (poly (rA))
pH 5.5
A poly(rA)•poly(rA) duplex has been shown to form at pH 5.5 (47). CD titrations of the duplex with neomycin at pH 5.5 show large positive bands at 260 nm and small negative bands at 240 nm (47) indicating the presence of poly(rA)•poly(rA) duplex. The rotational symmetry of the A-A base pair causes this duplex to form identical grooves (43). Further, the RNA duplex has been shown to undergo significant stabilization upon binding with neomycin (47) with no overall conformational change and a 6.5 base pair per drug binding site size (approximately one helical turn of eight base pairs bound to each ligand (47). Neomycin binds to this A-form RNA structure with a high binding affinity of Ka= (1.7±0.2)×107 M−1 (Table 4).
pH 6.8
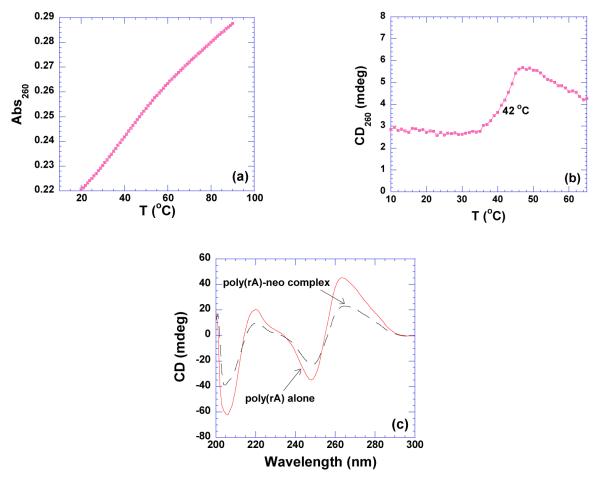
Poly(rA) exists as a single strand at pH 6.8. The single stranded poly(rA) also undergoes a broad denaturation with increasing temperature, indicating a structural transition from a stacked helix to a random coil as shown in Figure 4a. In the presence of neomycin, the thermal denaturation results reveal that the transition becomes sharper, as shown in CD melting profile (Figure 4b). Here, a positive transition for the poly(rA)-neomycin complex associated with an increase in temperature is clearly observed. These observations indicate a conformational change of poly(rA) upon neomycin binding. In order to investigate the neomycin induced poly(rA) conformation, a CD study was conducted. The CD spectrum of poly(rA) in the absence of neomycin at pH 6.8 shows a positive band around 265 and 220 nm and a strong negative band at 250 nm, characteristic of single-stranded poly(rA) (Figure 4c) (48). When neomycin is added to the poly(rA) solution, the intensities of the CD bands decrease, and little red or blue shift is observed (Figure 4c). The neomycin induced CD spectrum at pH 6.8 is clearly different from the one obtained at pH 5.5, indicating significant structural differences.
Figure 4.
(a) UV thermal denaturation profile of poly(rA). (b) CD thermal denaturation profile of poly(rA) (20 uM/strand) in the presence of neomycin at rbd 4. (c) CD scans of poly(rA) (75 uM/strand) in the absence and presence of neomycin. The experiments were conducted in buffer 10 mM sodium cacodylate, 0.5 mM EDTA, 100 mM NaCl at pH 6.8.
Small molecules, such as protoberberine alkaloids berberine, (48) palmatine, (49) coralyne (50) have been shown to bind strongly to single stranded poly(rA). The binding mode for these ligands is hypothesized to be a partial intercalation in which the ligand molecule is inserted between neighboring adenine bases through the stacking of the ligand between the bases on the chain (48). The binding of neomycin to poly(rA) found here generates a CD spectrum similar to those of berberine and palmatine suggesting the involvement of a similar RNA structure. However, additional structural studies will be needed to confirm these analysis and explain the poly(rA) conformation induced by neomycin.
Polyuracylic acid (poly(rU))
RNA homopolymer poly(U) does not show a clear melting transition in the temperature range studied (10-75 °C) at either high or low pH (Supporting Information Figure S9). It has been reported that poly(rU) does not possess any specific structure at ambient temperatures, indicating a lack of stacking interaction between the uridine bases, thereby leading to a random-coil conformation (51). However, poly(rU) has been found to exhibit a secondary structure, an antiparallel double helix, at low temperatures (52). This structure is reported to adopt an A-form conformation (53). The stability of this duplex is quite low, exhibiting a melting temperature of ~5 °C. Counterions and polyamines such as spermine have been shown to stabilize this poly(rU)•poly(rU) duplex significantly (54).
A CD scan was taken at high temperature for random structured poly(rU) (Figure 5a). A strong positive band at 270 nm, a negative band at 243 nm, and a very strong positive band at 203 nm were observed. These peaks are considered to be characteristic CD peaks for single stranded poly(rU). The CD scan at 20 °C shows a 5 nm blue shift of the 270 nm and the development of a new negative peak around 210 nm (Figure 5b), indicating the formation of a secondary structure. This secondary structure, the antiparallel double-stranded poly(rU), shows an unexpected binding enthalpy when complexed with neomycin (−8.1±0.4 and −22.5±0.1 kcal/mol, Figures 5cd). In contrast to all other nucleic acids investigated, this observed binding enthalpy increased in magnitude as the temperature decreased (Figure 5d). A likely reason for this observation is that neomycin favors the double stranded poly(rU) and has no effect on the single-stranded poly(rU). The significantly lower binding enthalpy at 20 °C can be attributed to the decreased number of poly(rU) duplex species in solution. Furthermore, addition of neomycin to poly(rU) at 20 °C increased the positive CD signal and induced a blue shift of bands at 270 and 210 nm (Figure 5b). Similar to the poly(rA) system, the ΔTm method is not applicable here in calculating the binding constant of neomycin bound to poly(rU) at pH 5.5 or 6.8 due to the difficulties in experimentally determining the melting temperature.
Figure 5.
CD titration of neomycin into poly(rU) (100 uM/strand) at (a) 59 °C (b) 20 °C. The CD spectrum with solid circle represents the RNA by itself. The inset in figure 5b shows the CD spectra of RNA alone (continuous line) and ligand-saturated complex (dashed line). ITC titration of neomycin with poly(rU) (200 uM/strand) (c) 20 °C (d) 10 °C . The experiments were conducted in buffer 10 mM sodium cacodylate, 0.5 mM EDTA, 100 mM NaCl at pH 6.8.
AT-rich duplexes poly(dA)•poly(dT) & poly(dA-dT)•poly(dA-dT)
The conformation of polynucleotide AT-rich duplexes poly(dA-dT)•poly(dA-dT) and poly(dA)•poly(dT) belong to the B and B* form DNA respectively, containing a narrow minor groove and a wide and shallow major groove. The two polymers possess differing physical properties. For example, the melting temperature of poly(dA)•poly(dT) (AT duplex, 69.3 °C) is about ~8 °C higher than poly(dA-dT)•poly(dA-dT) (alternating AT duplex, 61.7 °C) (Table 3, Supporting Information Figures S10,S11). In addition, the disproportionation of poly(dA)•poly(dT) duplex to a poly(dA)•2poly(dT) triplex and the single-stranded poly(dA) is observed at low pH, similar to the disproportionation of poly(rA)•poly(rU) duplex into triplex and single strands (43).
Table 3.
Thermodynamic Profiles of Neomycin Interaction With a Variety of Nucleic Acids. Buffer 10 mM Sodium Cacodylate, 0.5 mM EDTA, 100 mM NaCl at pH 6.8.
| ΔHwc (kcal/mol) |
Tm0 (°C) |
Tm (°C) |
ΔT (°C) |
n | ΔH(10°C) (kcal/mol) |
ΔH(20°C) (kcal/mol) |
ΔH(30°C) (kcal/mol) |
ΔCp (cal/mol.K) |
|
|---|---|---|---|---|---|---|---|---|---|
| poly(rA) | - | - | 42.0 | - | 4.0 | - | - | - | - |
| poly(rU) | - | <10 | 20.0 | - | 8.5 | −22.5±0.1 | −8.1±0.1 | - | - |
| poly(dA-dT) •poly(dA-dT) |
5.17 | 61.7 | 62.5 | 0.5 | 7.0 | −3.4±0.1 | −3.7±0.2 | - | −26±24 |
| poly(dGdC)• poly(dG-dC) |
6.10 | 111.7 | 112.7 | 1.0 | 6.0 | −2.7±0.1 | −3.0±0.1 | - | −28±22 |
| poly(dA)•poly(dT) | 4.04 | 69.3 | 69.7 | 0.4 | 9.0 | −7.2±0.1 | −7.7±0.3 | - | −58±25 |
| Calf thymus | 10.25 | 84.4 | 85.0 | 0.6 | 6.0 | −3.7±0.1 | −5.0±0.1 | - | −120±16 |
| i-motif | 4.25 | 50.0 | 53.5 | 3.5 | 4.0 | −6.4±0.2 | −7.9±0.1 | - | −151±32 |
| poly(rA)•poly(dT) | 9.21 | 65.2 | 67.3 | 2.1 | 8.0 | −2.5±0.1 | −3.9±0.1 | −5.7±0.1 | −159±50 |
| d(A2G15C15T2)2 | 3.41 | 93.8 | 95.2 | 1.4 | 10.0 | −7.2±0.1 | −9.5±0.2 | −11.9±0.1 | −235±10 |
| poly(rA)•2poly(rU) | 12.21 (3>1) |
59.0 | - | - | 8.5 | −4.6±0.2 | −7.0±0.1 | −9.4±0.1 | −238±22 |
| poly(dA)•2poly(dT) | 1.00 | 23.4 | 50.0 | 26.6 | 7.0 | −6.6±0.1 (10°C) |
−7.9±0.1 (15°C) |
−8.7±0.1 (18°C) |
−264±23 |
| poly(rA)•poly(rU) | 6.75 | 59.0 | 73.1 | 14.1 | 7.0 | −4.2±0.1 | −7.6±0.1 | −9.8±0.1 | −279±11 |
| poly(dA)•poly(rU) | 5.3 | 48.4 | 65.2 | 16.8 | 6.0 | −2.8±0.1 | −6.3±0.1 | −9.0±0.1 | −311±15 |
| 16S A-site RNA | 78.8 | 71.8 | 75.4 | 3.6 | 1.0 | −9.7±0.1 | −13.0±0.1 | −16.7±0.1 | −350±20 |
pH 5.5
Disproportionation of poly(dA)•poly(dT) in the presence of neomycin was observed at pH 5.5 (Figure 6a). Beginning at 30 °C, the absorbance of the solution gradually decreased, indicating the rearrangement of poly(dA) and poly(dT). This rearrangement was complete at 80 °C and the poly(dA)•2poly(dT) formed after disproportionation denatured directly from triplex to single strands at 91 °C. Due to the formation of poly(dA)•2poly(dT) under this condition, the stabilization effect of neomycin on the poly(dA)•poly(dT) cannot be evaluated, thus preventing the calculation of the binding constant using ΔTm method.
Figure 6.
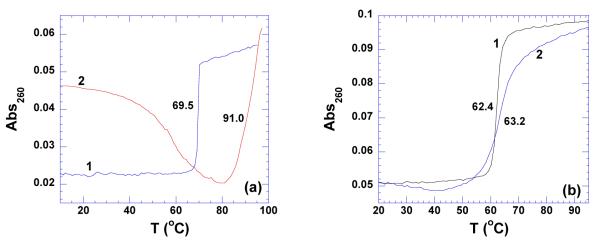
(a) UV thermal denaturation profiles of poly(dA)•poly(dT) (a) in the absence (1) and presence (2) of neomycin at rbd 5. (b) UV thermal denaturation of poly(dA-dT)•poly(dA-dT) in the absence (1) and presence (2) of neomycin at rbd 5. The experiments were conducted in buffer 10 mM sodium cacodylate, 0.5 mM EDTA, 100 mM NaCl at pH 5.5.
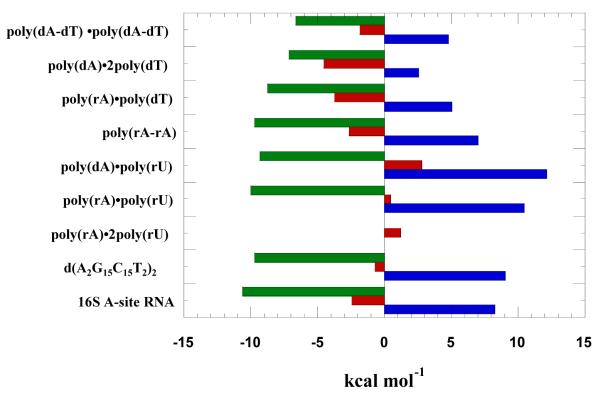
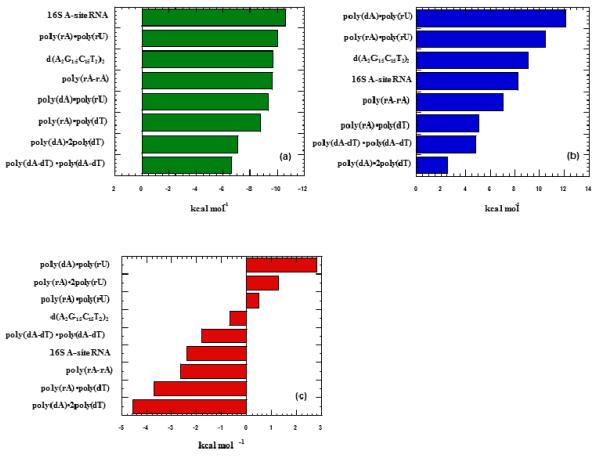
Unlike poly(dA)•poly(dT), alternating AT duplex poly(dA-dT)•poly(dA-dT) does not disproportionate into a triplex (Supporting Information Figure S12). The thermal stabilization upon neomycin binding to poly(dA-dT)•poly(dA-dT) was however observed to be very small (ΔTm ~ 1 °C) (Figure 6b). The heat capacity change derived from ITC titration was observed to be −16±10 cal/mol.K (Table 4), indicating almost no solvent accessible surface area change upon binding. Using this small change in denaturation temperature, the association constant of neomycin binding with poly(dA-dT)•poly(dA-dT) was estimated to be Ka = (8.9±0.1)×104 M−1 (Table 4). Further analysis of the thermodynamic data showed that 74 % of the driving force of binding was entropy driven (Figure 23).
Figure 23.
Thermodynamic profile of neomycin-nucleic acid binding; green bars represent ΔG, red bars represent ΔH, and blue bars represent TΔS. The experiments were conducted in buffer 10 mM sodium cacodylate, 0.5 mM EDTA, 100 mM NaCl at pH 5.5.
pH 6.8
As expected, both poly(dA-dT)•poly(dA-dT) and poly(dA)•poly(dT) exhibit higher binding enthalpies at pH 6.8 (−3.7±0.2 kcal/mol and −7.7±0.3 kcal/mol, respectively; Table 3, Figure 7ba). In addition, both duplexes show small heat capacity changes upon neomycin binding (−26±24 cal/mol.K for poly(dA-dT)•poly(dA-dT) and −58±25 cal/mol.K for poly(dA)•poly(dT) (Table 3). Thermal denaturation experiments revealed a negligible change (ΔTm ~ 0.5 °C) in the melting temperature upon neomycin binding. The binding enthalpy obtained at pH 6.8 includes the heat of protonation of amino groups upon neomycin complexation with the nucleic acid. Therefore all association constants reported using ΔTm-method in this article have been obtained at pH 5.5.
Figure 7.
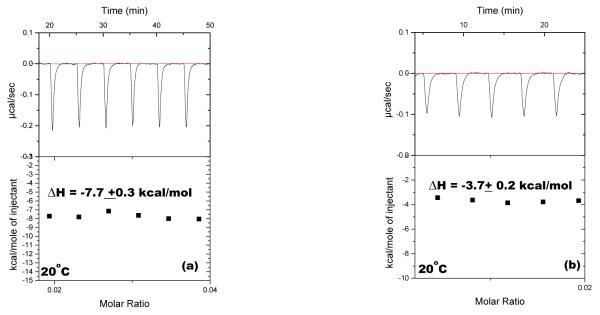
ITC titration of neomycin into (a) poly(dA)•poly(dT) (150 uM/base pair) (b) poly(dA-dT)•poly(dA-dT) at 20 °C, (150 uM/base pair). The experiments were conducted in buffer 10 mM sodium cacodylate, 0.5 mM EDTA, 100 mM NaCl at pH 6.8.
GC-rich duplexes poly(dG)•poly(dC), d(A2G15C15T2)2 and poly(dG-dC)•poly(dG-dC)
GC-tract DNA can adopt either A-form or B-form conformation, depending on the guanine-guanine base stacking. Poly(dG)•poly(dC) fiber is known to exhibit A-form conformation (55, 56), but in the aqueous solution and low salt concentration (30 mM NaCl), poly(dG)•poly(dC) was also found to adopt a B conformation (57). This B-conformation of poly(dG)•poly(dC) can be converted to A-form by changing the salt concentrations (57). The A-form can be also be significantly stabilized by C5-methylation (57). However, the study of long runs of Gn•.Cn sequence can be problematic due to aggregation and the susceptibility of base pair slippage (58, 59). Moreover, multiple structures may coexist in the 1:1 poly(dG): poly(dC) aqueous solution (60). For example at pH 8.0, both poly 2(dG)•poly(dC) triplex and poly(dG)•poly(dC) duplex were found to coexist in solution (60). As shown in Figure 8a, the DSC melting profile of poly(dG)•poly(dC) exhibits two peaks, one at ~ 93.2 °C, the other at ~102.7 °C at pH 6.8. This structure of poly(dG)•poly(dC) is affected by ionic strength resulting in only one transition at 96.2 °C in 150 mM KCl (data not shown). More strikingly, the structure of the original poly(dG)•poly(dC) is not re-formed after renaturation. The newly formed structure melts at approximately 60 °C (data not shown). The addition of neomycin to this GC-rich duplex red shifts the positive peak at 257 nm and induces a strong negative peak at 210 nm as well (Figure 8b). This change in the CD spectrum suggests induction of an A-like conformation. However, the spectrum also displays two shoulders at 257 and 290 nm which negates the existence of a pure A-form conformation in the solution (Figure 8b). This heterogeneous composition of the poly(dG)•poly(dC) aqueous solution prevented us from obtaining thermodynamic data upon neomycin interaction. Therefore, a GC-rich oligomer, d(A2G15C15T2)2 has been used as a model for poly(dG)•poly(dC) and is discussed in the next section.
Figure 8.
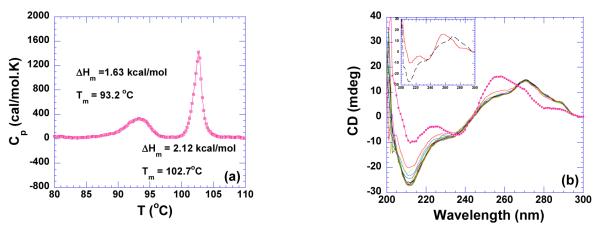
(a) DSC melting profile of poly(dG)•poly(dC) (100 uM/base pair) at pH 6.8. (b) CD scans of neomycin titration with poly(dG)•poly(dC) (75 uM/base pair) at pH 6.8. The experiments were conducted in buffer 10 mM sodium cacodylate, 0.5 mM EDTA, 100 mM NaCl.
d(A2G15C15T2)2
pH 5.5
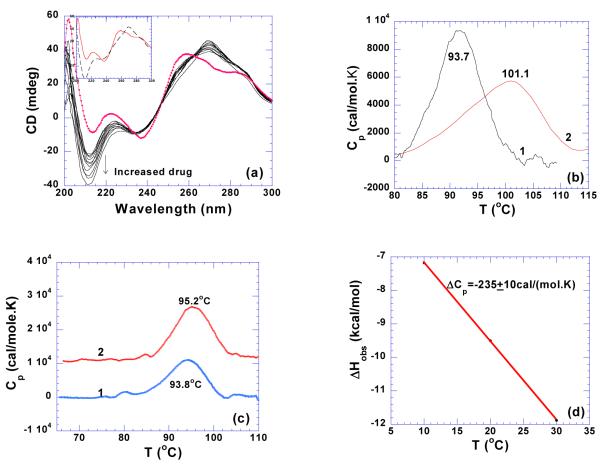
Although GC-tract sequences are known to have a propensity for A-form structures, an absolute A-form structure (as evidenced by CD spectroscopy) was not observed for this duplex under the conditions studied (Figure 9a). However, addition of neomycin converts the self-complementary d(A2G15C15T2)2 duplex toward the A-form, observed as a predominant CD band at 270 nm (Figure 9a), consistent with previous reports (61). The structural basis for B to A-form transition can be explained by the relative proximity of two negatively charged sugar-phosphate backbones along the major groove of A-form conformation which can be neutralized by the positively changed amino groups present on these ligands (61).
Figure 9.
(a) CD scans of neomycin titration with d(A2G15C15T2)2 at pH 5.5 (5 uM/duplex). The scan with solid circle is the one of DNA by itself. The inset shows the CD spectra of DNA alone (continuous line) and ligand saturated complex (dashed line). (b) DSC melting profiles of d(A2G15C15T2)2 in the absence (1) and presence (2) of neomycin at rdb 10 at pH 5.5, (5 uM/duplex). (c) DSC melting profile of d(A2G15C15T2)2 in the (1) absence and (2) presence of neomycin at rbd 10, pH 6.8 (5 uM/duplex). (d) Observed binding enthalpy change for neomycin binding to d(A2G15C15T2)2 at various temperature, pH 6.8. The experiments were conducted in buffer 10 mM sodium cacodylate, 0.5 mM EDTA, 100 mM NaCl.
Neomycin has a greater stabilizing effect on the d(A2G15C15T2)2 duplex at pH 5.5 than pH 6.8, (ΔTm ~7 °C at rbd 10 at pH 5.5; Table 4, Figure 9b) compared with less than a two degree increase at pH 6.8 (Table 3, Figure 9c). However, the ITC derived heat capacity change (−173±23 cal/mol.K; Table 4, Supporting Information Figure S13) is significant at such a low pH value, which implies enhanced binding due to large removal of nonpolar surface area. A direct ITC titration led to an association constant of neomycin binding with d(A2G15C15T2)2 duplex to be Ka = (1.8±0.6)×107 M−1 at pH 5.5 (Table 4). A breakdown of binding energetics revealed a large contribution from entropy (~92%) for this interaction at low pH (Figure 23).
pH 6.8
The conformation of d(A2G15C15T2)2 duplex at pH 6.8 was observed to be similar to the conformation observed at pH 5.5 as seen from the CD spectra (Supporting Information Figure S14). However, the heat capacity change observed at pH 6.8 (−235±10 cal/mol.K; Table 3, Figure 9d, Supporting Information Figure S15) is larger than one obtained at pH 5.5. In addition to the change in solution electrostatics, the heats of amino group protonation of neomycin likely contribute to the difference in heats of binding and heat capacities.
Poly(dG-dC)•poly(dG-dC)
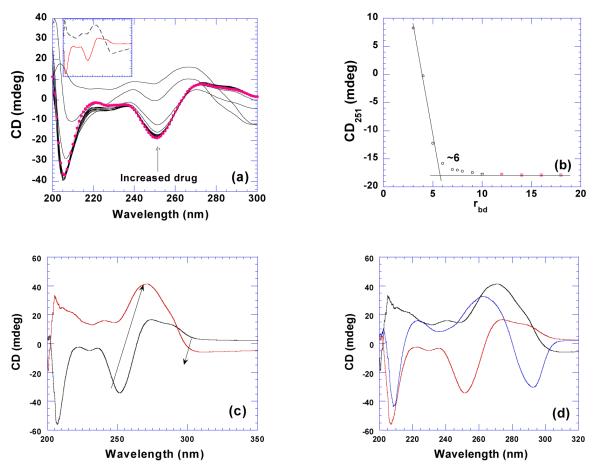
Alternating GC sequence poly(dG-dC)•poly(dG-dC) was also studied which showed different conformational features from Gn•Cn tract sequences. As seen in Figure 10a, poly(dG-dC)•poly(dG-dC) displays a negative band at 247 nm and two positive overlapping bands at 265 and 285 nm. This can be attributed to be B-form base stacking through a comparison with its related canonical B-form structure, d(GCGCGCGC) while the peak at 265 nm corresponds to A-form base stacking (45). Although poly(dG-dC)•poly(dG-dC) exhibits some features of the A-form structure, overall it is still regarded as a B-form DNA (62). It has been previously reported that poly(dG-dC)•poly(dG-dC) undergoes a B to Z-form transition in different salt conditions (63, 64). This Z-conformation of poly(dG-dC)•poly(dG-dC) is only stable under high salt conditions (4 M NaCl) (62). However, bromination at C8 position of the guanine can stabilize the Z-form at low salt conditions (150 mM NaCl) (65). As shown in Figures 10ab, titration of neomycin into this duplex does not result in the conformational change until saturation is reached, rbd 6. Conformational change was observed with the gradual disappearance of the negative band at 247 nm, formation of a new negative band at 295 nm, and the blue shift for the positive band at 270 nm (Figure 10c). All of those features indicate the unexpected formation of a new structure, Z-form DNA. A comparison of a high salt induced Z-form with the neomycin induced structure reveals little difference between the two spectra with one exception, a new positive band at 205 nm, Figure 10d. The opposite patterns observed in the CD spectra appear to be a consequence of the different handedness of the respective polymeric backbones. This result suggests that neomycin induces a left handed conformation similar in structure to the polyamine induced Z-form transition observed with methylated poly(dG-dC)2 (66).
Figure 10.
(a) CD titration of neomycin into poly(dG-dC)•poly(dG-dC). The CD spectrum with solid circle represents the DNA by itself. The inset shows the CD spectra of DNA alone (continuous line) and ligand-saturated complex (dashed line). (b) A plot of CD intensity at 251 nm vs. respective rbd values. (c) CD spectrums for poly(dG-dC)•poly(dG-dC) B and Z-form structures. The black line represents the B-form DNA and the red line represents the neomycin induced Z-form DNA. (d) A comparison of the CD signals for B-form poly(dG-dC)•poly(dG-dC) (red), the neomycin induced Z-form poly(dG-dC)•poly(dG-dC) duplex (black), and the high salt induced poly(dG-dC)•poly(dG-dC) Z-form structure (blue) (62). The experiments were conducted with 75 uM/base pair DNA in buffer 10 mM sodium cacodylate, 0.5 mM EDTA, 100 mM NaCl at pH 6.8 with the exception of the high salt induced transition which was conducted at NaCl 20% w/w.
The thermodynamics of poly(dG-dC)•poly(dG-dC) reveals little thermal stabilization by neomycin binding (ΔTm= 1.0 °C) and a small heat capacity change (−28±22 cal/mol.K) (Table 3, Supporting Information Figures S16,S17).
Calf thymus DNA
Calf thymus DNA has been found to undergo a transition from B to Z by polyamines such as spermine, spermidine, and putrescine (67). A recent study has shown that the conformation of calf thymus DNA can be partially converted from B to A by the intercalation of ethidium bromide, acridine orange, and methylene blue (68). Calf thymus DNA, which contains 42% GC base pairs, was studied with the aim of investigating the GC-content dependence for the binding affinity of neomycin with GC-rich sequences. CD spectra of calf thymus DNA shows a positive band at 270 nm, a negative band at 247 nm and a weak band at 210 nm, characteristic of a standard B-form DNA (Supporting Information Figure S18). Titration of neomycin into DNA solution results in red shift of the band at 270 nm, indicating base-stacking may change towards A-form structure. However, the overall structure of neomycin bound calf thymus still exhibits the B-form characteristics.
Hybrid duplexes poly(dA)•poly(rU) and poly(rA)•(dT)
DNA•RNA hybrid duplex is believed to adopt an intermediate conformation between the A-form of RNA and the B-form of DNA. Its global structure tends to be closer to A-form, with the RNA strand containing A-features and the DNA strand adopting a B-form structure. It has been reported that the hybrid duplex containing a DNA purine strand and a RNA pyrimidine strand (dR•rY) shows much less stability than its corresponding reciprocal structure (rR•dY) (69, 70). As shown in Figure 11a, poly(dA)•poly(rU) denatures at 43.6 °C, while poly(rA)•poly(dT) melts at 64.7 °C. Previous studies of oligonucleotide hybrid duplexes have shown that DNA-RNA hydrid duplexes exhibit more greater characteristics of an A-form conformation than B-form (71) with the exception of polynucleotide hybrid poly(rA)•poly(dT) which can adopt B-form conformation under highly solvated conditions (44).
Figure 11.
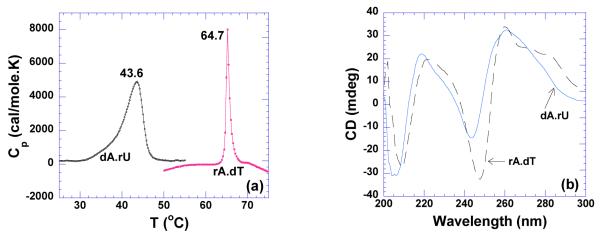
(a) DSC melting profiles of dA•rU and rA•dT (150 uM/base pair). (b) CD scans of rA•dT and dA•rU hybrid at 20°C (40 uM/base pair). The experiments were conducted in buffer 10 mM sodium cacodylate, 0.5 mM EDTA, 100 mM NaCl at pH 5.5.
pH 5.5
As observed in Figure 11b, the CD spectrum of poly(dA)•poly(rU) exhibits a strong positive band at 260 nm and strong negative band at 210 nm, indicating an A-form conformation. In contrast, a strong negative band at 247 nm and a broad positive shoulder from 270-285 nm were observed for poly(rA)•poly(dT), indicating a B-form conformation. Higher heat capacity change was observed for poly(dA)•poly(rU) (−160±18 cal/mol.K) than for the poly(rA)•poly(dT) hybrid (−50±20 cal/mol.K) (Table 4, Supporting Information Figures S19,S20). A positive binding enthalpy (2.8 kcal/mol) was observed for neomycin binding to poly(dA)•poly(rU) (Supporting Information Figure S20). At low pH, the binding becomes entropically favorable. Factors that contribute to favorable entropy include desolvation of interacting species, conformational change upon binding, dehydration, and hydrophobic effects (72). Therefore, the endothermic binding interaction observed between neomycin and poly(dA)•poly(rU) can be explained by one or more of the factors mentioned above. The binding constant for neomycin-poly(dA)•poly(rU)interaction was calculated to be Ka = (9.4±0.1)×106 M−1, approximately three times higher than that of poly(rA)•poly(dT), with Ka = (3.4±0.4)×106 M−1 (Table 4).
pH 6.8
At pH 6.8, both poly(rA)•poly(dT)and poly(dA)•poly(rU) adopt similar conformations to those observed at pH 5.5 (Supporting Information Figure S21), indicating that the pH has no effect on hybrid structures. Neomycin stabilizes poly(dA)•poly(rU) significantly at both low and high pH, raising the melting temperature ~20 °C at saturated drug ratios (Supporting Information Figures S20-S24). This thermal stabilization induced by neomycin is much higher than the well-known intercalator for DNA•RNA hybrids, ethidium bromide (30).
RNA Duplex 16S A-site rRNA
The natural target of aminoglycosides, 16S A-site rRNA, has been studied extensively over the past two decades. The binding of the aminoglycosides has been shown to disrupt codon-anticodon interaction on the rRNA leading to erroneous protein synthesis (1). It has been previously shown that neomycin-class aminoglycosides target a specific conserved sequence in the 16S rRNA A-site of the 30S ribosomal subunit (73). The first molecular insights into the aminoglycoside-A site binding were obtained for paromomycin and gentamicin C1a using NMR (2, 74). Later, X-ray crystal structures were reported for paromomycin (75), tobramycin (76), and geneticin (77) bound to RNA sequences containing the A-site. We have conducted ITC titrations of neomycin with the A-site 16S rRNA at a pH where all amino protons on neomycin are protonated, and under solution conditions identical to those used for other nucleic acids in this report.
pH 5.5
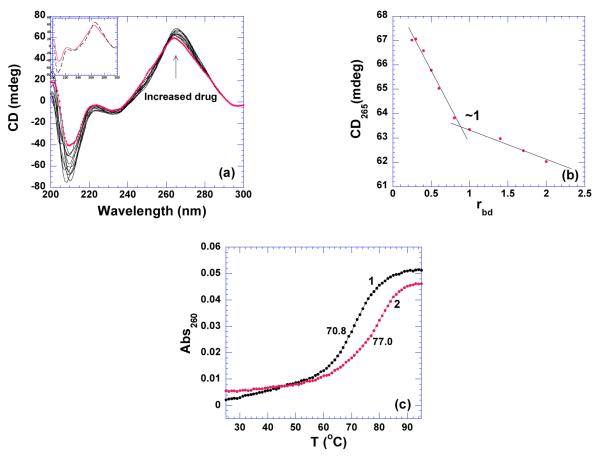
Figure 12a shows the CD spectra showing the titration of 16S A-site rRNA by neomycin. The titration of neomycin gradually increases the intensity at 210 and 265 nm, with no change at other wavelengths. The induced CD signal at 265 or 210 nm can be plotted with the respective rbd ratios, yielding the binding site size of one ligand per RNA molecule (Figure 12b). However, it has been shown that neomycin binding to 16S A-site rRNA exhibits two binding events with binding stoichiometry ~1:1 and ~ 2:1 ligand/ duplex using ITC (7). This second binding event was not detected using CD. The enthalpy of neomycin binding with 16S rRNA A-site was found to be −2.4 kcal/mol at 20 °C, contributing 23% driving force to the binding free energy (Table 4, Figure 23, Supporting Information Figure S25). The association constant of neomycin binding was found to be Ka = (8.7±0.9)×107 M−1, the highest among all the nucleic acids studied in this report (Table 4). The thermal stability increase upon neomycin binding was found to be ~ 7 °C (Figure 12c).
Figure 12.
(a) CD scans of neomycin titration with 16S rRNA A-site. The scan with solid circle is the one of RNA by itself. The inset shows the CD spectra of RNA alone (continuous line) and ligand saturated complex (dashed line). (b) A plot of change in CD signals at 265 nm versus corresponding rbd values. The intersection of two apparent linear sections reveals binding site size. (c) UV thermal denaturation profiles of RNA in the absence (1) and presence (2) of neomycin at rbd of 1. The experiments were conducted with 10 uM rRNA in buffer 10 mM sodium cacodylate, 0.5 mM EDTA, 100 mM NaCl at pH 5.5.
pH 6.8
Neomycin titration into the 16S A-site rRNA at pH 6.8 yielded a similar binding event as that found at pH 5.5. The thermal stability increase induced by neomycin was found to be smaller at pH 6.8 than that at pH 5.5 (ΔTm ~ 4 ° C, Supporting Information Figure S26), indicating better stabilization of the RNA in the drugs protonated state. Furthermore, the heat capacity change derived from ITC titration (−350+20 cal/mol.K) is more than two times higher than that obtained at at pH 5.5 (−151+12 cal/mol.K) (Tables 3, 4 and Supporting Information Figures S27,S25). Such a big discrepancy in the heat capacities can be attributed to the large binding-induced ligand protonation heats at higher pH (7).
RNA Duplex Poly(rA)•poly(rU)
Poly(rA)•poly(rU) was first reported in solution by Warner (78). The conformation of poly(rA)•poly(rU) is the A-form. An equimolar mixture of poly(rA) and poly(rU) does not necessarily form a duplex. Poly(rA)•2poly(rU) triplex can be induced at a higher temperature (79), high salt concentration, low pH, or in the presence of magnesium ions (51). The nature of species present at a 1:1 poly(rA): poly(rU) ratio triggered much debate in the 1960-70s. Warner concluded the presence of duplex species (80). Fresco, on the other hand, concluded that a three-stranded complex poly(rA)•2poly(rU) formed at equilibrium regardless of the relative proportion of poly(rA) and poly(rU) in the mixture (81). Miles and Frazier demonstrated directly the existence of duplex poly(rA)•poly(rU) using infrared spectroscopy under various ionic conditions (82). This result was confirmed by Stevens and Felsenfeld (79). It has been suggested that the hypochroism observed at 280 nm as the temperature increases corresponds to the denaturation of duplex poly(rA)•poly(rU) and the rearrangement of poly(rA) and poly(rU) to form the three-stranded poly(rA)•2poly(rU) and the free poly(rA) (79). Upon further heating, the three-strand complex then denatures to a single-stranded coil form. The formation of poly(rA)•2poly(rU) at equimolar mixture of poly(rA) and poly(rU) has been demonstrated by Blake and Fresco (83) to be the transient byproduct in the poly(rA)•poly(rU) formation, which disappears very slowly (~72 hours) in 200 mM Na+. Thus, the discrepancies observed by different groups could be attributed to the kinetics of duplex formation.
pH 5.5
As shown in Figure 13a, in the presence of neomycin, poly(rA)•poly(rU) disproportionates into poly(rA)•2poly(rU) triplex and a single strand poly(rA), as is observed by the big drop of absorbance at 280 nm. The triplex then denatures directly from 3->1 at 81.6 °C. The mid-point of the denaturation of poly (rA)•poly(rU) was used as the melting temperature of this duplex in the presence of the ligand. In the absence of neomycin, disproportionation of poly(rA)•poly(rU) was not observed under the conditions used here (Figure 13a).
Figure 13.
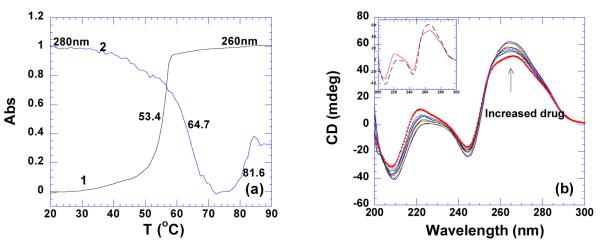
(a) UV melting profiles of poly(rA)•poly(rU) in the absence (1) and presence (2) of neomycin at rbd 8. (b) CD titration of poly(rA)•poly(rU) (75 uM/base pair) with neomycin. The scan with solid circle represents RNA alone. The inset is the CD spectra of RNA alone (continuous line) and ligand-saturated complex (dashed line). The experiments were conducted in buffer 10 mM sodium cacodylate, 0.5 mM EDTA, 100 mM NaCl at pH 5.5.
Poly(rA)•poly(rU) adopts a canonical A-form conformation, observed as a strong positive band at 260 nm and negative band at 210 nm from CD spectra (Figure 13b). Binding of neomycin favors the RNA conformation moving toward more A-form, indicated by the increased intensity at these two peaks. Binding of neomycin with this RNA duplex is entropy-driven, even exhibiting an endothermic heat of interaction at low temperatures (Table 4, Supporting Information Figure S28). Temperature increase led to diminished contribution from entropy, but it still remained the dominating factor (Table 4, Figure 23). Poly(rA)•poly(rU) exhibited a high binding constant with neomycin, Ka = (2.9±0.1)×107 M−1 (Table 4).
pH 6.8
It has been reported that magnesium can induce the poly(rA)•2poly(rU) triplex in equimolar solutions of poly(rA) and poly(rU) (51). Neomycin, a polycation with at least five positive charges, induces the formation of triplex RNA at low pH. However, continous variation and CD spectroscopy showed that titration of neomycin into poly(rA)•poly(rU) duplex at high pH does not convert the spectrum towards a neomycin-poly(rA)•2poly(rU) complex (Figure 14a) under the experimental conditions studied here. CD titration with neomycin revealed a binding site size of 7 base pairs/ duplex. (Figure 14b). ITC titrations utilizing the “model–free” (84) method which improves the accuracy of ΔH determination by plotting a large population of individual heat bursts versus their relative frequencies were conducted to assess the accuracy of single excess site ΔH values. Four separate experiments were performed in which 30 ΔH values from 10 μL injections of low ligand concentration (2 μM) and excess nucleic acid (150 μM/base pair) were recorded (Supporting Information Figure S29). The titrations were then plotted as a function of ΔH versus relative frequency. A Gaussian curve fit of the data yielded ΔH = −9.1±0.3 at 30 °C (Figure 15). A single excess site titration ΔH yielded the enthalpy of binding as −9.8 ±0.1 (Table 3, Supporting Information Figure S30) which constitutes a < 10% error for single excess site titrations.
Figure 14.
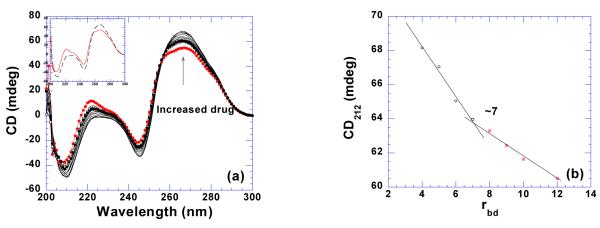
(a) CD titration of poly(rA)•poly(rU) (75 uM/base pair) with neomycin. The scan with solid circle represents RNA alone. The inset is the CD spectra of RNA alone (continuous line) and ligand-saturated complex (dashed line). (b) A plot of CD signals at 243 nm versus corresponding rbd values for binding site size determination. The experiments were conducted in buffer 10 mM sodium cacodylate, 0.5 mM EDTA, 100 mM NaCl at pH 6.8.
Figure 15.
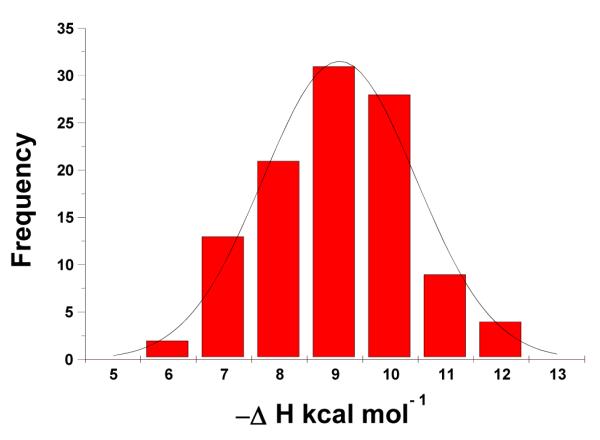
Gaussian distribution of enthalpy values in four separate ITC excess site titration experiments with neomycin into poly(rA).poly(rU) (150 uM/base pair). The experiments were conducted in buffer 10 mM sodium cacodylate, 0.5 mM EDTA, 100 mM NaCl at pH 6.8 and 30 °C.
Triplex Poly(dA)•2poly(dT)
Triplex DNA or RNA can be formed by associating the triplex-forming single strand with a duplex via Hoogsteen hydrogen bonds in the major groove. The solution conformation of DNA triplex poly(dA)•2poly(dT) has been debated. Evidence of a C3′-endo sugar pucker which is characteristic of A-form (85) and a C2′-endo sugar pucker which is indicative of a B-form (86) have been reported. It is likely that poly(dA)•2poly(dT) structure contains conformational features that are intermediate between A and B-form.
Aminoglycosides have a significant stabilizing effect on the triplex thermal stability. Of all aminoglycosides studied, neomycin was discovered to have the highest thermal stabilization on triplex DNA (25).
pH 5.5
As shown in Figure 16a, the DSC melting profile confirms the formation of the poly(dA)•2poly(dT) triplex, with the enthalpy of triplex melting (1.26 kcal/mol) being ~4 times smaller than the corresponding duplex melting (4.87 kcal/mol). The melting temperature of poly(dA)•2poly(dT) triplex shows slight concentration dependence, with the one observed in DSC profile (26.0 °C, 100 μM /base triplet) being 2.5 degrees higher than the one obtained by UV melting profile (23.5 °C, 15 μM / base triplet) (Figure 16b). The addition of neomycin (rbd = 6) into the DNA triplex does not affect the duplex stability. However, it stabilized the triplex thermal stability by 7.5 °C as shown in Figure 16b. These results suggest that neomycin selectively stabilizes the triplex under physiological conditions. ITC excess site titrations at various temperatures yield a large heat capacity change, −264±30 cal/mol.K (Table 4). The binding constant of neomycin interacting with the DNA triplex at pH 5.5 was found to be Ka = (2.4±0.1)×105 M−1(Table 4, Supporting Information Figure S31).
Figure 16.
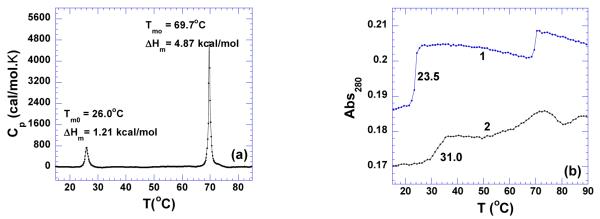
(a) DSC melting profile of poly(dA)•2poly(dT) (100 uM/base triplet). (b) UV melting profiles of triplex in the absence (1) and presence of (2) neomycin at rbd 6. The experiments were conducted in buffer 10 mM sodium cacodylate, 0.5 mM EDTA, 100 mM NaCl at pH 5.5.
pH 6.8
As expected, the binding enthalpy of neomycin interacting with poly (dA)•2poly(dT) is larger at pH 6.8 than at pH 5.5 (Tables 3, 4 and Supporting Information S31,S32). Neomycin shows enhanced thermal stability of DNA triplex at pH 6.8, rbd 7 (Figure 17, Supporting Information Figure S33). However, at pH 5.5, the neutralization of DNA triplex (three negatively charged polymers) potential leads to a reduced interaction with the positively charged ligand, as evidenced by a smaller increase in the triplex denaturation temperature (Figure 16b).
Figure 17.
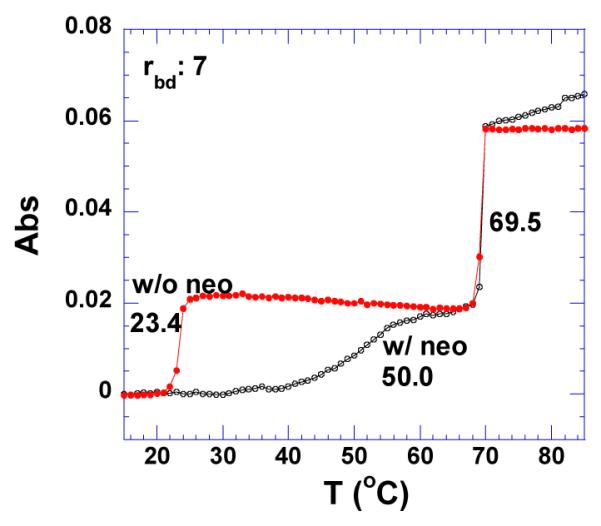
UV thermal denaturation profiles of poly(dA)•2poly(dT) in the absence (1) and presence of (2) neomycin at rbd 7. The experiments were conducted in buffer 10 mM sodium cacodylate, 0.5 mM EDTA, 100 mM NaCl at pH 6.8.
Triplex Poly(rA)•2poly(rU)
Recognition of the RNA triplex has not attracted much attention even though it was the first three-stranded nucleic acid reported (87). The RNA triplex adopts a C3’-endo sugar pucker characteristic of A-form conformation. Ligands like sanguinarine, berberine (88), and berenil (89) have been shown to bind to RNA triplex. Neomycin stabilizes the RNA triplex more significantly than the DNA triplex (21). The DSC melting profile reveals that RNA triplex poly(rA)•2poly(rU) exhibits the same thermal stability as its corresponding duplex at pH 6.8 (ΔTm ~59 °C; Supporting Information Figure S34). The denaturation of the triplex dissociates the three strands directly to the single strand with a melting enthalpy of 5.5 kcal/mol. This enthalpy of melting of three strands, as expected, is much larger than the enthalpy of melting of DNA triplex to duplex and single strand (1.0 kcal/mol). However, it is comparable to the melting enthalpy obtained from the corresponding RNA Watson-Crick hydrogen bond (6.8 kcal/mol) (90). The RNA triplex forms easily even at the equimolar ratio mixture of poly(rA) and poly(rU) (81). In the presence of neomycin, two melting transitions in DSC melting profile are observed for poly(rA)•2poly(rU) at pH 6.8 (Figure 18a, Supporting Information Figure S34). Similarly, at pH 5.5, two melting transition were observed in the UV experiment; one at 45.5 °C identified as triplex melting to single strand and the other transition at 56.2 °C identified as the duplex melting to single strands (Figure 18b). However, these two melting transitions are too close in the DSC melting profile for an accurate determination of melting enthalpies for each transition. This ambiguity prevents an accurate calculation for melting enthalpy of RNA triplex and precludes the determination of a binding constant using the ΔTm method (Supporting Information Figure S35).
Figure 18.
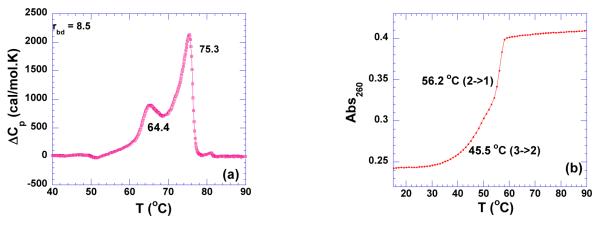
(a) DSC melting profile of poly(rA)•2poly(rU) (100 uM/base triplet) in the presence of neomycin at rbd of 8.5 at pH 6.8. (b) UV melting profile of poly(rA)•2poly(rU) alone at pH 5.5. The experiments were conducted in buffer 10 mM sodium cacodylate, 0.5 mM EDTA, 100 mM NaCl.
Quadruplexes
Four Guanine-rich DNA strands can associate to form a quadruplex structure under physiological conditions. The formation of a G-quadruplex involves eight hydrogen bonds formed through Hoogsteen pairing where four guanines orient themselves in either parallel or antiparallel orientation. The G-rich quadruplex structure can adopt a diverse pattern of folding, resulting from variations in loop size, sequence, and the possible combinations of strand orientation. The binding of small molecules to the quadruplex structure has been intensely researched in recent years (91).
To date, most molecules found to bind to the quadruplex are intercalators with a planar structural feature. Most of these planar aromatic moieties bind to their host quadruplex DNAs with moderate affinities (Ka ~ 105 M−1). Their binding affinities are also highly dependent on the structure of quadruplex DNA (92, 93). While most of the G-quadruplex binding molecules discovered so far have been shown to have non groove binding interactions, only a handful of molecules have been characterized to have interactions in the groove (94). We studied the binding of aminoglycosides to a well-characterized quadruplex formed by the telemoric DNA of Oxytricha Nova (d 5′-GGGGTTTTGGGG-3′) and human telomeric DNA (d 5′-AGGGTTAGGGTTAGGGTTAGGG-3′). These nucleic acid sequences are known to form an antiparallel quadruplex (95). In both sodium and potassium ions, Oxytricha Nova quadruplex is known to have same overall topology with slight variations in the loops connections (96). This quadruplex DNA has four grooves that vary in shape and width and have been classified as narrow, wide, and medium (two grooves which are similar in width and are between the groove widths of narrow and wide grooves). Similarly, the unimolecular human telomeric quadruplex also has medium, narrow, and wide grooves.
Oxytricha Nova Quadruplex
pH 5.5
The formation of the antiparallel quadruplex was checked using CD spectroscopy. As seen in Figure 19a, a positive band at 295 nm and a negative band at 260 nm were observed which are characteristic CD signatures for an antiparallel quadruplex structure (97). To investigate any binding induced changes, CD titration experiments were carried out. The DNA solution was titrated with a concentrated ligand solution serially. However, even after additions of large amounts of the ligand, very small changes in the CD signal at 295 nm or 260 nm were observed (Figure 19). These results indicate that neomycin binding does not perturb the quadruplex structure significantly. UV thermal denaturation experiments showed that the quadruplex melted at 55.9 °C in the absence of ligand (Supporting Information Figure S36). At 1:1 ligand to quadruplex ratio, the DNA melted at 56.3 °C. ITC experiments showed the heat of ligand-quadruplex interaction to be very small at this pH, < 1.0 kcal/mol (Supporting Information Figure S37).
Figure 19.
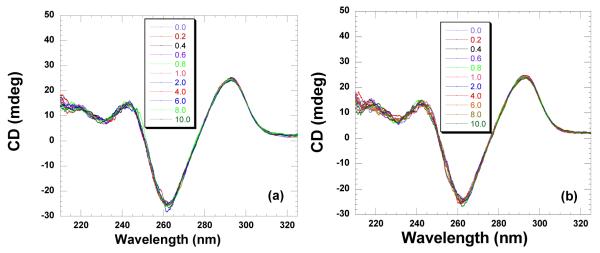
CD titration of Oxytricha nova quadruplex (10 μM/strand) with neomycin. A concentrated solution of neomycin was added to the DNA solution followed by five minute equilibration. The ratios of DNA to ligand are depicted on each graph. The CD scans are an average of two scans. The titrations were conducted in 10 mM sodium cacodylate, 0.5 mM EDTA, 100 mM NaCl at (a) pH 5.5 (b) pH 6.8.
pH 6.8
Similar to observations at pH 5.5, the CD spectrum showed the formation of the quadruplex (Figure 19b). The CD titration with neomycin did not show any significant binding induced changes. Likewise, there was also a small thermal stabilization upon ligand binding at a 1:1 ligand to quadruplex ratio (Supporting Information Figure S36). The ITC experiments were performed to get the binding affinities (Supporting Information Figure S37). ITC derived binding stoichiometry showed approximately one ligand binding to the quadruplex with an affinity of Ka = (1.8±0.3)×105 M−1 (Table 4).
Human Telomeric DNA
pH 5.5
Human telomeric DNA contains a repeat hexamer unit (d-5′TTAGGG). A 22mer oligonucleotide model d-5′AGGGTTAGGGTTAGGGTTAGGG has been shown to adopt an antiparallel structure in solution (98). The CD spectrum showed a positive peak at 295 nm and a negative peak at 260 nm which are consistent with the antiparallel structure of the quadruplex (Figure 20a). To characterize the binding induced structural changes, CD titration with increasing ligand concentrations were conducted. Even after large additions of neomycin to the quadruplex, very small changes in the CD intensity were observed at 295 nm. These results indicate that similar to Oxytricha nova, this quadruplex undergoes very small structural changes upon ligand binding and the overall antiparallel fold of the quadruplex is preserved. The UV thermal denaturation studies showed small thermal stabilization < 1 °C (Supporting Information Figure S38). Similar to the Oxytricha nova, due to the low heats of interaction in the ITC studies, the resulting enthalpy profile could not be fitted at this pH (Supporting Information Figure S37).
Figure 20.
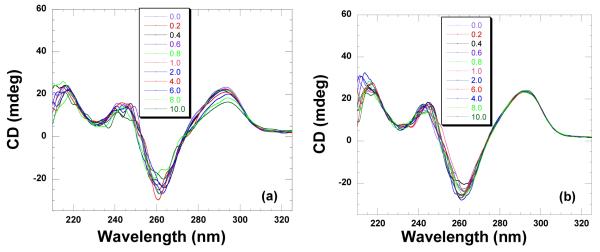
CD titration of human telomeric quadruplex (10 μM/strand) with neomycin. A concentrated solution of neomycin was added to the DNA solution followed by five minute equilibration. The ratios of DNA to ligand are depicted on each graph. The CD scans are an average of two scans. The titrations were conducted in 10 mM sodium cacodylate, 0.5 mM EDTA, 100 mM NaCl at (a) pH 5.5 (b) pH 6.8.
pH 6.8
As seen from the CD spectrum, the antiparallel structure was confirmed by the positive band at 295 nm. The addition of neomycin resulted in minimal changes in the CD intensity at 295 nm (Figure 20b). Similar to the results at pH 5.5, UV thermal denaturation experiments also showed minimal thermal stabilization (Supporting Information Figure S38). ITC derived binding constants were obtained using a one site binding model (Supporting Information Figure S37). The results obtained show that neomycin binds to the human telomeric DNA with 1:1 ligand to quadruplex ratio with an affinity constant Ka = (2.5±0.2)×104 M−1 (Table 4).
i-motif poly(dC)
Cytosine-rich polynucleotides or oligodeoxynucleotides can adopt a non-B form structure called i-motif under slightly acidic or neutral pH. This i-motif DNA is a tetramer of equivalent strands, containing two duplexes zipped together in an antiparallel fashion. The individual parallel stranded duplexes have their hemiprotonated C•C+ base pairs face to face in the right handed and unwound manner (Figure 1) (99). This structure contains two wide and two narrow grooves.
The cytosine-rich sequence is found at the 5′ end of the telomere in eukaryotic chromosomes (100) and some non-coding regions of eukaryotic DNA such as promoter sites and introns. Some RNA in the genomes of various cardioviruses and encephalomyocarditis viruses contain many stretches composed of more than 75% cytosine (100).
As shown in Figure 21a, the CD scan of the poly(dC) sequence exhibits a strong positive band at 285 nm and a negative band at 265 nm, both characteristics of i-motif structure. Titration of neomycin shows the formation of a complex with isosbestic point at 272 nm. Binding of neomycin at rbd4 increases the thermal stability of the i-motif DNA by 4 degrees (50 °C → 53.5 °C) as shown in Figure 21b, Supporting Information Figure S39. The binding affinity cannot be accurately calculated using the ΔTm method due to the heat of protonation contribution to enthalpy at pH 6.8.
Figure 21.
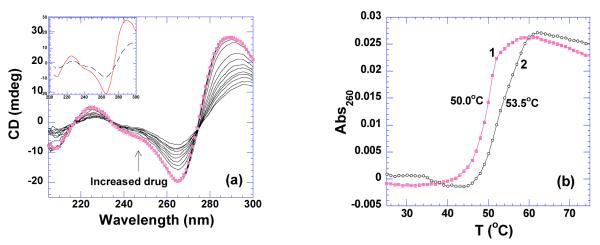
(a) CD titration of neomycin into i-motif DNA(50 uM/base pair). The spectrum with solid circle represents the one of DNA only. The inset shows CD spectra of DNA alone (continuous line) and ligand-saturated complex (dashed line). (b) UV melting profiles of i-motif DNA in the absence (1) and presence (2) neomycin at rbd 4. The experiments were conducted in buffer 10 mM sodium cacodylate, 0.5 mM EDTA, 100 mM NaCl at pH 6.8.
Discussion
Comparison of neomycin-nucleic acid interaction at pH 5.5 and 6.8
Aminosugars such as neomycin undergo protonation after complexation with DNAs or RNAs (72). This presents a significant problem in obtaining the intrinsic binding enthalpy and heat capacity change at or near physiological pH. Thus, the binding affinity calculated with the ΔTm method (7) using these thermodynamic parameters could be overestimated at this pH. Inspection of the pKa values of the six amino groups on neomycin shows that it is almost fully protonated at pH 5.5 (72). Thereby, enthalpies of binding obtained at this pH reflect values close to the intrinsic heats of binding of neomycin-nucleic acid complexation. Caution however must be exercised since pH 5.5 can itself induce nucleic acid instability for some structures. In this report, we have reported thermodynamic studies of neomycin binding at pH 6.8 and 5.5 to single strand, duplex, triplex and quadruplex nucleic acids. The results presented provide a fundamental basis for understanding neomycin’s interaction and selectivity for a variety of nucleic acids and can serve as a database for the studying aminosugar, and modified aminosugar binding to nucleic acid targets.
The advantage of study at pH 6.8 is that all the conformations adopted by nucleic acids, their binding site size, melting enthalpy, and thermal stabilization by neomycin reflect binding properties that would be reflective of solution conditions, much closer to physiological conditions. At pH 5.5, neomycin amines are nearly protonated, thus the observed binding enthalpy, entropy, and binding constant reflects the intrinsic heat of interaction between the ligand and nucleic acids. However, study at such a low pH leads to practical problems such as a decreased enthalpy of interaction and reduced nucleic acid stability. At pH 6.8, the observed binding enthalpy includes the intrinsic binding enthalpy between neomycin and nucleic acid, the binding linked heat of protonation, and the dilution heat of the ligand. The dilution heat can be obtained experimentally by titrating the ligand solution into buffer only. The protonation heat of neomycin differs from system to system, depending on the extent of binding linked protonation, and thus contributes differently to the observed ΔCp and binding constants. The overestimated binding enthalpy obtained from ITC experiments at pH 6.8 can therefore lead to a slightly higher binding constant with ΔTm-based method. ΔTm-based binding constants at this pH are not reported here but the observed heats of interaction and Tm changes are listed in Table 3.
Negative ΔCp was observed for neomycin-nucleic acid interactions at both pH 5.5 and 6.8 (Tables 3, 4). The negative ΔCp is thought to be a distinctive feature of site-specific binding in protein-DNA interactions. The negative sign partially results from the removal of large amounts of nonpolar surface area upon complex formation (101, 102). Solvent-accessible surface area change (ΔSASA) has an impact on the value of ΔCp as well (7) (103, 104). Removal of nonpolar surface area causes the ΔCp value to be more negative while the removal of polar surface leads to a more positive ΔCp value. In addition to removal of nonpolar solvent accessible surface area, changes in vibrational modes of macromolecules and water molecules, (105), as well as the involvement of conformational equilibrium of macromolecules (106, 107), contribute to the ΔCp. Binding coupled protonation of ligand molecule is also believed to contribute to the observed ΔCp value at pH 6.8 (108).
Tables 3 and 4 show the thermodynamic parameters obtained for neomycin interactions with a variety of nucleic acids at both pH 6.8 and 5.5, respectively. Several conclusions can be drawn from the results; (1) In the absence of heat of binding-induced protonation, the binding enthalpies at pH 5.5 are all smaller than the ones observed at pH 6.8. (2) All heat capacity changes at pH 5.5 are smaller than the heat capacities at pH 6.8, suggesting that at pH 6.8 the temperature dependence of the heats of protonation also contribute to the differences in heat capacity changes of interaction. (3) At pH 6.8 and 5.5, CD titration of neomycin into various nucleic acids as well as fluorescence titrations at pH 6.8 of neomycin into the same (Supporting Information Figures S40-S42) reveals similar binding site sizes. This result indicates that different pH values do not affect the binding sites and modes, but may affect the strength of ligand-nucleic acid complexation in addition to the heats of interaction. (4) The preference of neomycin to nucleic acid structures observed at pH 5.5 follows the order: A-site RNA > poly(rA)•poly(rU) > GC-rich 38 mer oligonucleotide DNA > poly(rA)•poly(rA) > poly(dA)•poly(rU) > poly(rA)•poly(dT) > poly(dA)•2poly(dT) > poly(dA)•poly(dT).
McGhee’s statistical mechanical model derived binding affinities
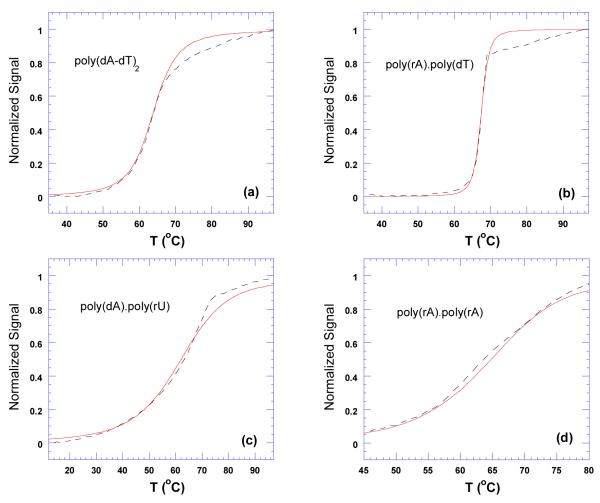
Ligand-DNA Binding affinities can also be determined by using a statistical mechanical model derived from McGhee’s theory for the thermal denaturation of ligand bound DNA (35). By using Tm0, ΔH, n, and ΔHwc from Tables 3 and 4, as well as a nucleation parameter (σ), complete melting curves can be generated. By fitting these models to experimentally derived melting curves, binding affinities can be derived (109). McGhee fits for the thermal denaturation curves of neomycin and nucleic acid duplexes poly(dA-dT)2, poly(rA)•poly(dT), poly(dA)•poly(rU), and poly(rA)•poly(rA) at pH 5.5 are shown in Figure 22. While the McGhee fits produced binding affinities that were consistently lower than the ITC derived constants (Table 4), the overall trend did not change; poly(rA)•poly(rA) Ka = 4.7×10⁶ > poly(dA)•poly(rU) Ka = 9.4×10⁵ > poly(rA)•poly(dT) Ka = 3.4×10⁵ > poly(dA-dT)2 Ka = 2.0×10⁴.
Figure 22.
Thermal denaturation plots for DNA duplexes in the presence of neomycin. The dashed black lines represent thermal denaturation curves from experimental data. The red lines represent best fit simulations derived using McGhee’s statistical mechanical model (109). The corresponding simulated McGhee binding affinity values are as follows; (a) Ka = 2.0×10⁴, (b) Ka = 3.4×10⁵, (c) Ka = 9.4×10⁵, and (d) Ka = 4.7×10⁶. The experiments were conducted in buffer 10 mM sodium cacodylate, 0.5 mM EDTA, 100 mM NaCl at pH 5.5.
Comparison of competition dialysis and ΔTm method derived binding constants of neomycin interaction
When comparing the binding preference of neomycin, we calculated the apparent binding constant Kapp with equation (4) (110);
| (4) |
where Cb and Cf are the bound and free ligand concentrations respectively and [NA]total is the total nucleic acid concentration used in the competition dialysis.
Table 5 shows the binding affinities of neomycin calculated from equation (4) for competition dialysis and ΔTm-based method at pH 5.5. DNA triplex poly(dA)•2poly(dT) and poly(rA)•poly(rA) were not used in competition dialysis since these structures do not exist at pH 7.0 under the salt conditions of comparison. Poly(rA)•2poly(rU) triplex-neomycin binding affinity also cannot be derived from the ΔTm method due to aforementioned reasons.
Table 5.
Comparison of Binding Preference of Neomycin Between Competition Dialysis and ΔTm Method Derived Binding Constants.
| Ka (×105M−1) ΔTm |
Kapp(×105M−1) Competition dialysis |
|
|---|---|---|
| aAT rich duplexes | 0.9±0.1 [poly(dA-dT)2] | 0.08 ±0.02 [poly(dA)•poly(dT)] |
| apoly(dA)•2poly(dT) | 11±1 (15°C) | - |
| apoly(rA)•poly(dT) | 34±4 | 0.17 ±0.09 |
| apoly(dA)•poly(rU) | 94±1 | 0.32±0.04 |
| apoly(rA)•poly(rA) | 170±20 | - |
| aGC-rich duplex | 180±60 {d(A2G15C15T2)2} | 0.21 ±0.06 {poly(dG)•poly(dC)} |
| aapoly(rA)•2poly(rU) | - | 1.00±0.04 |
| apoly(rA)•poly(rU) | 290±10 | 0.35±0.07 |
| b16S A-site RNA | 870±90 | 17.0±0.5 |
Obtained from ΔTm method.
Obtained from ITC data fitting using one binding site model
The binding preference of neomycin observed from competition dialysis is 16S rRNA A site > RNA triplex poly(rA)•2poly(rU) > RNA duplex poly(rA)•poly(rU) > poly(dG)•poly(dC) and poly(dA)•poly(rU) > poly(rA)•poly(dT) > poly(dA)•2poly(dT). The trend observed from ΔTm derived binding affinities at pH 5.5 follows the same general trend: 16S rRNA A site > poly(rA)•poly(rU) > d(A2G15C15T2)2 > poly(rA)•poly(rA) > poly(dA)•poly(rU) > poly(rA)•poly(dT) > poly(dA)•2poly(dT) > poly(dA-dT)2.
Remarkably, both methods exhibit approximately the same order of binding preference of neomycin over the nucleic acids studied. The binding constants obtained from competition dialysis are all smaller in magnitude than the ones observed by ΔTm-based method. The discrepancy could be due to the fact that unlike the excess site ITC titrations, the affinities derived from competition dialysis are averages of affinities for specific as well as the weaker, non-specific ligand binding events that occur at higher concentrations for the polycation-nucleic acid interactions studies here. Other factors such as the effect of the dye on neomycin binding and the binding of the F-neo to the dialysis membrane cannot be ruled out. Therefore, as previously suggested (111), for an accurate determination of binding constants, a rigorous calorimetric treatment is clearly the method of choice. Though competition dialysis may not quantitatively distinguish the binding affinities for primary binding sites, it still can be used qualitatively as an efficient technique to compare the binding preference of neomycin with various nucleic acids, even where weaker secondary binding events may be operable.
The thermodynamic properties for neomycin-nucleic acids interaction are displayed as bar graphs (Figure 23). Individual thermodynamic contributions for neomycin bound to the nucleic acids are mostly entropically driven. As previously stated, neomycin exists in it fully protonated state at pH 5.5 which minimizes enthalpic contributions from binding induced protonation. Accordingly, all structures exhibit large positive entropy values which can be attributed to factors such as desolvation, conformational shifts, and the liberation of counterions as well as water. Interactions with high affinity A-form structures such as poly(rA)•poly(rU) display the highest positive entropy values. As the structures transition from A to B-form, ligand affinities are gradually reduced. High affinity structures such as the 16S A-site RNA were used as a control and represent a special case of an RNA secondary structure. Neomycin binding to 16S A-site RNA exhibits negative enthalpies. Poly(rA)•2poly(rU) displays an incomplete thermodynamic profile as the result of disproportionation of the structure at this pH. A comparison of ΔG values are represented in Figure 24a. As expected, the good potential and shape complements found in A-form structures generate the most negative free energies of binding. Additionally, the higher affinity A-form-ligand interactions are more entropically driven than the lower affinity B-form DNA to ligand binding (Figure 24b). A comparison of ΔH values range from low positive heats for A-form RNA and hybrid structures to negative heats for B-form structures (Figure 24c).
Figure 24.
Thermodynamic profile of neomycin-nucleic acid binding separated according to Gibb’s free energy equation components (Figure 19) and ranked accordingly: (a) ΔG (b) TΔS and (c) ΔH. The experiments were conducted in buffer 10 mM sodium cacodylate, 0.5 mM EDTA, 100 mM NaCl at pH 5.5.
Docking Studies
In the analysis of the various DNA and RNA structures studied in this work, the groove width of the nucleic acid structures appears to strongly impact the binding affinity of neomycin. As seen in Figure 25, the binding of neomycin to various forms of DNA and RNA correlates roughly with the width of the nucleic acid groove. Figure 25a displays the general survey trend from A-form RNA to B-form DNA. As the structures transition from A to B-form and RNA to A-T rich DNA, the free energy of binding decreases as the groove width increases to produce a shallower and wider pocket. The modeling results also correlate well with the entropic contribution to the binding (smaller the groove width, larger the entropic contribution; Figure 24b). This phenomenon is succinctly expressed by Figure 25b. The same trend is further supported by Figure 25c.
Figure 25.
Plot depicting the dependence of neomycin-nucleic acid complex binding energy (absolute value in kcal/mol) as a function of groove width (Å). (a) All nucleic acids studied (b) A-form to B-form structures (c) A-form RNA to B-form DNA structures(Å).
Overall, a strong correlation is seen for the affinity of neomycin to the major groove width of nucleic acid structures and the increase in binding energy correlates well to a decrease in major groove width (A-form RNA > A-form DNA > DNA/RNA hybrid and Triplex > B-form DNA and quadruplex DNA) (Figure 26, Supporting Information Tables S1-S3).
Figure 26.
Computer generated models for neomycin bound various nucleic acid as suggested by docking studies (a) A-site RNA (b) A-form RNA duplex (c) A-form DNA duplex (d) RNA-DNA hybrid duplex (e) B-form DNA.
Conclusion
An attempt has previously been made to depict distinct qualitative differences between the thermodynamic profiles for groove binding versus intercalating ligands (112). Figure 27 is a reproduction of the figure from that study (112). Two distinct groups emerge from the thermodynamic comparison of ΔH with -TΔS; groove binders (empty circles) and intercalators (solid circles) (112). The solid squares added to the figure represent the individual thermodynamic profiles from neomycin-duplex hybrid and higher order structures studied in this paper. Their grouping and placement within the groove binder profile is consistent with neomycin’s known major groove binding mode. Figure 27 extrapolates this thermodynamic comparison by applying the plot to all neomycin-nucleic acid structures studied herein at pH 5.5. Analysis indicates that a structural trend is evident with the emergence of two distinct groups; A-form (red) groove binders and B-form (blue) groove binders, Figure 28.
Figure 27.
Reproduction of the compensation plot for DNA-ligand binding plotted as a function of ΔH versus -TΔS Chaires (112). The open circles represent major groove duplex binders (112). The closed circles represent intercalators (112). The three colored squares represent neomycin-nucleic acid duplex interactions; poly(dA)•poly(rU) (green), poly(rA)•poly(dT) (blue), and d(A2G15C15T2)2 (red) at pH 5.5 and 25 °C.
Figure 28.
Compensation plot for neomycin-nucleic acid binding interactions plotted as a function of ΔH versus -TΔS at pH 5.5 and 25 °C.
Since the discovery of aminoglycosides as RNA binders three decades ago, their nucleic acid targets have grown to include multi-stranded DNA structures such as triplexes and quadruplexes. This study investigates a variety of nucleic acid structures to evaluate neomycin’s binding properties and extract thermodynamic parameters of binding. Results obtained from this study suggest that neomycin prefers to bind A-like nucleic acid structures, gradually becoming less favorable as nucleic acid structures transition to the B-form. This report, the first involving a nucleic acid screen by neomycin from a thermodynamic perspective, can function as a database for comparing modified aminoglycoside ligands.
A different perspective on the results obtained from this study also comes from our developing understanding of nucleic acid recognition. As is becoming increasingly evident from studies of protein-DNA recognition, shape readout of DNA in addition to direct readout mechanisms is extremely important (113-116). Small molecule based approaches to nucleic acid recognition should therefore include approaches that use nucleic acid shape readout with the ability to detect local variations in DNA shape and electrostatic potential, as shown here, in addition to existing “direct readout” approaches utilized in the development of small molecule DNA minor groove binding ligands.
Supplementary Material
ACKNOWLEDGEMENT
We thank Professor Fenfei Leng (Florida International University) for providing us the software to fit thermal denaturation profiles using Mcghee’s model.
ABBREVIATIONS
- ITC
isothermal titration calorimetry
- DSC
differential scanning calorimetry
- FID
Fluorescent Intercalator Displacement
- MOPS
3-[N-Morpholino] propanesulfonic acid
- BPES
buffer, 6 mM Na2HPO4, 2 mM NaH2PO4, 1 mM Na2EDTA, pH 7.0
- HS
Hoogsteen
- WC
Watson-Crick
- W-H
Watson-Hoogsteen
Footnotes
SUPPORTING INFORMATION AVAILABLE UV and DSC melting profiles of all nucleic acid structures. CD titration curves of neomycin with all structures. ITC excess-site titration curves at various temperatures. Table of all thermodynamic parameters used in calculating the binding constants with ΔTm method. FID Plots . Computational models with Autodock Vina 1.0. This material is available free of charge via the Internet at http://pubs.acs.org.
We thank the National Science Foundation (CHE/MCB-0134972) and National Institutes of Health (R15CA125724) for financial support.
REFERENCES
- 1.Arya DP. Aminoglycoside Antibiotics: From Chemical Biology to Drug Discovery. Wiley-Interscience; Hoboken, NJ: 2007. [Google Scholar]
- 2.Fourmy D, Recht MI, Blanchard SC, Puglisi JD. Structure of the A Site of Escherichia Coli 16S Ribosomal RNA Complexed with an Aminoglycoside Antibiotic. Science. 1996;274:1367–1371. doi: 10.1126/science.274.5291.1367. [DOI] [PubMed] [Google Scholar]
- 3.Carter AP, Clemons WM, Brodersen DE, Morgan-Warren RJ, Wimberly BT, Ramakrishnan V. Functional Insights from the Structure of the 30S Ribosomal Subunit and its Interactions with Antibiotics. Nature. 2000;407:340–348. doi: 10.1038/35030019. [DOI] [PubMed] [Google Scholar]
- 4.Vicens Q, Westhof E. Molecular Recognition of Aminoglycoside Antibiotics by Ribosomal RNA and Resistance Enzymes: An Analysis of X-Ray Crystal Structures. Biopolymers. 2003;70:42–57. doi: 10.1002/bip.10414. [DOI] [PubMed] [Google Scholar]
- 5.Kumar S, Xue L, Arya DP. Neomycin-Neomycin Dimer: An all-Carbohydrate Scaffold with High Affinity for AT-Rich DNA Duplexes. J. Am. Chem. Soc. 2011;133:7361–7375. doi: 10.1021/ja108118v. [DOI] [PMC free article] [PubMed] [Google Scholar]
- 6.Xi H, Kumar S, Dosen-Micovic L, Arya DP. Calorimetric and Spectroscopic Studies of Aminoglycoside Binding to AT-Rich DNA Triple Helices. Biochimie. 2010;92:514–529. doi: 10.1016/j.biochi.2010.02.004. [DOI] [PMC free article] [PubMed] [Google Scholar]
- 7.Kaul M, Pilch DS. Thermodynamics of Aminoglycoside-rRNA Recognition: The Binding of Neomycin-Class Aminoglycosides to the A Site of 16S rRNA. Biochemistry. 2002;41:7695–7706. doi: 10.1021/bi020130f. [DOI] [PubMed] [Google Scholar]
- 8.Fourmy D, Recht MI, Puglisi JD. Binding of Neomycin-Class Aminoglycoside Antibiotics to the A-Site of 16 S rRNA. J. Mol. Biol. 1998;277:347–362. doi: 10.1006/jmbi.1997.1552. [DOI] [PubMed] [Google Scholar]
- 9.Willis B, Arya DP. An Expanding View of Aminoglycoside-Nucleic Acid Recognition. Adv. Carbohydr. Chem. Biochem. 2006;60:251–302. doi: 10.1016/S0065-2318(06)60006-1. [DOI] [PubMed] [Google Scholar]
- 10.Arya DP. Aminoglycoside-Nucleic Acid Interactions: The Case for Neomycin. Top. Curr. Chem. 2005;253:149–178. [Google Scholar]
- 11.Marky LA, Breslauer KJ. Origins of Netropsin Binding Affinity and Specificity: Correlations of Thermodynamic and Structural Data. Proc. Natl. Acad. Sci. U. S. A. 1987;84:4359–4363. doi: 10.1073/pnas.84.13.4359. [DOI] [PMC free article] [PubMed] [Google Scholar]
- 12.Marky LA, Curry J, Breslauer KJ. Netropsin Binding to Polyd(AT) X Polyd(AT) and to polydA X polydT: A Comparative Thermodynamic Study. Prog. Clin. Biol. Res. 1985;172B:155–173. [PubMed] [Google Scholar]
- 13.Arya DP, Coffee RL., Jr. DNA Triple Helix Stabilization by Aminoglycoside Antibiotics. Bioorg. Med. Chem. Lett. 2000;10:1897–1899. doi: 10.1016/s0960-894x(00)00372-3. [DOI] [PubMed] [Google Scholar]
- 14.Mirkin SM, Lyamichev VI, Drushlyak KN, Dobrynin VN, Filippov SA, Frank-Kamenetskii M. DNA H Form Reuires a Homopurine-Homopyrimidine Mirror Repeat. Nature. 1987;330:495–497. doi: 10.1038/330495a0. [DOI] [PubMed] [Google Scholar]
- 15.Wang G, Seidman MM, Glazer PM. Mutagenesis in Mammalian Cells Induced by Triple Helix Formation and Transcription-Coupled Repair. Science. 1996;271:802–805. doi: 10.1126/science.271.5250.802. [DOI] [PubMed] [Google Scholar]
- 16.Chen X, Ramakrishnan B, Rao ST, Sundaralingam M. Binding of Two Distamycin A Molecules in the Minor Groove of an Alternating B-DNA Duplex. Nat. Struct. Biol. 1994;1:169–175. doi: 10.1038/nsb0394-169. [DOI] [PubMed] [Google Scholar]
- 17.Perry PJ, Reszka AP, Wood AA, Read MA, Gowan SM, Dosanjh HS, Trent JO, Jenkins TC, Kelland LR, Neidle S. Human Telomerase Inhibition by Regioisomeric Disubstituted Amidoanthracene-9,10-Diones. J. Med. Chem. 1998;41:4873–4884. doi: 10.1021/jm981067o. [DOI] [PubMed] [Google Scholar]
- 18.Sun D, Thompson B, Cathers BE, Salazar M, Kerwin SM, Trent JO, Jenkins TC, Neidle S, Hurley LH. Inhibition of Human Telomerase by a G-Quadruplex-Interactive Compound. J. Med. Chem. 1997;40:2113–2116. doi: 10.1021/jm970199z. [DOI] [PubMed] [Google Scholar]
- 19.Izbicka E, Wheelhouse RT, Raymond E, Davidson KK, Lawrence RA, Sun D, Windle BE, Hurley LH, Von Hoff DD. Effects of Cationic Porphyrins as G-Quadruplex Interactive Agents in Human Tumor Cells. Cancer Res. 1999;59:639–644. [PubMed] [Google Scholar]
- 20.Barbieri CM, Li TK, Guo S, Wang G, Shallop AJ, Pan W, Yang G, Gaffney BL, Jones RA, Pilch DS. Aminoglycoside Complexation with a DNA.RNA Hybrid Duplex: The Thermodynamics of Recognition and Inhibition of RNA Processing Enzymes. J. Am. Chem. Soc. 2003;125:6469–6477. doi: 10.1021/ja021371d. [DOI] [PubMed] [Google Scholar]
- 21.Arya DP, Lane Coffee R, J., Willis B, Abramovitch AI. Aminoglycosides-Nucleic Acid Interactions: Remarkable Stabilization of DNA and RNA Triple Helices by Neomycin. J. Am. Chem. Soc. 2001;123:5385–5395. doi: 10.1021/ja003052x. [DOI] [PubMed] [Google Scholar]
- 22.Arya DP, Coffee RL, Charles I. Neomycin-Induced Hybrid Triplex Formation. J. Am. Chem. Soc. 2001;123:11093–11094. doi: 10.1021/ja016481j. [DOI] [PubMed] [Google Scholar]
- 23.Xue L, Xi H, Kumar S, Gray D, Davis E, Hamilton P, Skriba M, Arya DP. Probing the Recognition Surface of a DNA Triplex: Binding Studies with Intercalator-Neomycin Conjugates. Biochemistry. 2010;49:5540–5552. doi: 10.1021/bi100071j. [DOI] [PMC free article] [PubMed] [Google Scholar]
- 24.Ranjan N, Andreasen KF, Kumar S, Hyde-Volpe D, Arya DP. Aminoglycoside Binding to Oxytricha Nova Telomeric DNA. Biochemistry (N. Y.) 2010;49:9891–9903. doi: 10.1021/bi101517e. [DOI] [PMC free article] [PubMed] [Google Scholar]
- 25.Arya DP, Micovic L, Charles I, Coffee RL, Jr., Willis B, Xue L. Neomycin Binding to Watson-Hoogsteen (W-H) DNA Triplex Groove: A Model. J. Am. Chem. Soc. 2003;125:3733–3744. doi: 10.1021/ja027765m. [DOI] [PubMed] [Google Scholar]
- 26.Jin E, Katritch V, Olson WK, Kharatisvili M, Abagyan R, Pilch DS. Aminoglycoside Binding in the Major Groove of Duplex RNA: The Thermodynamic and Electrostatic Forces that Govern Recognition. J. Mol. Biol. 2000;298:95–110. doi: 10.1006/jmbi.2000.3639. [DOI] [PubMed] [Google Scholar]
- 27.Arya DP, Xue L, Willis B. Aminoglycoside (Neomycin) Preference is for A-Form Nucleic Acids, Not just RNA: Results from a Competition Dialysis Study. J. Am. Chem. Soc. 2003;125:10148–10149. doi: 10.1021/ja035117c. [DOI] [PubMed] [Google Scholar]
- 28.Charles I, Xue L, Arya DP. Synthesis of Aminoglycoside-DNA Conjugates. Bioorg. Med. Chem. Lett. 2002;12:1259–1262. doi: 10.1016/s0960-894x(02)00157-9. [DOI] [PubMed] [Google Scholar]
- 29.Arya DP, Coffee RL, J., Xue L. From Triplex to B-Form Duplex Stabilization: Reversal of Target Selectivity by Aminoglycoside Dimers. Bioorg. Med. Chem. Lett. 2004;14:4643–4646. doi: 10.1016/j.bmcl.2004.07.002. [DOI] [PubMed] [Google Scholar]
- 30.Shaw NN, Xi H, Arya DP. Molecular Recognition of a DNA:RNA Hybrid: Sub-Nanomolar Binding by a Neomycin-Methidium Conjugate. Bioorg. Med. Chem. Lett. 2008;18:4142–4145. doi: 10.1016/j.bmcl.2008.05.090. [DOI] [PubMed] [Google Scholar]
- 31.Zhou J, Wang G, Zhang LH, Ye XS. Modifications of Aminoglycoside AntibioticsTargeting RNA. Med. Res. Rev. 2006;27:279–316. doi: 10.1002/med.20085. [DOI] [PubMed] [Google Scholar]
- 32.Quader S, Boyd SE, Jenkins ID, Houston TA. Multisite Modification of Neomycin B: Combined Mitsunobu and Click Chemistry Approach. J. Org. Chem. 2007;72:1962–1979. doi: 10.1021/jo0620967. [DOI] [PubMed] [Google Scholar]
- 33.Arya DP, Willis B. Reaching into the Major Groove of B-DNA: Synthesis and Nucleic Acid Binding of a Neomycin-Hoechst 33258 Conjugate. J. Am. Chem. Soc. 2003;125:12398–12399. doi: 10.1021/ja036742k. [DOI] [PubMed] [Google Scholar]
- 34.Arya DP, Xue L, Tennant P. Combining the Best in Triplex Recognition: Synthesis and Nucleic Acid Binding of a BQQ-Neomycin Conjugate. J. Am. Chem. Soc. 2003;125:8070–8071. doi: 10.1021/ja034241t. [DOI] [PubMed] [Google Scholar]
- 35.McGhee JD. Theoretical Calculations of the Helix-Coil Transition of DNA in the Presence of Large, Cooperatively Binding Ligands. Biopolymers. 1976;15:1345–1375. doi: 10.1002/bip.1976.360150710. [DOI] [PubMed] [Google Scholar]
- 36.Doyle ML, Brigham-Burke M, Blackburn MN, Brooks IS, Smith TM, Newman R, Reff M, Stafford WF, 3rd, Sweet RW, Truneh A, Hensley P, O’Shannessy DJ. Measurement of Protein Interaction Bioenergetics: Application to Structural Variants of Anti-sCD4 Antibody. Meth. Enzymol. 2000;323:207–230. doi: 10.1016/s0076-6879(00)23368-5. [DOI] [PubMed] [Google Scholar]
- 37.Trott O, Olson AJ. AutoDock Vina: Improving the Speed and Accuracy of Docking with a New Scoring Function, Efficient Optimization, and Multithreading. J. Comput. Chem. 2010;31:455–461. doi: 10.1002/jcc.21334. [DOI] [PMC free article] [PubMed] [Google Scholar]
- 38.Pedretti A, Villa L, Vistoli G. VEGA-an Open Platform to Develop Chemo-Bio-Informatics Applications, using Plug-in Architecture and Script Programming. J. Comput. Aided Mol. Des. 2004;18:167–173. doi: 10.1023/b:jcam.0000035186.90683.f2. [DOI] [PubMed] [Google Scholar]
- 39.Sanner MF. Python: A Programming Language for Software Integration and Development. J. Mol. Graph. Model. 1999;17:57–61. [PubMed] [Google Scholar]
- 40.Boger DL, Fink BE, Brunette SR, Tse WC, Hedrick MP. A Simple, High-Resolution Method for Establishing DNA Binding Affinity and Sequence Selectivity. J. Am. Chem. Soc. 2001;123:5878–5891. doi: 10.1021/ja010041a. [DOI] [PubMed] [Google Scholar]
- 41.Ren J, Chaires J. Sequence and Structural Selectivity of Nucleic Acid Binding Ligands. Biochemistry (N. Y.) 1999;38:16067–16075. doi: 10.1021/bi992070s. [DOI] [PubMed] [Google Scholar]
- 42.Baruah H, Bierbach U. Unusual Intercalation of acridin-9-ylthiourea into the 5′-GA/TC DNA Base Step from the Minor Groove: Implications for the Covalent DNA Adduct Profile of a Novel platinum–intercalator Conjugate. Nucleic Acids Research. 2003;31:4138–4146. doi: 10.1093/nar/gkg465. [DOI] [PMC free article] [PubMed] [Google Scholar]
- 43.Sanger W. In: Principles of Nucleic Acid Structure. Cantor CR, editor. Springer Verlag; 1983. [Google Scholar]
- 44.Zimmerman SB, Pheiffer BH. A RNA.DNA Hybrid that can Adopt Two Conformations: An x-Ray Diffraction Study of Poly(rA).Poly(dT) in Concentrated Solution Or in Fibers. Proc. Natl. Acad. Sci. USA. 1981;78:78–82. doi: 10.1073/pnas.78.1.78. [DOI] [PMC free article] [PubMed] [Google Scholar]
- 45.Stefl R, Trantirek L, Vorlickova M, Koca J, Sklenar V, Kypr J. A-Like Guanine-Guanine Stacking in the Aqueous DNA Duplex of d(GGGGCCCC) J. Mol. Biol. 2001;307:513–524. doi: 10.1006/jmbi.2001.4484. [DOI] [PubMed] [Google Scholar]
- 46.Kypr J, Fialova M, Chladkova J, Tumova M, Vorlickova M. Conserved Guanine-Guanine Stacking in Tetraplex and Duplex DNA. Eur. Biophys. J. 2001;30:555–558. doi: 10.1007/s002490100174. [DOI] [PubMed] [Google Scholar]
- 47.Xi H, Gray D, Kumar S, Arya DP. Molecular Recognition of Single-Stranded RNA: Neomycin Binding to Poly(A) FEBS Lett. 2009;583:2269–2275. doi: 10.1016/j.febslet.2009.06.007. [DOI] [PubMed] [Google Scholar]
- 48.Yadav RC, Kumar GS, Bhadra K, Giri P, Sinha R, Pal S, Maiti M. Berberine, a Strong Polyriboadenylic Acid Binding Plant Alkaloid: Spectroscopic, Viscometric, and Thermodynamic Study. Bioorg. Med. Chem. 2005;13:165–174. doi: 10.1016/j.bmc.2004.09.045. [DOI] [PubMed] [Google Scholar]
- 49.Giri P, Hossain M, Kumar GS. Molecular Aspects on the Specific Interaction of Cytotoxic Plant Alkaloid Palmatine to Poly(A) Int. J. Biol. Macromol. 2006 doi: 10.1016/j.ijbiomac.2006.03.026. [DOI] [PubMed] [Google Scholar]
- 50.Feifei Xing GS, Jinsong Ren Jonathan B., Chaires Xiaogang Qu. Molecular Recognition of Nucleic Acids: Coralyne Binds Strongly to Poly(A) FEBS Lett. 2005;579:5035–5039. doi: 10.1016/j.febslet.2005.07.091. [DOI] [PubMed] [Google Scholar]
- 51.Kankia BI. Mg2+-Induced Triplex Formation of an Equimolar Mixture of Poly(rA) and Poly(rU) Nucleic Acids Res. 2003;31:5101–5107. doi: 10.1093/nar/gkg698. [DOI] [PMC free article] [PubMed] [Google Scholar]
- 52.Saenger W. In: Principle of Nucleic Acid Structure. Cantor CR, editor. Springer-Verlag; New York: 1984. p. 311. [Google Scholar]
- 53.Rabczenko A, Shugar D. Studies on the Conformation of Nucleosides, Dinucleoside Monophosphates and Homopolynucleotides Containing Uracil Or Thymine Base Residues, and Ribose, Deoxyribose Or 2′-O-Methylribose. Acta Biochim. Pol. 1971;18:387–402. [PubMed] [Google Scholar]
- 54.Zimmerman SB. Letter to the Editor: The Polyuridylic Acid Complex with Polyamines: An x-Ray Fiber Diffraction Observation. J. Mol. Biol. 1976;101:563–565. doi: 10.1016/0022-2836(76)90245-x. [DOI] [PubMed] [Google Scholar]
- 55.Langridge R. Nucleic Acids and Polynucleotides. J. Cell. Physiol. 1969;74(Suppl 1):1–20. doi: 10.1002/jcp.1040740403. [DOI] [PubMed] [Google Scholar]
- 56.Bram S. Polynucleotide Polymorphism in Solution. Nature New Biol. 1971;233:161–164. doi: 10.1038/newbio233161a0. [DOI] [PubMed] [Google Scholar]
- 57.Nishimura Y, Torigoe C, Tsuboi M. Salt Induced B----A Transition of Poly(dG).Poly(dC) and the Stabilization of A Form by its Methylation. Nucleic Acids Res. 1986;14:2737–2748. doi: 10.1093/nar/14.6.2737. [DOI] [PMC free article] [PubMed] [Google Scholar]
- 58.Johnson D, Morgan AR. Unique Structures Formed by Pyrimidine-Purine DNAs which may be Four-Stranded. Proc. Natl. Acad. Sci. U. S. A. 1978;75:1637–1641. doi: 10.1073/pnas.75.4.1637. [DOI] [PMC free article] [PubMed] [Google Scholar]
- 59.Morgan AR, Wells RD. Specificity of the Three-Stranded Complex Formation between Double-Stranded DNA and Single-Stranded RNA Containing Repeating Nucleotide Sequences. J. Mol. Biol. 1968;37:63–80. doi: 10.1016/0022-2836(68)90073-9. [DOI] [PubMed] [Google Scholar]
- 60.Wells RD, Larson JE, Grant RC, Shortle BE, Cantor CR. Physicochemical Studies on Polydeoxyribonucleotides Containing Defined Repeating Nucleotide Sequences. J. Mol. Biol. 1970;54:465–497. doi: 10.1016/0022-2836(70)90121-x. [DOI] [PubMed] [Google Scholar]
- 61.Robinson H, Wang AHJ. Neomycin, Spermine and Hexaamminecobalt(III) Share Common Structural Motifs in Converting B- to A-DNA. Nucleic Acids Res. 1996;24:676–682. doi: 10.1093/nar/24.4.676. [DOI] [PMC free article] [PubMed] [Google Scholar]
- 62.Pohl FM, Jovin TM. Salt-Induced Co-Operative Conformational Change of a Synthetic DNA: Equilibrium and Kinetic Studies with Poly (dG-dC) J. Mol. Biol. 1972;67:375–396. doi: 10.1016/0022-2836(72)90457-3. [DOI] [PubMed] [Google Scholar]
- 63.Zhong WX, Gulotta M, Goss DJ, Diem M. DNA Solution Conformation Via Infrared Circular Dichroism: Experimental and Theoretical Results for B-Family Polymers. Biochemistry (N. Y. ) 1990;29:7485–7491. doi: 10.1021/bi00484a018. [DOI] [PubMed] [Google Scholar]
- 64.Gulotta M, Goss DJ, Diem M. IR Vibrational CD in Model Deoxyoligonucleotides: Observation of the B-Z Phase Transition and Extended Coupled Oscillator Intensity Calculations. Biopolymers. 1989;28:2047–2058. doi: 10.1002/bip.360281202. [DOI] [PubMed] [Google Scholar]
- 65.Möller A, Nordheim A, Kozlowski SA, Patel DJ, Rich A. Bromination Stabilizes Poly(dG-dC) in the Z-DNA Form Under Low-Salt Conditions. Biochemistry (N. Y. ) 1984;23:54–62. doi: 10.1021/bi00296a009. [DOI] [PubMed] [Google Scholar]
- 66.Thomas TJ, Bloomfield VA, Canellakis ZN. Differential Effects on the B-to-Z Transition of Poly(dG-me5dC) · Poly(dG-me5dC) Produced by N1-and N8-Acetyle Spermidine. Biopolymers. 1985;24:725–729. doi: 10.1002/bip.360240411. [DOI] [PubMed] [Google Scholar]
- 67.Hasan R, Alam MK, Ali R. Polyamine Induced Z-Conformation of Native Calf Thymus DNA. FEBS Lett. 1995;368:27–30. doi: 10.1016/0014-5793(95)00591-v. [DOI] [PubMed] [Google Scholar]
- 68.Nafisia S, Sabouryb AA, Keramata N, Neaultc JF, Tajmir-Riahic H. Stability and Structural Features of DNA Intercalation with Ethidium Bromide, Acridine Orange and Methylene Blue. J. Mol. Struct. 2007;827:35–43. [Google Scholar]
- 69.Hung SH, Yu Q, Gray DM, Ratliff RL. Evidence from CD Spectra that d(Purine).r(Pyrimidine) and r(Purine).d(Pyrimidine) Hybrids are in Different Structural Classes. Nucleic Acids Res. 1994;22:4326–4334. doi: 10.1093/nar/22.20.4326. [DOI] [PMC free article] [PubMed] [Google Scholar]
- 70.Ratmeyer L, Vinayak R, Zhong YY, Zon G, Wilson WD. Sequence Specific Thermodynamic and Structural Properties for DNA.RNA Duplexes. Biochemistry (N. Y. ) 1994;33:5298–5304. doi: 10.1021/bi00183a037. [DOI] [PubMed] [Google Scholar]
- 71.Gyi JI, Lane AN, Conn GL, Brown T. Solution Structures of DNA.RNA Hybrids with Purine-Rich and Pyrimidine-Rich Strands: Comparison with the Homologous DNA and RNA Duplexes. Biochemistry (N. Y. ) 1998;37:73–80. doi: 10.1021/bi9719713. [DOI] [PubMed] [Google Scholar]
- 72.Kaul M, Barbieri CM, Kerrigan JE, Pilch DS. Coupling of Drug Protonation to the Specific Binding of Aminoglycosides to the A Site of 16 S rRNA: Elucidation of the Number of Drug Amino Groups Involved and their Identities. J. Mol. Biol. 2003;326:1373–1387. doi: 10.1016/s0022-2836(02)01452-3. [DOI] [PubMed] [Google Scholar]
- 73.Gutell RR. Collection of Small Subunit (16S- and 16S-Like) Ribosomal RNA Structures: 1994. Nucleic Acids Res. 1994;22:3502–3507. doi: 10.1093/nar/22.17.3502. [DOI] [PMC free article] [PubMed] [Google Scholar]
- 74.Yoshizawa S, Fourmy D, Puglisi JD. Structural Origins of Gentamicin Antibiotic Action. EMBO J. 1998;17:6437–6448. doi: 10.1093/emboj/17.22.6437. [DOI] [PMC free article] [PubMed] [Google Scholar]
- 75.Vicens Q, Westhof E. Crystal Structure of Paromomycin Docked into the Eubacterial Ribosomal Decoding A Site. Structure. 2001;9:647–658. doi: 10.1016/s0969-2126(01)00629-3. [DOI] [PubMed] [Google Scholar]
- 76.Vicens Q, Westhof E. Crystal Structure of a Complex between the Aminoglycoside Tobramycin and an Oligonucleotide Containing the Ribosomal Decoding A Site. Chem. Biol. 2002;9:747–755. doi: 10.1016/s1074-5521(02)00153-9. [DOI] [PubMed] [Google Scholar]
- 77.Ogle JM, Brodersen DE, Clemons WM, Jr., Tarry MJ, Carter AP, Ramakrishnan V. Recognition of Cognate Transfer RNA by the 30s Ribosomal Subunit. Science. 2001;292:897–902. doi: 10.1126/science.1060612. [DOI] [PubMed] [Google Scholar]
- 78.Warner RC. Ultraviolet Spectra of Enzymatically Synthesized Polynucleotides. Fed. Proc. 1956;15:379. [Google Scholar]
- 79.Stevens CL, Felsenfeld G. The Conversion of Two-Stranded Poly(A+U) to Three-Stranded Poly(A+2U) and Poly A by Heat. Biopolymers. 1964;2:293–314. [Google Scholar]
- 80.Warner RC. In: Informational Macromolecules. Vogel HJ, Bryson V, Lampen JO, editors. Academic Press; New York: 1963. p. 146. [DOI] [PubMed] [Google Scholar]
- 81.Fresco JR. In: Informational Macromolecules. Vogel HJ, Bryson V, Lampen JO, editors. Academic Press; New York: 1963. pp. 121–148. [DOI] [PubMed] [Google Scholar]
- 82.Miles HT, Frazier J. Infrared Study of Helix Strandedness in the Poly A-Poly U System. Biochem. Biophys. Res. Commun. 1964;14:21–28. doi: 10.1016/0006-291x(63)90204-3. [DOI] [PubMed] [Google Scholar]
- 83.Blake RD, Fresco JR. Polynucleotides. VII. Spectrophotometric Study of the Kinetics of Formation of the Two-Stranded Helical Complex Resulting from the Interaction of Polyriboadenylate and Polyribouridylate. J. Mol. Biol. 1966;19:145–160. doi: 10.1016/s0022-2836(66)80057-8. [DOI] [PubMed] [Google Scholar]
- 84.Bishop GR, Ren J, Polander BC, Jeanfreau BD, Trent JO, Chaires JB. Energetic Basis of Molecular Recognition in a DNA Aptamer. Biophys. Chem. 2007;126:165–175. doi: 10.1016/j.bpc.2006.07.009. [DOI] [PubMed] [Google Scholar]
- 85.Dadarlat VM, Saxena VK. Stability of Triple-Helical Poly(dT)-Poly(dA)-Poly(dT) DNA with Counterions. Biophys. J. 1998;75:70–91. doi: 10.1016/S0006-3495(98)77496-X. [DOI] [PMC free article] [PubMed] [Google Scholar]
- 86.Macaya R, Wang E, Schultze P, Sklenar V, Feigon J. Proton Nuclear Magnetic Resonance Assignments and Structural Characterization of an Intramolecular DNA Triplex. J. Mol. Biol. 1992;225:755–773. doi: 10.1016/0022-2836(92)90399-5. [DOI] [PubMed] [Google Scholar]
- 87.Duca M, Vekhoff P, Oussedik K, Halby L, Arimondo PB. The Triple Helix: 50 Years Later, the Outcome. Nucleic Acids Res. 2008;36:5123–5138. doi: 10.1093/nar/gkn493. [DOI] [PMC free article] [PubMed] [Google Scholar]
- 88.Das S, Kumar GS, Ray A, Maiti M. Spectroscopic and Thermodynamic Studies on the Binding of Sanguinarine and Berberine to Triple and Double Helical DNA and RNA Structures. J. Biomol. Struct. Dyn. 2003;20:703–714. doi: 10.1080/07391102.2003.10506887. [DOI] [PubMed] [Google Scholar]
- 89.Pilch DS, Kirolos MA, Breslauer KJ. Berenil Binding to Higher Ordered Nucleic Acid Structures: Complexation with a DNA and RNA Triple Helix. Biochemistry. 1995;34:16107–16124. doi: 10.1021/bi00049a026. [DOI] [PubMed] [Google Scholar]
- 90.Saenger W. In: Principles of Nucleic Acid Structure. Cantor CR, editor. Springer-Verlag; New York: 1984. p. 311. [Google Scholar]
- 91.Monchaud D, Teulade Fichou MP. A Hitchhiker’s Guide to G-Quadruplex Ligands. Org. Biomol. Chem. 2008;6:627–36. doi: 10.1039/b714772b. [DOI] [PubMed] [Google Scholar]
- 92.Haq I, Trent JO, Chowdhry BZ, Jenkins TC. Intercalative G-Tetraplex Stabilization of Telomeric DNA by a Cationic Porphyrin. J. Am. Chem. Soc. 1999;121:1768–1779. [Google Scholar]
- 93.Freyer MW, Buscaglia R, Kaplan K, Cashman D, Hurley LH, Lewis EA. Biophysical Studies of the c-MYC NHE III1 Promoter: Model Quadruplex Interactions with a Cationic Porphyrin. Biophys. J. 2007;92:2007–2015. doi: 10.1529/biophysj.106.097246. [DOI] [PMC free article] [PubMed] [Google Scholar]
- 94.Cosconati S, Marinelli L, Trotta R, Virno A, Mayol L, Novellino E, Olson AJ, Randazzo A. Tandem Application of Virtual Screening and NMR Experiments in the Discovery of Brand New DNA Quadruplex Groove Binders. J. Am. Chem. Soc. 2009;131:16336–16337. doi: 10.1021/ja9063662. [DOI] [PubMed] [Google Scholar]
- 95.Smith FW, Feigon J. Quadruplex Structure of Oxytricha Telomeric DNA Oligonucleotides. Nature. 1992;356:164–168. doi: 10.1038/356164a0. [DOI] [PubMed] [Google Scholar]
- 96.Schultze P, Hud N, Smith F, Feigon J. The Effect of Sodium, Potassium and Ammonium Ions on the Conformation of the Dimeric Quadruplex Formed by the Oxytricha Nova Telomere Repeat Oligonucleotide d(G(4)T(4)G(4)) Nucl. Acids Res. 1999;27:3018–3028. doi: 10.1093/nar/27.15.3018. [DOI] [PMC free article] [PubMed] [Google Scholar]
- 97.Balagurumoorthy P, Brahmachari SK, Mohanty D, Bansal M, Sasisekharan V. Hairpin and Parallel Quartet Structures for Telomeric Sequences. Nucleic Acids Res. 1992;20:4061–4067. doi: 10.1093/nar/20.15.4061. [DOI] [PMC free article] [PubMed] [Google Scholar]
- 98.Wang Y, Patel DJ. Solution Structure of the Human Telomeric Repeat d[AG3(T2AG3)3] G-Tetraplex. Structure. 1993;1:263–282. doi: 10.1016/0969-2126(93)90015-9. [DOI] [PubMed] [Google Scholar]
- 99.Leroy JL, Gueron M, Mergny JL, Helene C. Intramolecular Folding of a Fragment of the Cytosine-Rich Strand of Telomeric DNA into an I-Motif. Nucleic Acids Res. 1994;22:1600–1606. doi: 10.1093/nar/22.9.1600. [DOI] [PMC free article] [PubMed] [Google Scholar]
- 100.Manzini G, Yathindra N, Xodo LE. Evidence for Intramolecularly Folded i-DNA Structures in Biologically Relevant CCC-Repeat Sequences. Nucleic Acids Res. 1994;22:4634–4640. doi: 10.1093/nar/22.22.4634. [DOI] [PMC free article] [PubMed] [Google Scholar]
- 101.Spolar RS, M. T. R., Jr. Coupling of Local Folding to Site-Specific Binding of Proteins to DNA. Science. 1994;263:777–784. doi: 10.1126/science.8303294. [DOI] [PubMed] [Google Scholar]
- 102.Ha JH, Spolar RS, M. T. R., Jr. Role of the Hydrophobic Effect in Stability of Site-Specific Protein-DNA Complexes. J. Mol. Biol. 1989;209:801–816. doi: 10.1016/0022-2836(89)90608-6. [DOI] [PubMed] [Google Scholar]
- 103.Haq I. Thermodyanmics of Drug-DNA Interactuibs. Arch. Biochem. Biophys. 2002;403:1–15. doi: 10.1016/S0003-9861(02)00202-3. [DOI] [PubMed] [Google Scholar]
- 104.Spolar RS, Livingstone JR, M. T. R., Jr. Use of Liquid Hydrocarbon and Amide Transfer Data to Estimate Contributions to Thermodynamic Functions of Protein Folding from the Removal of Nonpolar and Polar Surface from Water. Biochemistry (N. Y. ) 1992;31:3947–3955. doi: 10.1021/bi00131a009. [DOI] [PubMed] [Google Scholar]
- 105.Bergqvist S, Williams MA, O’Brien R, Ladbury JE. Heat Capacity Effects of Water Molecules and Ions at a Protein-DNA Interface. J. Mol. Biol. 2004;336:829–842. doi: 10.1016/j.jmb.2003.12.061. [DOI] [PubMed] [Google Scholar]
- 106.Ferrari ME, Lohman TM. Apparent Heat Capacity Change Accompanying a Nonspecific Protein-DNA Interaction. Escherichia Coli SSB Tetramer Binding to Oligodeoxyadenylates. Biochemistry (N. Y. ) 1994;33:12896–12910. doi: 10.1021/bi00209a022. [DOI] [PubMed] [Google Scholar]
- 107.Peters WB, Edmondson SP, Shriver JW. Thermodynamics of DNA Binding and Distortion by the Hyperthermophile Chromatin Protein Sac7d. J. Mol. Biol. 2004;343:339–360. doi: 10.1016/j.jmb.2004.08.042. [DOI] [PubMed] [Google Scholar]
- 108.Barbieri CM, Pilch DS. Complete Thermodynamic Characterization of the Multiple Protonation Equilibria of the Aminoglycoside Antibiotic Paromomycin: A Calorimetric and Natural Abundance 15N NMR Study. Biophys. J. 2006;90:1338–1349. doi: 10.1529/biophysj.105.075028. [DOI] [PMC free article] [PubMed] [Google Scholar]
- 109.Leng F, Chaires JB, Waring MJ. Energetics of Echinomycin Binding to DNA. Nucleic Acids Research. 2003;31:6191–6197. doi: 10.1093/nar/gkg826. [DOI] [PMC free article] [PubMed] [Google Scholar]
- 110.Ragazzon PA, Garbett NC, Chaires JB. Competition Dialysis: A Method for the Study of Structural Selective Nucleic Acid Binding. Methods. 2007;42:173–182. doi: 10.1016/j.ymeth.2006.09.010. [DOI] [PubMed] [Google Scholar]
- 111.Chaires JB. Competition Dialysis: An Assay to Measure the Structural Selectivity of Drug-Nucleic Acid Interactions. Current Medicinal Chemistry: Anti-Cancer Agents. 2005;5:339–352. doi: 10.2174/1568011054222292. [DOI] [PubMed] [Google Scholar]
- 112.Chaires JB. A Thermodynamic Signature for Drug-DNA Binding Mode. Arch. Biochem. Biophys. 2006;453:26–31. doi: 10.1016/j.abb.2006.03.027. [DOI] [PubMed] [Google Scholar]
- 113.Rohs R, Jin X, West SM, Joshi R, Honig B, Mann RS. Origins of Specificity in Protein-DNA Recognition. Annu. Rev. Biochem. 2010;79:233–269. doi: 10.1146/annurev-biochem-060408-091030. [DOI] [PMC free article] [PubMed] [Google Scholar]
- 114.Rohs R, West SM, Sosinsky A, Liu P, Mann RS, Honig B. The Role of DNA Shape in Protein-DNA Recognition. Nature. 2009;461:1248–1253. doi: 10.1038/nature08473. [DOI] [PMC free article] [PubMed] [Google Scholar]
- 115.Parker SC, Tullius TD. DNA Shape, Genetic Codes, and Evolution. Curr. Opin. Struct. Biol. 2011;21:342–347. doi: 10.1016/j.sbi.2011.03.002. [DOI] [PMC free article] [PubMed] [Google Scholar]
- 116.Parker SC, Hansen L, Abaan HO, Tullius TD, Margulies EH. Local DNA Topography Correlates with Functional Noncoding Regions of the Human Genome. Science. 2009;324:389–392. doi: 10.1126/science.1169050. [DOI] [PMC free article] [PubMed] [Google Scholar]
Associated Data
This section collects any data citations, data availability statements, or supplementary materials included in this article.


