

Abstract
Consumer-directed health plans (CDHPs) hold the promise of reining in health spending by giving consumers a greater stake in health care purchasing, yet little is known about employers’ experience with these products. In examining the characteristics of those selecting a CDHP offered by one large employer, we found stronger evidence of selection than has been identified in prior research. Our findings suggest that in the context of plan choice, CDHPs may offer little opportunity to greatly lower employers’ cost burden, and they highlight concerns about the potential for risk segmentation and the value of conferring preferential tax treatment to CDHPs.
Consumer-directed health plans (CDHPs) are the latest effort to increase the efficiency of the health care system and reduce health care spending. Proponents view them as a means of increasing the value of medical care by encouraging consumers to become more prudent purchasers. Because CDHPs have only recently been adopted by employers, little is known about their effects. Understanding whether CDHPs disproportionately attract healthier enrollees is important in estimating their likely effects on spending growth, assessing their potential for risk segmentation, and judging the value of conferring preferential tax status.
CDHP products include both health reimbursement arrangements (HRAs) and health savings accounts (HSAs). Both establish tax-exempt savings accounts that consumers can use to pay out-of-pocket medical costs and are typically combined with a high-deductible health insurance plan. Both products may include decision-support tools to aid consumers in making informed health care choices. HRAs are funded solely by employers, and unspent fund balances may be carried forward from year to year but revert to the employer if an enrollee terminates employment. HSA-qualified accounts, established under the Medicare Prescription Drug, Improvement, and Modernization Act (MMA) of 2003, are portable; they must be combined with a high deductible; and both employers and employees can contribute. HSA balances can be used, tax free, to fund future health expenses. After the insured person reaches age sixty-five, these funds may even be used to purchase non-medical items. To date, only about 5 percent of covered workers have enrolled in CDHPs, but these plans are not equally available: firms with 1,000 or more employees are more likely than smaller firms to offer CDHPs (18 percent versus 10 percent).1 However, more purchasers seem to be considering adopting a CDHP.
Although the literature is limited, prior studies of CDHPs indicate modest favorable selection among early adopters.2 The study most similar to ours examined the experience of Humana Inc. in offering a CDHP to its employees in 2001.3 Although few demographic differences by plan selection were detected, CDHP enrollees had lower prior-year use and spending compared with traditional-plan enrollees. Because most research has been limited to early adopters of CDHPs, we know little about why consumers move into and out of these products.4
In this paper we examine the introduction of an HRA in 2004 by Alcoa, a U.S.-based, global manufacturing company. Alcoa has 50,000 U.S. employees working in twenty-two states. We examined the characteristics of employees selecting the HRA and studied plan switching over time to determine whether those with high spending were more likely than others to switch out of the HRA.
Study Data And Methods
Setting
In response to an annual U.S. health benefit burden of approximately $800 million, Alcoa has attempted to control spending growth while investing in a broad-based approach to improve employees’ health. A central component of its strategy involved the introduction of a new health benefit in January 2004. In prior years, Alcoa offered a preferred provider organization (PPO) benefit to most employees and their dependents. For more than 98 percent of this group, the benefit had no deductible and a $10–$15 copayment for in-network outpatient services (Exhibit 1).
EXHIBIT 1.
In-Network Alcoa Health Insurance Benefits For Enrollees With Family Coverage, 2003–2005
| Pre-2004 benefit design | 2004–2005 benefit design | ||
|---|---|---|---|
| Three PPO options | HRA | Four PPO options | |
| Annual deductible | $0, $0, $2,000 | $3,000 | $0, $500, $1,000, $1,500 |
| Inpatient cost sharing | 90 percent | 90 percent | 90 percent |
| Outpatient cost sharing | $10, $15, $15 per office visit | 90 percent | 90 percent |
| Annual out-of-pocket maximum | $2,000, $5,000, $10,000 | $9,000 | $5,000, $5,500, $7,000, $7,500 |
| HRA annual contribution | None | $1,250 | None |
| Weighted average out-of-pocket premium contributiona | Not available | $475 | $1,803, $1,388, $1,097, $827 |
SOURCES: Alcoa plan benefit design brochures (2003–2005) and other company documents.
NOTES: Benefits summarized are for in-network services (higher cost sharing is required for out-of-network services), and benefits are reported at the family level. Separate benefits are offered to employee-only policyholders. For the health reimbursement arrangement (HRA), individual coverage provides a $750 annual contribution with a $1,500 deductible and a $4,500 out-of-pocket maximum. PPO is preferred provider organization.
In 2004, each business unit adopted one of seven out-of-pocket “premium menus,” each with a different set of out-of-pocket premiums for the five plan options. We calculated weighted average annual employee premium contributions by weighting the employee premium for each plan by the number of employees offered that premium. Note that the effective price of the policy is actually (1–tax) × premium, where tax indicates the employee’s marginal tax rate.
As of 2004, the company began offering a choice of five health plans, including an HRA. At a given plant location, all five options (including the HRA) are offered under a single administrative services only (ASO) contract and use the same provider network. The new benefit options increased consumers’ cost sharing on all but preventive services.5
The HRA plan option establishes an account funded by Alcoa to help enrollees defray deductibles and cost sharing. The firm’s annual contribution to this account is $750 for an individual policy and $1,250 for a family policy. If an enrollee does not use all of the HRA funds in a calendar year, the balance rolls over to the next year to pay for future out-of-pocket expenses, assuming that the enrollee continues to select the HRA option. The HRA option comes with a higher annual deductible ($3,000 family) and a higher out-of-pocket maximum ($9,000 family) than the PPO plans. For families, spending between the $1,250 HRA account balance (in the initial year) and the $3,000 deductible limit constitutes a “doughnut hole” in which 100 percent of medical expenses are paid for out of pocket. HRA enrollees pay 10 percent coinsurance for outpatient care between the deductible limit and the out-of-pocket maximum. The Alcoa HRA differs from CDHPs offered by other employers. For example, Aetna HRA products feature employer account contributions of about $5,000 for families combined with family deductibles ($1,000–$4,000) that are lower than the employer-funded account.6
Data
We used linked employee claims, enrollment, premiums, and employment data to examine employees’ selection into the HRA. Our study population was limited to Alcoa employees continuously enrolled in the plan options in 2003 and 2004 (N = 17,179). The unit of analysis is the employee, although total medical care spending and the presence of a chronic illness are reported at the coverage-unit level (for example, total family spending for family plans).We excluded health maintenance organization (HMO) enrollees (n = 3,723) and hourly employees at certain plants (n = 8,578), because both groups were not covered under the new benefit. Because out-of-pocket premiums are determined at the business unit, we excluded employees who switched units (n = 250). Within business units, management chooses one of seven out-of-pocket “premium menus” for the workforce. For a given menu, out-of-pocket premiums differ by policy type (two-parent family, employee/spouse only, single-parent family, and individual) and plan (HRA and PPOs 2–5). In some cases, management chose a different premium menu for hourly and salaried workers.
Methods
We conducted two analyses to examine initial selection into the HRA in 2004 and plan-switching behavior in 2005. In the first analysis, the dependent variable was a dichotomous outcome indicating whether an employee chose the HRA or one of four PPOs. We combined the four PPO options because 64 percent of PPO enrollees chose the same plan (for family coverage, the deductible is $500 and the out-of-pocket maximum is $5,500).We compared prior-year (2003) characteristics of employees choosing the HRA and PPO options in 2004. Demographic characteristics included age, race, and sex. Employment characteristics included hourly or salaried employment, wage, and policy type. Health information included whether someone in the household had a chronic condition—diabetes, asthma, or congestive heart failure or coronary artery disease (CHF/CAD)—and total medical spending for the household. Claims for the employee, spouse, and dependents were used to identify chronic conditions and total spending.7
Finally, we included enrollees’ out-of-pocket premiums in the model. We calculated premium difference as the additional cost to the enrollee of choosing a PPO (relative to the HRA). Thus, the difference represents how much the enrollee would save by choosing the lower-price HRA compared with a PPO. To account for the tax-deductibility of the out-of-pocket health insurance premium (which lowers the effective price), we multiplied PPO and HRA premiums by 0.70, assuming a 30 percent marginal tax rate.
Analysis
We used logistic regression to estimate the effects of enrollees’ characteristics on plan choice. Because spending among those choosing individual coverage (n = 3,619) and family coverage (n = 13,560) is not directly comparable, we estimated the model stratified by coverage type. We calculated the predicted likelihood of choosing the HRA conditional on the presence of a chronic condition, prior-year spending quartile, and prior-year wage quartiles, controlling for other characteristics.
Second, we used a “switcher” analysis similar to that used by Sean Nicholson and colleagues to examine the characteristics of enrollees who switched plan types in the subsequent year.8 The dependent variable was an enrollee’s total medical spending in 2004. We examined all who chose a PPO in 2004 and compared 2004 medical spending for those who switched to the HRA in 2005 with those who stayed in the PPO in 2005. Likewise, we examined all who chose the HRA in 2004 and compared 2004 medical spending for those who switched to the PPO in 2005 with those who stayed in the HRA in 2005. This holds spending differences due to behavioral changes related to the insurance product constant, allowing us to isolate spending differences attributable to enrollee characteristics.
We categorized enrollees into four mutually exclusive groups: those enrolled in a PPO in 2004 and 2005 (PPO–PPO); switching from a PPO in 2004 to the HRA in 2005 (PPO–HRA); enrolled in the HRA in 2004 and 2005 (HRA–HRA); and switching from the HRA in 2004 to a PPO in 2005 (HRA–PPO).We used ordinary least squares to regress 2004 medical spending on these four variables. This allowed us to test whether, among PPO enrollees in 2004, the HRA attracted those with relatively low medical spending in 2004 (favorable risk selection), and whether, among HRA enrollees in 2004, the PPOs attracted those with relatively high medical spending in 2004 (adverse risk selection). F-tests indicate whether spending differences in 2004 between those switching and those remaining in a plan type were significantly different from zero. Following Nicholson and colleagues, we next estimated the above model including employee characteristics that could be observed by an employer and used to risk-adjust premiums. If the plan-choice-combination variables are significant without adjusting for these characteristics but insignificant after their inclusion in the model, this implies that employers could eliminate incentives to risk-select by adjusting plan payments (either by age and sex alone or by using more complex risk adjustment).
Study Findings
Descriptive characteristics
Exhibit 2 reports unadjusted descriptive statistics for the population of Alcoa employees eligible for the new benefit in 2004 and compares characteristics of workers opting to enroll in a PPO and the HRA. Although both groups were a little over 70 percent male, HRA enrollees were younger and more likely to be white, to be salaried, to have individual coverage, and to have higher incomes in the year prior to enrollment compared with PPO enrollees. Households choosing the HRA were significantly less likely to include someone with diabetes, asthma, or CHF/CAD. Those selecting the HRA had lower mean spending in the prior year ($4,776) compared with those selecting a PPO ($8,680). These averages mask information on the distribution of spending. For example, 50 percent of those in the HRA spent less than $2,682 in 2003. Exhibit 2 also compares enrollment into the HRA in 2005. The share opting for the HRA increased slightly to 15.1 percent, and the characteristics of this group are similar to those of the 2004 group.
EXHIBIT 2.
Unadjusted Characteristics Of Alcoa Employees Selecting PPO And HRA Options, 2004 And 2005
| Characteristic | Full population (N = 17,179) |
Enrollees selecting PPO in 2004 (85.7%) (n = 14,717) |
Enrollees selecting HRA in 2004 (14.3%) (n = 2,462) |
Enrollees selecting HRA in 2005 (15.1%) (n = 2,536) |
|---|---|---|---|---|
| Employee level | ||||
| Age in 2003 (years) | ||||
| 18–35 | 23% | 23% | 26% | 26% |
| 36–50 | 53 | 52 | 56 | 57 |
| 51–63 | 24 | 25 | 18 | 17 |
| Male | 72% | 72% | 71% | 73% |
| Race | ||||
| White | 81% | 80% | 86% | 86% |
| Other | 19 | 20 | 14 | 14 |
| Job type | ||||
| Salaried | 54% | 50% | 74% | 75% |
| Hourly | 46 | 50 | 26 | 25 |
| Insurance | ||||
| Employee-only | 21% | 19% | 31% | 27% |
| Employee and spouse | 20 | 21 | 15 | 17 |
| Single-parent family | 10 | 10 | 7 | 8 |
| Two-parent family | 49 | 50 | 47 | 48 |
| Mean wage in 2003 | $55,772 | $53,851 | $67,257 | $67,322 |
| 1st quartile (<$33,991) | 25% | 27% | 14% | 13% |
| 2nd quartile ($33,991–$45,533) | 25 | 26 | 22 | 21 |
| 3rd quartile ($45,534–$64,033) | 25 | 25 | 26 | 26 |
| 4th quartile (>$64,033) | 25 | 23 | 39 | 40 |
| Family level | ||||
| Chronic condition | ||||
| Diabetes | 6.6% | 7.3% | 2.6% | 2.8% |
| Asthma | 2.7 | 2.9 | 1.3 | 1.6 |
| CHF/CAD | 1.7 | 1.9 | 0.4 | 0.007 |
| Mean spending in 2003 | $ 8,121 | $ 8,680 | $ 4,776 | –a |
| 25th percentile | 1,884 | 2,098 | 1,022 | –a |
| 50th percentile | 4,525 | 4,908 | 2,682 | –a |
| 75th percentile | 9,518 | 10,181 | 5,986 | –a |
| 95th percentile | 26,009 | 27,300 | 15,234 | –a |
SOURCES: Alcoa Inc. employee files and medical claims files (2003–2005).
NOTES: Enrollees selecting a preferred provider organization (PPO) and the health reimbursement arrangement (HRA) in 2004 differed significantly (p ≤ 0.01) across all characteristics except sex in unadjusted comparisons. CHF/CAD is congestive heart failure/coronary artery disease.
Not applicable.
Selecting the HRA
Using logistic regression, we found evidence of selection among enrollees choosing the HRA option in 2004. Among family coverage policyholders, HRA enrollees differed in all employee-level and family-level characteristics compared with PPO enrollees.9 Examining the coefficient on the out-of-pocket premium difference (that is, savings to the enrollee of choosing the HRA rather than a PPO), we found that a 10 percent increase in the marginal premium of the PPO led to a small but significant decrease (1 percent) in the probability of selecting the PPO.
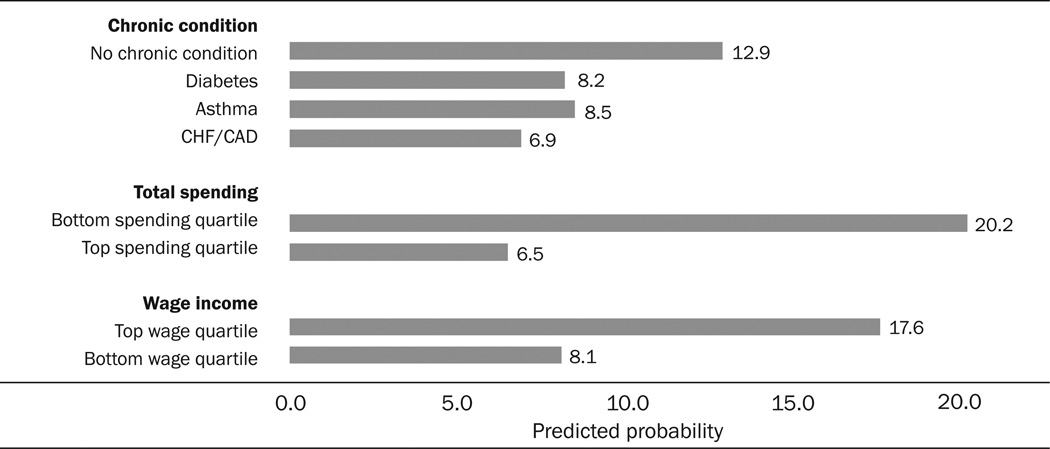
Among those with family coverage, controlling for other characteristics, 8.2 percent of employees with (or having a family member with) diabetes, 8.5 percent with asthma, and 6.9 percent with CHF/CAD were predicted to enroll in the HRA, compared with 12.9 percent of those with none of these chronic conditions (Exhibit 3).
EXHIBIT 3.
Predicted Probabilities Of Those Choosing A Health Reimbursement Arrangement (HRA) In 2004 Conditional On Prior-Year Employee- And Family-Level Characteristics
 |
SOURCE: Alcoa Inc. employee files and medical claims files (2003–2004).
NOTES: The analysis is limited to those with family coverage. Among those with family coverage, unadjusted results indicate that 12.3 percent chose the HRA in 2004. We defined “no chronic condition” as no diagnosis of diabetes, asthma, or congestive heart failure (CHF)/coronary artery disease (CAD) in the family. For employees with family policies, total spending quartiles for 2003 were <$2,824, $2,824–$5,684, $5,685–$10,837, and >$10,837; wage quartiles were <$35,001, $35,001–$47,616, $47,617–$67,401, and >$67,401. Full logistic regression results for the models predicting selection of the HRA option in 2004 for both family and individual policyholders are available in an online supplement, at http:/content.healthaffairs.org/cgi/content/full/27/6/1671/DC1.
Those in the bottom quartile of total spending in the prior year had a 13.7-percentage-point greater likelihood of enrolling in the HRA compared with those in the top spending quartile. Those in the bottom wage quartile were 9.5 percentage points less likely to enroll than those in the top wage quartile.
Plan switching
As shown in Model 1 of Exhibit 4, those choosing a PPO in 2004 but then switching to the HRA in 2005 spent $2,935 less in 2004 than did those remaining in the PPO in 2005—a 29 percent difference. Among 2004 HRA enrollees, those who switched to a PPO in 2005 spent $2,586 more on medical care in 2004 than those that stayed in the HRA in 2005—a 33 percent difference. In Model 2, we adjusted for age and sex; these differences remain similar in magnitude to those in Model 1, which indicates that selection occurred based on unobserved preferences for medical care beyond age and sex. These differences remained when we included additional characteristics that might be used by employers to design a more complex approach to risk adjustment.
EXHIBIT 4.
Risk-Selection Models Predicting Medical Care Spending In 2004
| Model 1a | Model 2b | Model 3c | Model 4d | |||||
|---|---|---|---|---|---|---|---|---|
| Variable | Coeff. | SE | Coeff. | SE | Coeff. | SE | Coeff. | SE |
| PPO in 2004 | ||||||||
| PPO 2004–PPO 2005 (stay) | $10,002 | $ 160 | $11,533 | $ 318 | $7,385 | $ 549 | $5,452 | $ 201 |
| PPO 2004–HRA 2005 (switch) | 7,067*** | 883 | 8,820*** | 933 | $4,813*** | 1,042 | 3,684** | 851 |
| HRA in 2004 | ||||||||
| HRA 2004–HRA 2005 (stay) | 5,135 | 448 | 6,690 | 534 | 2,859 | 728 | 1,896 | 439 |
| HRA 2004–PPO 2005 (switch) | 7,721** | 1,139 | 9,350** | 1,172 | 5,462** | 1,247 | 4,057* | 1,095 |
| Includes potentially observable characteristics? | Model 1 | Model 2 | Model 3 | Model 4 | ||||
| Age, sex only | No | Yes | Yes | Yes | ||||
| Plus wage, job type, race, presence of chronic conditions | No | No | Yes | Yes | ||||
| Plus fuller risk adjustment | No | No | No | Yes | ||||
SOURCES: Alcoa Inc. employee files and medical claims files (2003–2005).
NOTES: Significance levels indicate results from F-tests comparing 2004 expenditure differences between enrollees staying and switching health plans in 2005. N = 13,265 employees. PPO is preferred provider organization. HRA is health reimbursement arrangement. SE is standard error.
Model 1 regresses 2004 medical spending on the four plan-switching variables: PPO–PPO, PPO–HRA, HRA–HRA, and HRA–PPO.
Model 2 regresses 2004 medical spending on the four plan-switching variables as in Model 1, and also includes sex and three age categories (18–35, 36–50, 51–63).
Model 3 regresses 2004 medical spending on the four plan-switching variables, sex, and age as in Model 2, and also includes wage quartiles, job type (hourly versus salaried), race (white versus other), and presence of chronic conditions (diabetes, asthma, congestive heart failure/coronary artery disease).
Model 4 regresses 2004 medical spending on the four plan-switching variables, sex, age, wage, job type, race, presence of chronic conditions as in Model 3, and we also include the Hierarchical Condition Categories (HCC) risk adjustment from the Centers for Medicare and Medicaid Services.
p < 0.10
p < 0.05
p < 0.01
Discussion
Enrollees in Alcoa’s CDHP were younger, higher-wage, more likely to be white, and more likely to be salaried than enrollees in the PPO plans. Prior health care spending and the presence of a chronic condition were predictors of choosing the CDHP. These results provide stronger evidence of selection than has been identified in prior research. Estimates of differences in medical spending for those switching plans indicate that risk adjustment might not be adequate to address selection.
Policy implications
We identify three policy implications from these results. These implications are relevant only for employers offering CDHPs in the context of plan choice.
Potential cost savings
Our finding that in the context of plan choice, CDHPs attract healthier enrollees suggests that these products may be unlikely to greatly lower employers’ health care cost burden. For the employer studied here, the 14 percent of employees choosing the HRA represented only 8 percent of all health care spending in the prior year.
For family policyholders choosing the HRA who expected to use less than $1,250 in a year, there was little incentive to use fewer services since the marginal cost to the enrollee was zero (because of the firm’s annual health account contribution), compared with PPO enrollees, who paid 100 percent of costs before the deductible was met. There would be an incentive to use fewer services if HRA enrollees were interested in building up the balance in their accounts over time. HRA enrollees expecting to spend between $1,250 and the $3,000 deductible (the HRA doughnut hole) will incur marginal costs of 100 percent. HRA enrollees anticipating spending more than $3,000 in annual medical costs will face cost sharing identical to that of PPO enrollees at the margin. Although enrollees will not be able to perfectly anticipate their medical expenses at the beginning of the year, only marginal spending in the HRA doughnut hole constitutes a major opportunity for the firm to slow spending growth. Some low spenders may reduce their health care use if they view dollars in their account as their own. However, this incentive is lower for HRAs than for HSAs, which are portable. Of all family policyholders (both PPO and HRA), only 18 percent had total spending in the doughnut hole in 2003. Thus, even if the firm only offered an HRA option (full replacement), only a small subset would be likely to alter their behavior in such a way that savings would result to the firm. More generally, the bulk of spending is incurred by the small group of seriously ill people who spend more than the deductible.10 A similar calculation led Dahlia Remler and Sherry Glied to suggest that CDHPs may even lead to greater spending growth by decreasing cost sharing for those at the low and high ends of the spending distribution.11
Risk segmentation
Risk selection is a concern when some health plans in a choice-based market attract enrollees with relatively low expected medical spending and plan payments are not adequately risk-adjusted to reflect these risk differences. Optimal risk adjustment would allow employers to set plan payments to eliminate the incentives to risk select. Our results are consistent with those of earlier studies in concluding that risk-adjusting by age and sex would not address risk differences by plan type.12 Unlike prior work by Nicholson and colleagues concerning selection into HMOs, we found that a more complex approach to risk adjustment would still not adequately compensate plans and that incentives to risk-select remain. Jacob Glazer and Tom McGuire note that employers may have better tools than risk adjustment for dealing with plan selection.13 Employers may negotiate payments to plans that reflect the makeup of the risk pool. Another strategy for combating this problem, adopted by Alcoa, is to contract with a single insurer to offer multiple insurance products. However, this has the drawback of eliminating incentives for plans to compete on price, except upon contract renewal.
Tax policy
Higher-income workers’ greater likelihood of choosing a CDHP suggests that the distributional effects of the tax treatment of these plans should be evaluated. An important hallmark of MMA is that HSA funds are tax-free at both contribution and withdrawal for qualified medical expenses. Some financial analysts even recommend using after-tax dollars to pay health care expenses out of pocket to allow HSA funds to grow tax free. Our findings suggest that this subsidy will disproportionately go to wealthier workers—the most likely to choose HSAs. Such workers will also receive a larger benefit from the tax shelter afforded to HSAs, if they are in a higher marginal tax bracket.
Strengths of our approach
Our access to medical claims and personnel data in a large, geographically diverse population allowed us to determine the presence of chronic conditions using diagnostic claims data rather than self-reports. Also, although some studies of selection into CDHPs cannot disentangle preference for a certain insurer from preference due to plan structure (if different carriers are offered), the Alcoa plans all have identical provider panels, which allowed us to isolate differences due to benefit design. Unlike prior studies, we controlled for relative differences in out-of-pocket premiums of the HRA and PPOs. Finally, variation in the types of CDHPs offered in the insurance market makes additional case studies informative. For example, one CDHP that has been studied did not allow enrollees to roll over an unspent account balance to the next year.14 In contrast, the Alcoa HRA allows enrollees to accumulate funds in the account from year to year—an important distinction and more similar to CDHP products now on the market.
Limitations
First, despite Alcoa’s size and geographic diversity, our results are limited to a single firm’s experience with a specific kind of CDHP. The potential for favorable selection will depend not only on the makeup of an employer group but also on the design of the specific CDHP product, alternative plans offered, and the relative pricing of plan choices. A wide variety of CDHPs are available in the market, and design matters in anticipating the likely effects on plan choice.
Second, Alcoa’s experience provides limited insight into whether CDHPs fulfill their promise of making people better consumers of health care. One goal of CDHPs is to increase the use of high-value care and decrease the use of low-value care by increasing consumers’ involvement in decision making. Beyond benefit design, Alcoa did not implement any changes aimed at altering consumers’ decision making (such as releasing provider profiles). In this way, Alcoa appears not to differ from other employers offering these products. In a review of first-generation CDHPs, Meredith Rosenthal and colleagues found that few plans provide consumers with sufficiently detailed comparative information to assess cost and quality trade-offs.15 Communications efforts by employers may affect not only the share of enrollees selecting CDHPs but also which employees (sick or healthy) select CDHPs. Finally, that healthier people choose CDHPs makes quantifying CDHPs’ effects on health outcomes difficult because of the challenge of disentangling differences in outcomes that are due to the CDHP from underlying health differences.
Acknowledgments
Mark Cullen, Martin Slade, and Deron Galusha gratefully acknowledge research support from Alcoa Inc., the John D. and Catherine T. MacArthur Foundation Network on Socioeconomic Status and Health, and the National Institute on Aging (Grant no. R01AG026291). The authors thank Amy Finkelstein for information on Alcoa premiums.
Footnotes
Previous versions of this paper were presented at Academy Health’s Annual Research Meeting in Orlando, Florida, June 2007, and the Association for Public Policy Analysis and Management’s 2007 meeting in Washington, D.C.
Contributor Information
Colleen L. Barry, Email: colleen.barry@yale.edu, Yale University School of Medicine in New Haven, Connecticut.
Mark R. Cullen, Department of Internal Medicine, Yale University School of Medicine.
Deron Galusha, Department of Occupational and Environmental Medicine there.
Martin D. Slade, Department of Internal Medicine.
Susan H. Busch, Yale University School of Medicine.
NOTES
- 1.Claxton G, et al. Health Benefits in 2007: Premium Increases Fall to an Eight-Year Low, while Offer Rates and Enrollment Remain Stable. Health Affairs. 2007;26(no. 5):1407–1416. doi: 10.1377/hlthaff.26.5.1407. [DOI] [PubMed] [Google Scholar]
- 2.See, for example, Buntin MB, et al. Consumer-Directed Health Care: Early Evidence about Effects on Cost and Quality. Health Affairs. 2006;25:w516–w530. doi: 10.1377/hlthaff.25.w516. (published online 24 October 2006; 10.1377/hlthaff.25.w516. Fowles JB, et al. Early Experience with Employee Choice of Consumer-Directed Health Plans and Satisfaction with Enrollment. Health Services Research. 2004;39(no. 4, Part 2):1141–1158. doi: 10.1111/j.1475-6773.2004.00279.x. Parente ST, Feldman R, Christianson JB. Employee Choice of Consumer-Driven Health Insurance in a Multiplan, Multiproduct Setting. Health Services Research. 2004;39(no. 4, Part 2):1091–1112. doi: 10.1111/j.1475-6773.2004.00275.x. LoSasso AT, et al. Tales from the New Frontier: Pioneers’ Experiences with Consumer-Driven Health Care. Health Services Research. 2004;39(no. 4, Part 2):1071–1090. doi: 10.1111/j.1475-6773.2004.00274.x.
- 3.Tollen LA, Ross MN, Poor S. Risk Segmentation Related to the Offering of a Consumer-Directed Health Plan: A Case Study of Humana Inc. Health Services Research. 2004;39(no. 4, Part 2):1167–1188. doi: 10.1111/j.1475-6773.2004.00281.x. [DOI] [PMC free article] [PubMed] [Google Scholar]
- 4.Jon Christianson, Stephen Parente, and Roger Feldman found that 8 percent of CDHP enrollees switched out after one year, compared to 5 percent of other enrollees, and that initial favorable selection disappeared over time. Christianson JB, Parente ST, Feldman R. Consumer Experiences in a Consumer-Driven Health Plan. Health Services Research. 2004;39(no. 4, Part 2):1123–1140. doi: 10.1111/j.1475-6773.2004.00278.x. Parente ST, Feldman R, Christianson JB. Evaluation of the Effect of a Consumer-Driven Health Plan on Medical Care Expenditures and Utilization. Health Services Research. 2004;39(no. 4, Part 2):1189–1210. doi: 10.1111/j.1475-6773.2004.00282.x.
- 5.Busch SH, et al. Effects of a Cost-Sharing Exemption on Use of Preventive Services at One Large Employer. Health Affairs. 2006;25(no. 6):1529–1536. doi: 10.1377/hlthaff.25.6.1529. [DOI] [PubMed] [Google Scholar]
- 6.Rowe JW, et al. The Effect of Consumer-Directed Health Plans on the Use of Preventive and Chronic Illness Services. Health Affairs. 2008;27(no. 1):113–120. doi: 10.1377/hlthaff.27.1.113. [DOI] [PubMed] [Google Scholar]
- 7.The presence of two outpatient diagnostic codes, one inpatient code, or a filled (diabetes) prescription was used to classify disease status.
- 8.Nicholson S, et al. The Magnitude and Nature of Risk Selection in Employer-Sponsored Health Plans. Health Services Research. 2004;39(no. 6, Part 1):1817–1838. doi: 10.1111/j.1475-6773.2004.00320.x. [DOI] [PMC free article] [PubMed] [Google Scholar]
- 9.Results are qualitatively similar for individual policyholders, although differences are not statistically significant by chronic condition.
- 10.Berk ML, Monheit AC. The Concentration of Health Care Expenditures, Revisited. Health Affairs. 2001;20(no. 2):9–18. doi: 10.1377/hlthaff.20.2.9. [DOI] [PubMed] [Google Scholar]
- 11.Remler DK, Glied SA. How Much More Cost Sharing Will Health Savings Accounts Bring? Health Affairs. 2006;25(no. 4):1070–1078. doi: 10.1377/hlthaff.25.4.1070. [DOI] [PubMed] [Google Scholar]
- 12.Nicholson, et al. The Magnitude and Nature [Google Scholar]; Altman D, Cutler D, Zeckhauser R. Enrollee Mix, Treatment Intensity, and Cost in Competing Indemnity and HMO Plans. Journal of Health Economics. 2003;22(no. 1):23–45. doi: 10.1016/s0167-6296(02)00094-2. [DOI] [PubMed] [Google Scholar]
- 13.Glazer J, McGuire TG. Private Employers Don’t Need Formal Risk Adjustment. Inquiry. 2001;38(no. 3):260–269. doi: 10.5034/inquiryjrnl_38.3.260. [DOI] [PubMed] [Google Scholar]
- 14.Tollen, et al. Risk Segmentation [Google Scholar]
- 15.Rosenthal M, Hsuan C, Milstein A. A Report Card on the Freshman Class of Consumer-Directed Health Plans. Health Affairs. 2005;24(no. 6):1592–1600. doi: 10.1377/hlthaff.24.6.1592. [DOI] [PubMed] [Google Scholar]