

Abstract
Following the onset of central vision loss, most patients develop an eccentric retinal location outside the affected macular region, the preferred retinal locus (PRL), as their new reference for visual tasks. The first goal of this paper is to present behavioral evidence showing the presence of experience-dependent plasticity in people with central vision loss. The evidence includes (1) the presence of oculomotor re-referencing of fixational saccades to the PRL; (2) the characteristics of the shape of the crowding zone (spatial region within which the presence of other objects affects the recognition of a target) at the PRL are more “foveal-like” instead of resembling those of the normal periphery; and (3) the change in the shape of the crowding zone at a para-PRL location that includes a component referenced to the PRL. These findings suggest that there is a shift in the referencing locus of the oculomotor and the sensory visual system from the fovea to the PRL for people with central vision loss, implying that the visual system for these individuals is still plastic and can be modified through experiences. The second goal of the paper is to demonstrate the feasibility of applying perceptual learning, which capitalizes on the presence of plasticity, as a tool to improve functional vision for people with central vision loss. Our finding that visual function could improve with perceptual learning presents an exciting possibility for the development of an alternative rehabilitative strategy for people with central vision loss.
Keywords: central vision loss, low vision, AMD, plasticity, eye movements, acuity, crowding, perceptual learning, rehabilitation
To millions of Americans and approximately 135 million people around the world who suffer from impaired vision that cannot be corrected optically,1–3 the vision loss presents a major challenge for daily living. The exact impact of the vision loss on an individual’s life depends on many factors, including the etiology of the visual impairment, progression of the vision loss, characteristics of the remaining vision, the individual’s goal, age, living style, etc. Even considering visual factors alone, acuity, visual field status and contrast sensitivity can all affect how well an individual performs a specific task, and may indicate the necessity for different rehabilitation strategies and paradigms. The work described in this article relates to people with central vision loss. The leading cause of central vision loss is age-related macular degeneration (AMD), which is also the leading cause of blindness for people over 65 years of age.1,3–7 Other common causes of central vision loss include Stargardt’s disease, Best’s vitelliform macular dystrophy and cone dystrophy. Despite the differences in the disease process of these disorders, many of the symptoms experienced by people afflicted by these disorders are similar, as they are mostly the consequence of the loss of function of the macular area, the part of the retina that offers the most acute vision. As a result, tasks that require detailed vision such as reading and identifying faces are difficult for these people. To help alleviate the problem of not being able to see small details, the current practice in low vision rehabilitation is to provide magnification so that the image of the target exceeds the resolution limit of the individual. However, at least for the task of reading, even when print size is not a limiting factor (through the use of magnification), reading speed is still slower in the periphery than in the fovea,8–13 suggesting that there are other limitations in using the peripheral retina to see that are beyond the resolution limit. Therefore, alternative rehabilitative strategies need to be developed to improve the functional vision of people with central vision loss, which hopefully will lead to an improved quality of life.
Recently, perceptual learning has been proposed as a treatment for amblyopia.14–16 Perceptual learning refers to the improvements on visual tasks that result from repeated practice. It has been shown that following weeks and sometimes, months of repeated practice on specific visual tasks, visual functions such as localization acuity, visual acuity and even stereopsis showed substantial improvements in adults with amblyopia who are long past the critical period of visual development.17–21 Considering that perceptual learning proves to be an effective strategy in improving the functional vision of adults with amblyopia, will it be equally effective as a tool to improve the functional vision of older adults with bilateral central vision loss? An important basis for perceptual learning is that the brain retains a certain degree of plasticity, so that neuronal connections can still be modified according to experience.22,23 Given that the primary cause of central vision loss is AMD which is prevalent in the elderly, is there plasticity retained in the aged and compromised visual system that will allow it to take advantage of perceptual learning to improve visual function?
When the macular area becomes dysfunctional, people with central vision loss often adopt a region outside their dysfunctional macular area as the surrogate fovea, or the “pseudo-fovea” for visual tasks (Figure 1).24–30 This area, often referred to as the preferred retinal locus (PRL), is usually situated within close proximity from the edge of the dysfunctional macular region. The fact that people with central vision loss can develop an area outside the dysfunctional macular area to use as their “new fovea”, by itself, is already evidence that there is plasticity of the visual system in response to bilateral central vision loss. In this paper, we will first present some behavioral evidence to demonstrate the presence of plasticity in the visual system following bilateral central vision loss, especially at and around the PRL location. We will then present the results of a feasibility study showing whether or not people with central vision loss can benefit from perceptual learning. The evidence of the existence of plasticity in the aged and compromised visual system is crucial for neuroscientists who wish to better understand how the brain functions; but more importantly, it helps us better understand the visual capabilities of people with central vision loss, and the potentials for new types of rehabilitative strategies for these people.
Figure 1.
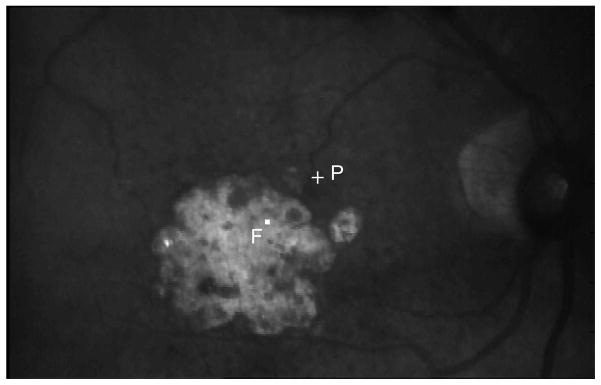
The fundus picture of an observer with AMD taken using the Rodenstock SLO. F represents the fovea and P represents the PRL.
OCULOMOTOR EVIDENCE
Our eyes are constantly in motion due to fixational eye movements. These are involuntary eye movements that help to prevent the visual scene from fading, and comprise fixational saccades,a slow drifts and high-frequency tremors. For people with normal vision, fixational saccades are usually directed toward the fovea,b the presumed reference locus for oculomotor movements. When the fovea becomes dysfunctional, as in the case of central vision loss, where do the fixational saccades go? White and Bedell27 provided the first piece of evidence that in the presence of long-standing central vision loss, there is a shift in the oculomotor reference such that saccades are directed toward the PRL, instead of the fovea as in people with normal vision.
In their study, they used a set of stringent criteria to define a shift in the oculomotor reference, involving the examination of the direction of refixational saccades (observers making a sequence of saccades and fixations to follow a target that jumped three times in a trial). They found that 7 (only one had AMD, the rest had juvenile macular degeneration) of a total of 21 observers showed a shift in their oculomotor reference. However, refixational saccades are volitional in nature. Considering that a complete oculomotor re-referencing process should occur without an individual’s conscious effort, it will be more appropriate to examine if there is a re-referencing of eye movements that are involuntary in nature. Therefore, we turn to fixational saccades, which are involuntary in nature.
We used the Rodenstock 101 scanning laser ophthalmoscope (SLO) to record fixational eye movements of a group of 16 observers with long-standing bilateral central vision loss (12 with AMD and 4 with Stargardt, all had central vision loss for at least 2 years). Seven of the observers were tested on both eyes, thus yielding a total of 23 eyes tested (acuity: 0.48–1.10 logMAR). Testing was performed monocularly. Observers were asked to look at the center of a 1° cross and maintained their gaze as steady as possible while we recorded the eye movements for trials of 30s. Trials during which observers reported the disappearance of the fixational cross were discarded and repeated. At least three trials were analyzed for each observer. Video 1 shows a trial of an observer with AMD. Fixational eye movements were recovered from the video using a cross-correlation procedure modified after the one described in Stevenson and Roorda,32 which allows us to analyze the eye movement data at a sampling rate (540 Hz) much higher than the 30 Hz frame rate of the SLO. Figure 2 shows the horizontal and vertical eye position traces extracted from Video 1 (available at [LWW insert link]).
Figure 2.

Eye position traces extracted from the 30s video clip collected from an observer with AMD (Video 1). The horizontal and vertical eye position traces, offset vertically for clarity, are plotted as black and gray lines, respectively. Upward deviations of the traces denote rightward eye movements for the horizontal trace and upward eye movements for the vertical trace.
We then applied a velocity criterion of 15°/s to identify fixational saccades and determined whether they were directed toward the anatomical fovea or the PRL. For each fixational saccade identified, we determined the position of the fixational cross in the video frame immediately before and immediately after the saccade. This gave us the trajectory of the fixational saccade from which we determined the magnitude and the direction of the saccade. As for people with normal vision, fixational saccades may not land accurately at the intended fixation reference location. We calculated the distance between the position of the fixational cross after a fixational saccade and the PRL (saccade errorPRL), and the distance between the position of the cross and the fovea (saccade errorfovea, see Figure 3A). The average values of these two measurements, pooled across all fixational saccades of a trial, and across three trials for each eye, are plotted in Figure 3B (each eye is represented by a circle). Across the 23 eyes, saccade errorPRL are 2° or smaller, but saccade errorfovea are as large as 11°, implying that most of the fixational saccades were intended toward the PRL instead of the fovea. The shift from using the fovea as a reference locus for fixational eye movements to using the PRL as the reference locus is evidence of plasticity of the oculomotor system.
Figure 3.

(A) A schematic figure showing the target position on the retina before and after a fixational saccade, and our definitions of saccade error with respect to the PRL (Saccade ErrorPRL), or with respect to the fovea (Saccade Errorfovea). If the fixational saccade lands perfectly on the fovea, then Saccade Errorfovea = 0 and Saccade ErrorPRL = eccentricity of the PRL. Conversely, if the fixational saccade lands perfectly on the PRL, then Saccade ErrorPRL = 0 and Saccade Errorfovea = eccentricity of the PRL. These values are used to calculate the re-referencing index (see Eq. 1). (B) Saccade Errorfovea is plotted as a function of Saccade ErrorPRL. Each symbol represents the data for one tested eye. (C) The re-referencing index is plotted for the 23 eyes with central vision loss.
To quantify the degree of completeness of the re-referencing process, we derived a re-referencing index that ranged from 0 to 1:
| [Eq 1] |
where 0 implies that there is no re-referencing and 1 implies a complete re-referencing. Figure 3C plots the re-referencing indices for the 23 eyes. The range of the indices is 0.56–0.97, with a mean of 0.82±0.043 [95% CI], implying a very high degree of re-referencing for our group of observers with long-standing central vision loss.
SENSORY EVIDENCE: ACUITY
If there is oculomotor re-referencing, and the PRL serves as the new fovea, then we would expect that with repeated usage, visual performance at the PRL would improve and become better than that measured at the same retinal location in the normal periphery. We tested this hypothesis by measuring Tumbling-E acuity at the PRL for a group of 11 observers with longstanding central vision loss (8 with AMD and 3 with Stargardt, all had central vision loss for at least 2 years). Six of the observers were tested in both eyes, thus yielding a total of 17 eyes tested. Targets (single Tumbling-Es) were presented using the SLO, which allowed us to determine the PRL each observer adopted to perform the task (see Figure 4A for a sample trial). In addition, using custom-written software, we were able to use the SLO as a gaze-contingent display to compensate for unwanted eye movements and to ensure that the target was presented at the same retinal location throughout a trial. Observers identified the orientation of the Tumbling-E target. The size of the Tumbling-E target varied from trial to trial according to an adaptive staircase procedure. Each set of data collected for a staircase was fit with a cumulative-Gaussian function, from which we derived the letter size that corresponded to 62.5%-correct (50%-correct after correction for chance level) as our threshold acuity. Trials during which observers used a retinal location that was not their PRL were discarded online and repeated (with a different orientation of the Tumbling-E). For comparison, we performed similar measurements in a group of 11 older adults with normal vision (age: 62–77, mean = 69.3, all had best-corrected distance acuity of 20/20 or better in both eyes), at 5°, 10° and 15° eccentricity in the inferior and nasal fields of a randomly chosen eye. For these older adult control observers, a fixation target (a 1° cross) was provided and they were asked to fixate the cross while identifying the orientation of the Tumbling-E targets. The Tumbling-E targets were presented for 200 ms (6 video frames using the SLO).
Figure 4.

(A) The fundus picture showing a Tumbling E target presented on the retina of an observer with Stargardt’s disease. (B) Resolution acuity determined using the Tumbling-E targets (in logMAR) is plotted as a function of the PRL eccentricity for the 17 eyes with central vision loss (each circular symbol represents the acuity for one eye). For comparison, acuities determined at 5°, 10° and 15° in the inferior (upward triangles) and nasal (rightward-pointing triangles) visual fields in a group of 15 older adults with normal vision are plotted as group-averaged values. Error bars represent ± SEM based on 1000 bootstrappings of the data for each eye with central vision loss, or the ± 95% CI for the group of older adult control observers.
Figure 4B plots the acuities measured using the Tumbling-E targets for the 17 tested eyes with central vision loss (each eye shown as a circle) as a function of the PRL eccentricity. Gray triangular symbols represent the group-average acuities at each of the six retinal locations (3 eccentricities × 2 visual fields) tested in the normal periphery of the group of older adult control observers. Despite the substantial variability exhibited by the group of observers with central vision loss, a clear finding is that the acuity at the PRL of observers with central vision loss is never better than that at the same eccentricity in the normal periphery. This finding can be interpreted as either there is no plasticity of the sensory visual system, or that acuity cannot be improved even if there is plasticity of the sensory system. Indeed, acuity is known to be limited by cone density at the fovea and ganglion cell density in the periphery.33–35 It is highly likely that acuity at the PRL does not improve even with repeated usage of the PRL because plasticity cannot increase the cone or ganglion cell densities. However, it is also likely that the plasticity that could improve visual functions may not occur at the retinal level.
SENSORY EVIDENCE: CROWDING ZONE AT THE PRL
Given that acuity is not amenable to improvement that results from the repeated usage of the PRL as the new reference location, either because of the task per se, or that it is limited at the retinal level, in order to determine whether or not there is plasticity in the sensory system, we examined a different task that is known to be limited at the cortical level — crowding. Crowding refers to the “increased difficulty in identifying targets which are closely adjacent to other targets”.36 The detrimental effect of crowding is similar whether the adjacent objects (usually referred to as “flankers” in psychophysical studies) are presented in the ipsilateral or contralateral eye as the target,37–38 thus placing the site of crowding at the cortical level.
Crowding is usually quantified in terms of its magnitude (the decrement in performance that occurs in the presence of nearby objects) and/or its extent (the lateral spread of the effect). An important property of crowding is that both the magnitude and the extent of crowding are smaller in the fovea than in the periphery.39–43 Additionally, the extent of crowding is similar along different meridians when the target is presented at the fovea, but the extent differs substantially along different meridians when the target is presented at a peripheral location, with the extent being the greatest along the radial meridian connecting the target location to the fovea, and the smallest along the tangential meridian.41 As such, the two-dimensional shape of the crowding zone is circular at the fovea and elliptical in the periphery. This distinction in the shape of the crowding zone formed the basis of the predictions for testing whether or not the spatial properties at the PRL, at least in reference to crowding, have changed to become more “foveal-like” as a result of plasticity. Specifically, if there is plasticity which causes the spatial properties at the PRL to become more foveal-like, then the shape of the crowding zone determined at the PRL, which is at a peripheral retinal location with respect to the fovea, should become more circular and less elliptical.
We tested our predictions by mapping out the two-dimensional shape of the crowding zone at the PRL for a group of 11 observers with long-standing bilateral central vision loss (8 with AMD and 3 with Stargardt, all had central vision loss for at least 3 years, age: 48–88), using the SLO. To map out the shape of the crowding zone, we determined the extent of crowding along four cardinal meridians with respect to the PRL: 0° (horizontal), 45°, 90° (vertical) and 135°. The extent of crowding along each of these four meridians was determined separately using an adaptive staircase with the spacing (center-to-center) between the target and its flankers varied from trial to trial. The threshold spacing was derived from the best-fit cumulative-Gaussian function fit to each set of data collected for a staircase, and corresponded to 50% correct identification of the target, after correction for chance level. We used the 26 lowercase letters rendered in Courier font as target and flankers. On each trial, three letters (trigram) were randomly chosen without replacement as the target and flankers, so that the three letters were different from one another. The trigram was presented with the three letters aligned along the 0° (horizontal), 45°, 90° or 135° meridian with respect to the PRL, with the middle (target) letter always centered at the PRL (Figure 5A). Each trigram was presented for 667 ms (20 video frames). Observers were asked to verbally report the identity of the target letter of each trigram. Trials during which observers used a retinal location that was not their PRL were discarded and repeated (with a different trigram). For comparison and to validate our method, we also mapped out the two-dimensional shape of the crowding zone at the fovea, and at 5° and 10° eccentricity in the inferior and nasal fields for four older adults with normal vision (age: 63–79, all had best-corrected distance acuity of 20/20 or better in both eyes). For these older adult control observers, a 1° cross served as the fixation target for peripheral testing and they were asked to fixate the cross while identifying the target letter.
Figure 5.

(A) A schematic figure showing a trigram ‘hyf’ presented along the 90° (vertical) meridian, with the middle target letter centered on the PRL of observers with central vision loss, or the intended peripheral location for the control observers with normal vision. (B) The two-dimensional crowding zones are plotted for the normal fovea, and at 5° and 10° in the inferior and nasal fields in the normal periphery (shown as gray lines and ellipses). Data plotted represent the threshold separations averaged across the group of control observers. Also shown is the crowding zone of an observer with central vision loss, plotted in black and centered on his PRL. (C) Ratios between the magnitudes of the major and minor axis of the fitted ellipses are compared for the normal fovea, normal periphery and observers with central vision loss. For the normal peripheral data, each small gray circle represents the aspect ratio of an ellipse plotted in panel b. The black circle plots the mean ± 95% CI of these four values. For the category of central vision loss, each small gray symbol represents the aspect ratio of the ellipse fit to the data of one observer. The black circle plots the mean ± 95% CI of these values. The dashed line drawn at the ordinate value of 1 represents perfect isotropy of the fitted ellipse. (D) The extent of crowding (deg) along the major (filled circles) or the minor (unfilled circles) axis is plotted as a function of the PRL eccentricity (deg) for the observers with central vision loss. The dashed and dotted lines represent the best-fit regression lines to the data obtained in the normal periphery (combining data from the inferior and nasal fields).
Crowding zones are plotted in gray for the four older adult control observers at the fovea, and at 5° and 10° in the inferior and nasal fields in Figure 5B. For each crowding zone, the spatial extent of crowding along each of the four tested meridians is represented by the length of the line along that meridian. Data plotted are the values averaged across the four observers. The ellipse around each set of lines represents the best-fit ellipse to the set of data. As expected based on previous studies, the crowding zone is small in the normal fovea, and becomes progressively larger with eccentricity in the normal periphery.40–43 Also consistent with published reports, the shape of the crowding zone changes, being circular in the fovea but elliptical in the normal periphery.41 To quantify the anisotropy of the crowding zone, we calculated the ratio of the major and minor axes of each fitted ellipse. This aspect ratio is 1.04 at the fovea, not significantly different from a value of 1 (lack of anisotropy) and ranges between 1.57 and 2.09 in the periphery (mean = 1.78±0.247 [95% CI], see Figure 5C, does not vary systematically for 5° vs. 10° eccentricity, or the inferior vs. the nasal field), which are close to the anisotropy values reported previously.41,44 These findings validated our method of mapping out the two-dimensional shape of the crowding zone.
The crowding zone for an observer with central vision loss is plotted in black in Figure 5B. Comparing this crowding zone with those obtained from the older adult control observers, it is clear that this crowding zone is notably less elliptical than what would be expected based on the normal periphery. Across the group of 11 observers with central vision loss, the aspect ratio of the fitted ellipse used to represent the crowding zone ranges between 1.06 and 1.36, with a mean of 1.23±0.06 [95% CI] (Figure 5C). A two-tailed, two-sample t-test assuming unequal variances shows that the aspect ratios of the fitted ellipses are significantly different between those measured for observers with central vision loss and those measured in the normal periphery (tdf=3 = 4.26; p = 0.024). We interpret this finding as evidence that the shape of the crowding zone at the PRL becomes less elliptical with time, implying the existence of plasticity of the sensory visual system, as a consequence of the loss of central vision.
To further examine what brought about the change in the shape of the crowding zone at the PRL, we compared in Figure 5D the extent of crowding along the major and minor axes of the fitted ellipses for observers with central vision loss and the normal periphery. Despite individual variations, the extent of crowding for observers with central vision loss match the predicted values based on the normal periphery reasonably well for the minor axes. However, the extent of crowding for observers with central vision loss are smaller than the predicted values based on the normal periphery for the major axes. These results imply that it is the reduction in the extent of crowding along the major axis as a result of central vision loss that contributes to the less-elliptical shape of the crowding zone at the PRL. The reduction in the extent of crowding along the major axis is consistent with previous reports that through the repeated usage of a peripheral retinal location, the crowding zone becomes smaller in size; in other words, the detrimental of crowding is reduced.45–47
SENSORY EVIDENCE: CROWDING ZONE AT A PARA-PRL LOCATION
Another piece of evidence showing that the sensory system has re-referenced to the PRL as the new fovea comes from some preliminary results in my lab.48 We reasoned that if the crowding zone at the PRL has become less elliptical but more circular, just like in the normal fovea, then at a location away from the PRL, or, a “para-PRL” location, the crowding zone should be elliptical with the major axis oriented toward the PRL, instead of the fovea (as would be expected in the normal periphery). We tested this hypothesis by mapping out the two-dimensional shape of the crowding zone at a para-PRL location for three observers with central vision loss. For this experiment, we only presented one flanker simultaneously with the target letter (centered at the para-PRL location) on each trial, so as to allow the extent of crowding to be asymmetrical on the two sides of the target letter along any given meridian. Otherwise the experimental procedures for determining the extent of crowding were similar to those used for mapping the crowding zone at the PRL (see the previous section). Preliminary results show that the crowding zone measured at a para-PRL location was irregular in shape, but could be well described by two superimposing ellipses, with one oriented toward the PRL and the other toward the fovea. This finding is consistent with the contention that the crowding zone at a para-PRL location changes its orientation in response to the central vision loss, from orienting toward the fovea as in the normal periphery, to orienting toward the PRL as the PRL becomes the new fovea. A complete re-referencing to the PRL is expected to be associated with the crowding zone at the para-PRL location being one single ellipse oriented toward the PRL. Our observation of an irregular shape of the crowding zone that can be described by two superimposing ellipses indicates that the re-referencing process was not yet completed for our observers. We are currently developing methods to better describe and characterize the crowding zone at the para-PRL locations and to quantify the completeness of the re-referencing process.
TAKING ADVANTAGE OF THE PRESENCE OF PLASTICITY
The evidence laid out above clearly shows that there is still experience-dependent plasticity in the visual system of people who experienced a loss of central vision later in life, even in their 60s or 70s. Experience-dependent plasticity refers to the fact that the connections in the brain can be modified in response to events or experiences that happen beyond the critical period of visual development.22,23 As we mentioned in the Introduction, one way to take advantage of experience-dependent plasticity to improve functional vision for clinical patients is through perceptual learning, which has proven to be an effective strategy for ameliorating some of the visual deficits for people with amblyopia.14–21 Can perceptual learning be used as a tool to improve the functional vision of older adults with bilateral central vision loss?
We tested if it was feasible to use perceptual learning to improve functional vision for older adults with central vision loss by training six such observers (4 with AMD and 2 with Stargardt, all had central vision loss for at least 7 years) using a reading task. Details of the study can be found elsewhere.49 In brief, observers each attended six weekly training sessions, with each session lasted approximately 1.5h. During training, observers repeatedly read aloud single sentences, presented using the rapid serial visual presentation paradigm (RSVP, see Figure 6A).8,50–52 The RSVP paradigm minimizes the need to make reading eye movements by presenting words one at a time on the computer display in a sequence. Observers were asked to read aloud the words of each sentence as quickly and as accurately as possible, and we counted the number of words correctly read. By using a range of word exposure durations, we obtained a range of observer’s performance, from close to 10% to almost perfect reading accuracy. We fit each set of data (based on 30 sentences, an average of 330 words) with a cumulative-Gaussian function, from which we calculated the criterion reading speed based on the word exposure duration that corresponded to 80% of words correctly read.8,51,52 Before and after training, we measured visual acuity using the Bailey-Lovie chart, critical print size (the smallest print size at which an observer can read at his/her maximum reading speed), fixation stability and the PRL location for fixation using the SLO.
Figure 6.

(A) A schematic figure showing a trial of the reading training task using the rapid serial visual presentation (RSVP) paradigm. (B) A comparison of the amount of improvement for different tasks (plotted as post-pre ratios) following training. Group-averaged values (± 95% CI) are plotted as black circles. Small gray circles represent data from individual observers. The dashed line represents no changes in performance before and after training. In general, only the trained task (reading speed measurement) showed an improvement following training. There was no change (post-pre ratio of 1) in visual acuity, critical print size and fixation stability following training.
Over the course of six weeks of training where observers were shown a total of 1800 sentences, or approximately 20,000 words, all observers improved in their reading speed.49 The amount of improvement ranged from 34% to 70% (mean = 53±10% [95% CI], see Figure 6B). However, there was no accompanied improvement in visual acuity and critical print size (Figure 6B), implying that although observers could read faster following training, they were not able to see or read smaller print better. The improvement in reading speed also did not lead to improved fixation stability (quantified as the bivariate contour ellipse area in deg2), suggesting that the improvement was not due to the oculomotor system becoming more stable with training. In addition, the PRL locations before and after training were similar for all observers, implying that the observed improvement in reading speed could not be attributed to observers adopting a different PRL with better visual capabilities.
These observations are consistent with the well-known characteristic of task specificity of perceptual learning, in that the improvement due to training is usually very specific to the trained task and unless it is highly similar to other tasks, the improvement does not transfer.45,53–55 In this case, reading speed is a rate measurement, therefore it is likely that an improvement in reading speed does not transfer to better acuities, which are resolution tasks and are likely to be limited by cone or ganglion cell density, as we discussed earlier (see the Section on “Sensory Evidence: Acuity”). Practically this finding implies that it is feasible to improve the reading speed for clinical patients with central vision loss using perceptual learning, but they would still require magnification to do so through the use of large-print books, optical or electronic magnifiers.
Another characteristic of perceptual learning is that the improvement is supposed to be relatively permanent, or at least it should be retained for a period of time even without any further “top-up” training. We did not test whether our observers retained their improved reading speeds weeks or months following the training. However, in practice, if a task is important to patients, in this case, reading, they are likely to continue to read at home even after the training ceases, which could act as “top-up” training. On the contrary, if the patients do not read at home, that means reading is not important to them, then whether there is a retention of improved reading speed is not a critical issue as the task clearly is not important to these patients in real life.
SUMMARY
Contrary to the dogma that many visual functions continue to develop during the critical period of visual development and become stabilized after the critical period ends, here we show that there is experience-dependent plasticity in the visual system that is present even in the seventh or eighth decade of life such that visual functions can still be modified in response to experiences throughout life. Specifically, people who develop bilateral central vision loss even late in life could develop a retinal location outside their dysfunctional macular area as their “new fovea”, and use it as the new reference locus for oculomotor and visual tasks. The presence of this experience-dependent plasticity offers us an exciting opportunity to adopt perceptual learning as an alternative rehabilitative strategy for improving visual functions for people with central vision loss.
Supplementary Material
SLO recording of an observer with AMD fixating on the cross for 30s. The pink and blue rectangles represent the location of the anatomical fovea and the averaged position of fixation (PRL), respectively.
Acknowledgments
As an academic great grandchild of Dr. Fry, I am truly humbled and deeply honored to have received the prestigious Glenn A. Fry Award. I am grateful to the Academy and AOF for being supportive of my academic development, through an Ezell Fellowship, the Borish Award and now the Fry Award. I am especially thankful for the opportunities to learn under the mentorship of three great vision scientists — Drs. Harold Bedell, Dennis Levi and Gordon Legge, who have been extremely supportive of me, and have never wavered in their confidence in me. I am indebted to my many collaborators with whom I have the greatest fortune of working, especially the following, who contributed directly to the work presented in this paper: Jean-Baptiste Bernard, Girish Kumar, Yiji Lin, Anirvan Nandy, Hope Queener and Bosco Tjan. Jean-Baptiste Bernard, Daniel Coates and Girish Kumar provided helpful comments to my presentation in Phoenix and to an earlier draft of this paper. Finally, I wish to record my appreciation for the participants in my research studies, especially the low vision subjects, without whom these studies would not have been possible.
The work presented here was supported by Research Grant R01-EY012810, Core Center Grants P30-EY007551 (UH) and P30-EY003176 (UCB) from the National Institutes of Health.
Footnotes
Also known as microsaccades, but the term “micro” implies the magnitude of these saccades during fixation is small. For people with central vision loss, the magnitude of these saccades could be a couple of degrees and is not microscopic in nature, therefore we prefer the term fixational saccades.
Using an adaptive-optics ophthalmoscope, Putnam et al31 showed that the retinal locus for fixation in subjects with normal vision could be displaced from the location that corresponds to the highest foveal cone density by approximately 10 arc min. However, such an offset from the foveola is small compared with the distance between the fovea and the PRL in patients with central vision loss. Therefore, in this paper, we assume that the retinal locus for fixation in normally sighted subjects is the center of the fovea, despite the small offset between the actual fixation locus and the center of the fovea.
This paper was based on the Fry Lecture presented at the American Academy of Optometry Annual Meeting in Phoenix, AZ, in October 2012.
References
- 1.Congdon N, O’Colmain B, Klaver CC, Klein R, Munoz B, Friedman DS, Kempen J, Taylor HR, Mitchell P. Causes and prevalence of visual impairment among adults in the United States. Arch Ophthalmol. 2004;122:477–85. doi: 10.1001/archopht.122.4.477. [DOI] [PubMed] [Google Scholar]
- 2.Vitale S, Cotch MF, Sperduto RD. Prevalence of visual impairment in the United States. JAMA. 2006;295:2158–63. doi: 10.1001/jama.295.18.2158. [DOI] [PubMed] [Google Scholar]
- 3.World Health Organization. Global Data on Visual Impairments 2010. Geneva: World Health Organization; 2010. [Accessed March 28, 2013]. Available at: http://www.who.int/blindness/GLOBALDATAFINALforweb.pdf. [Google Scholar]
- 4.Klaver CC, Wolfs RC, Vingerling JR, Hofman A, de Jong PT. Age-specific prevalence and causes of blindness and visual impairment in an older population: the Rotterdam Study. Arch Ophthalmol. 1998;116:653–8. doi: 10.1001/archopht.116.5.653. [DOI] [PubMed] [Google Scholar]
- 5.Wang JJ, Foran S, Mitchell P. Age-specific prevalence and causes of bilateral and unilateral visual impairment in older Australians: the Blue Mountains Eye Study. Clin Experiment Ophthalmol. 2000;28:268–73. doi: 10.1046/j.1442-9071.2000.00315.x. [DOI] [PubMed] [Google Scholar]
- 6.Muñoz B, West SK, Rubin GS, Schein OD, Quigley HA, Bressler SB, Bandeen-Roche K. Causes of blindness and visual impairment in a population of older Americans: The Salisbury Eye Evaluation Study. Arch Ophthalmol. 2000;118:819–25. doi: 10.1001/archopht.118.6.819. [DOI] [PubMed] [Google Scholar]
- 7.Friedman DS, O’Colmain BJ, Muñoz B, Tomany SC, McCarty C, de Jong PT, Nemesure B, Mitchell P, Kempen J. Prevalence of age-related macular degeneration in the United States. Arch Ophthalmol. 2004;122:564–72. doi: 10.1001/archopht.122.4.564. [DOI] [PubMed] [Google Scholar]
- 8.Chung STL, Mansfield JS, Legge GE. Psychophysics of reading. XVIII. The effect of print size on reading speed in normal peripheral vision. Vision Res. 1998;38:2949–62. doi: 10.1016/s0042-6989(98)00072-8. [DOI] [PubMed] [Google Scholar]
- 9.Chaparro A, Young RS. Reading with rods: the superiority of central vision for rapid reading. Invest Ophthalmol Vis Sci. 1993;34:2341–7. [PubMed] [Google Scholar]
- 10.Latham K, Whitaker D. A comparison of word recognition and reading performance in foveal and peripheral vision. Vision Res. 1996;36:2665–74. doi: 10.1016/0042-6989(96)00022-3. [DOI] [PubMed] [Google Scholar]
- 11.Legge GE, Rubin GS, Pelli DG, Schleske MM. Psychophysics of reading. II. Low vision. Vision Res. 1985;25:253–65. doi: 10.1016/0042-6989(85)90118-x. [DOI] [PubMed] [Google Scholar]
- 12.Bullimore MA, Bailey IL. Reading and eye movements in age-related maculopathy. Optom Vis Sci. 1995;72:125–38. doi: 10.1097/00006324-199502000-00011. [DOI] [PubMed] [Google Scholar]
- 13.Chung STL. Enhancing visual performance for people with central vision loss. Optom Vis Sci. 2010;87:276–84. doi: 10.1097/OPX.0b013e3181c91347. [DOI] [PMC free article] [PubMed] [Google Scholar]
- 14.Levi DM, Li RW. Perceptual learning as a potential treatment for amblyopia: a mini-review. Vision Res. 2009;49:2535–49. doi: 10.1016/j.visres.2009.02.010. [DOI] [PMC free article] [PubMed] [Google Scholar]
- 15.Polat U. Making perceptual learning practical to improve visual functions. Vision Res. 2009;49:2566–73. doi: 10.1016/j.visres.2009.06.005. [DOI] [PubMed] [Google Scholar]
- 16.Astle AT, Webb BS, McGraw PV. Can perceptual learning be used to treat amblyopia beyond the critical period of visual development? Ophthalmic Physiol Opt. 2011;31:564–73. doi: 10.1111/j.1475-1313.2011.00873.x. [DOI] [PMC free article] [PubMed] [Google Scholar]
- 17.Levi DM. Perceptual learning in adults with amblyopia: a reevaluation of critical periods in human vision. Dev Psychobiol. 2005;46:222–32. doi: 10.1002/dev.20050. [DOI] [PubMed] [Google Scholar]
- 18.Levi DM, Polat U. Neural plasticity in adults with amblyopia. Proc Natl Acad Sci U S A. 1996;93:6830–4. doi: 10.1073/pnas.93.13.6830. [DOI] [PMC free article] [PubMed] [Google Scholar]
- 19.Polat U, Ma-Naim T, Belkin M, Sagi D. Improving vision in adult amblyopia by perceptual learning. Proc Natl Acad Sci U S A. 2004;101:6692–7. doi: 10.1073/pnas.0401200101. [DOI] [PMC free article] [PubMed] [Google Scholar]
- 20.Zhou Y, Huang C, Xu P, Tao L, Qiu Z, Li X, Lu ZL. Perceptual learning improves contrast sensitivity and visual acuity in adults with anisometropic amblyopia. Vision Res. 2006;46:739–50. doi: 10.1016/j.visres.2005.07.031. [DOI] [PubMed] [Google Scholar]
- 21.Huang CB, Zhou Y, Lu ZL. Broad bandwidth of perceptual learning in the visual system of adults with anisometropic amblyopia. Proc Natl Acad Sci U S A. 2008;105:4068–73. doi: 10.1073/pnas.0800824105. [DOI] [PMC free article] [PubMed] [Google Scholar]
- 22.Karmarkar UR, Dan Y. Experience-dependent plasticity in adult visual cortex. Neuron. 2006;52:577–85. doi: 10.1016/j.neuron.2006.11.001. [DOI] [PubMed] [Google Scholar]
- 23.Gilbert CD, Li W. Adult visual cortical plasticity. Neuron. 2012;75:250–64. doi: 10.1016/j.neuron.2012.06.030. [DOI] [PMC free article] [PubMed] [Google Scholar]
- 24.Timberlake GT, Mainster MA, Peli E, Augliere RA, Essock EA, Arend LE. Reading with a macular scotoma. I. Retinal location of scotoma and fixation area. Invest Ophthalmol Vis Sci. 1986;27:1137–47. [PubMed] [Google Scholar]
- 25.Timberlake GT, Peli E, Essock EA, Augliere RA. Reading with a macular scotoma. II. Retinal locus for scanning text. Invest Ophthalmol Vis Sci. 1987;28:1268–74. [PubMed] [Google Scholar]
- 26.Whittaker SG, Budd J, Cummings RW. Eccentric fixation with macular scotoma. Invest Ophthalmol Vis Sci. 1988;29:268–78. [PubMed] [Google Scholar]
- 27.White JM, Bedell HE. The oculomotor reference in humans with bilateral macular disease. Invest Ophthalmol Vis Sci. 1990;31:1149–61. [PubMed] [Google Scholar]
- 28.Guez JE, Le Gargasson JF, Rigaudiere F, O’Regan JK. Is there a systematic location for the pseudo-fovea in patients with central scotoma? Vision Res. 1993;33:1271–9. doi: 10.1016/0042-6989(93)90213-g. [DOI] [PubMed] [Google Scholar]
- 29.Fletcher DC, Schuchard RA. Preferred retinal loci relationship to macular scotomas in a low-vision population. Ophthalmology. 1997;104:632–8. doi: 10.1016/s0161-6420(97)30260-7. [DOI] [PubMed] [Google Scholar]
- 30.Schuchard RA. Preferred retinal loci and macular scotoma characteristics in patients with age-related macular degeneration. Can J Ophthalmol. 2005;40:303–12. doi: 10.1016/S0008-4182(05)80073-0. [DOI] [PubMed] [Google Scholar]
- 31.Putnam NM, Hofer HJ, Doble N, Chen L, Carroll J, Williams DR. The locus of fixation and the foveal cone mosaic. J Vis. 2005;5:632–9. doi: 10.1167/5.7.3. [DOI] [PubMed] [Google Scholar]
- 32.Stevenson SB, Roorda A. Correcting for miniature eye movements in high resolution scanning laser ophthalmoscopy. In: Manns F, Soderberg PG, Ho A, Stuck BE, Belkin M, editors. Ophthalmic Technologies XV: Proc. SPIE 5688; San Jose, California. January 22, 2005; Bellingham, WA: SPIE; 2005. pp. 145–51. [Google Scholar]
- 33.Rolls ET, Cowey A. Topography of the retina and striate cortex and its relationship to visual acuity in rhesus monkeys and squirrel monkeys. Exp Brain Res. 1970;10:298–310. doi: 10.1007/BF00235053. [DOI] [PubMed] [Google Scholar]
- 34.Williams DR, Coletta NJ. Cone spacing and the visual resolution limit. J Opt Soc Am (A) 1987;4:1514–23. doi: 10.1364/josaa.4.001514. [DOI] [PubMed] [Google Scholar]
- 35.Thibos LN, Cheney FE, Walsh DJ. Retinal limits to the detection and resolution of gratings. J Opt Soc Am (A) 1987;4:1524–9. doi: 10.1364/josaa.4.001524. [DOI] [PubMed] [Google Scholar]
- 36.Hofstetter HW, Griffin JR, Berman MS, Everson RW. Dictionary of Visual Science and Related Clinical Terms. 5. Boston: Butterworth-Heinemann; 2000. [Google Scholar]
- 37.Flom MC, Heath GG, Takahashi E. Contour interaction and visual resolution: contralateral effects. Science. 1963;142:979–80. doi: 10.1126/science.142.3594.979. [DOI] [PubMed] [Google Scholar]
- 38.Kooi FL, Toet A, Tripathy SP, Levi DM. The effect of similarity and duration on spatial interaction in peripheral vision. Spat Vis. 1994;8:255–79. doi: 10.1163/156856894x00350. [DOI] [PubMed] [Google Scholar]
- 39.Bouma H. Interaction effects in parafoveal letter recognition. Nature. 1970;226:177–8. doi: 10.1038/226177a0. [DOI] [PubMed] [Google Scholar]
- 40.Jacobs RJ. Visual resolution and contour interaction in the fovea and periphery. Vision Res. 1979;19:1187–95. doi: 10.1016/0042-6989(79)90183-4. [DOI] [PubMed] [Google Scholar]
- 41.Toet A, Levi DM. The two-dimensional shape of spatial interaction zones in the parafovea. Vision Res. 1992;32:1349–57. doi: 10.1016/0042-6989(92)90227-a. [DOI] [PubMed] [Google Scholar]
- 42.Chung STL, Levi DM, Legge GE. Spatial-frequency and contrast properties of crowding. Vision Res. 2001;41:1833–50. doi: 10.1016/s0042-6989(01)00071-2. [DOI] [PubMed] [Google Scholar]
- 43.Levi DM, Hariharan S, Klein SA. Suppressive and facilitatory spatial interactions in peripheral vision: peripheral crowding is neither size invariant nor simple contrast masking. J Vis. 2002;2:167–77. doi: 10.1167/2.2.3. [DOI] [PubMed] [Google Scholar]
- 44.Nandy AS, Tjan BS. Saccade-confounded image statistics explain visual crowding. Nat Neurosci. 2012;15:463–9. doi: 10.1038/nn.3021. [DOI] [PMC free article] [PubMed] [Google Scholar]
- 45.Chung STL. Learning to identify crowded letters: does it improve reading speed? Vision Res. 2007;47:3150–9. doi: 10.1016/j.visres.2007.08.017. [DOI] [PMC free article] [PubMed] [Google Scholar]
- 46.Hussain Z, Webb BS, Astle AT, McGraw PV. Perceptual learning reduces crowding in amblyopia and in the normal periphery. J Neurosci. 2012;32:474–80. doi: 10.1523/JNEUROSCI.3845-11.2012. [DOI] [PMC free article] [PubMed] [Google Scholar]
- 47.Chung STL, Truong SR. Learning to identify crowded letters: does the learning depend on the frequency of training? Vision Res. 2013;77:41–50. doi: 10.1016/j.visres.2012.11.009. [DOI] [PMC free article] [PubMed] [Google Scholar]
- 48.Chung STL, Bernard JB, Kumar G, Nandy AS, Tjan BS. Program No. 489.17/QQ29. 2011 Neuroscience Meeting Planner. Washington, DC: Society for Neuroscience; 2011. Re-referencing of saccadic eye movements and modifications of spatial properties at and around the PRL in people with AMD. Online. [Google Scholar]
- 49.Chung STL. Improving reading speed for people with central vision loss through perceptual learning. Invest Ophthalmol Vis Sci. 2011;52:1164–70. doi: 10.1167/iovs.10-6034. [DOI] [PMC free article] [PubMed] [Google Scholar]
- 50.Rubin GS, Turano K. Low vision reading with sequential word presentation. Vision Res. 1994;34:1723–33. doi: 10.1016/0042-6989(94)90129-5. [DOI] [PubMed] [Google Scholar]
- 51.Chung STL. The effect of letter spacing on reading speed in central and peripheral vision. Invest Ophthalmol Vis Sci. 2002;43:1270–6. [PubMed] [Google Scholar]
- 52.Chung STL, Legge GE, Cheung SH. Letter-recognition and reading speed in peripheral vision benefit from perceptual learning. Vision Res. 2004;44:695–709. doi: 10.1016/j.visres.2003.09.028. [DOI] [PMC free article] [PubMed] [Google Scholar]
- 53.Fiorentini A, Berardi N. Perceptual learning specific for orientation and spatial frequency. Nature. 1980;287:43–4. doi: 10.1038/287043a0. [DOI] [PubMed] [Google Scholar]
- 54.Ball K, Sekuler R. A specific and enduring improvement in visual motion discrimination. Science. 1982;218:697–8. doi: 10.1126/science.7134968. [DOI] [PubMed] [Google Scholar]
- 55.Ahissar M, Hochstein S. Task difficulty and the specificity of perceptual learning. Nature. 1997;387:401–6. doi: 10.1038/387401a0. [DOI] [PubMed] [Google Scholar]
Associated Data
This section collects any data citations, data availability statements, or supplementary materials included in this article.
Supplementary Materials
SLO recording of an observer with AMD fixating on the cross for 30s. The pink and blue rectangles represent the location of the anatomical fovea and the averaged position of fixation (PRL), respectively.