

Abstract
Bromo and extra terminal (BET) proteins (BRD2, BRD3, BRD4 and BRDT) are transcriptional regulators required for efficient expression of several growth promoting and anti-apoptotic genes as well as for cell cycle progression. BET proteins are recruited to transcriptionally active chromatin via their two N-terminal bromodomains (BRDs), a protein interaction module that specifically recognizes acetylated lysine residues in histones H3 and H4. Inhibition of the BET-histone interaction results in transcriptional down-regulation of a number of oncogenes providing a novel pharmacological strategy for the treatment of cancer. Here we present a potent and highly selective dihydroquinazoline-2-one inhibitor, PFI-1 that efficiently blocks the interaction of BET BRDs with acetylated histone tails. Co-crystal structures showed that PFI-1 acts as an acetyl-lysine (Kac) mimetic inhibitor efficiently occupying the Kac binding site in BRD4 and BRD2. PFI-1 has antiproliferative effects on leukaemic cell lines and efficiently abrogates their clonogenic growth. Exposure of sensitive cell lines with PFI-1 results in G1 cell cycle arrest, down-regulation of MYC expression as well as induction of apoptosis and induces differentiation of primary leukaemic blasts. Intriguingly, cells exposed to PFI-1 showed significant down-regulation of Aurora B kinase, thus attenuating phosphorylation of the Aurora substrate H3S10 providing an alternative strategy for the specific inhibition of this well established oncology target.
Introduction
Bromodomains (BRDs) are protein interaction modules that specifically recognize ε-N-acetylated lysine residues (1, 2). BRDs are common interaction modules in nuclear proteins that regulate gene transcription and chromatin organization and play a key function recruiting these protein complexes to acetylated chromatin. Dysfunction of bromodomain containing proteins has been linked to the development of diverse diseases in particular to the development of cancer(3). Bromodomains are highly sequence diverse but they share a conserved fold that comprises a left handed bundle of 4 alpha helices (αZ, αA, αB, αC)(4). The acetyl-lysine side chain is typically anchored by a hydrogen bond to a conserved asparagine residue and water mediated interactions with a conserved tyrosine(2, 5). Crystal structures of BET complexes with di-acetylated histone 4 tail peptides showed that the first bromodomains of BRD4 and BRDT may accommodate two acetyl-lysines in a single binding site(2, 6).
The BET family of bromodomain proteins comprises 4 members in mammals (BRD2, BRD3, BRD4 and BRDT) each containing two conserved N-terminal bromodomains. BET proteins play critical roles in cellular proliferation and cell cycle progression(7). Genetic rearrangement of the BRD4 and BRD3 locus in which in-frame chimeric proteins of the N-terminal bromodomains of BRD4 or BRD3 with the protein NUT (nuclear protein in testis) give rise to the development of NUT midline carcinoma (NMC), an incurable uniformly fatal subtype of squamous carcinoma(8). BRD4 has been shown to be critical for survival of a number of diverse tumours due to its function promoting transcription of growth promoting and anti-apoptotic genes(9) which prompted the development of potent and selective protein interaction inhibitors targeting BET bromodomains. The potent pan-BET inhibitors (+)-JQ1 and GSK1210151A (I-BET151) have demonstrated significant antitumor activity in murine models of NUT midline carcinoma(10), multiple myeloma(11), acute myeloid leukaemia (AML)(12) and mixed lineage leukaemia(13). Genetic knockdown by RNAi or exposure of cells with BET inhibitors resulted in a significant transcriptional down regulation of MYC(11).
In contrast to most transcriptional regulators that dissociate from chromatin during mitosis, BRD4 preferentially associates with mitotic chromosomes(14) “bookmarking” G1 and growth associated genes for efficient post-mitotic transcription, providing a mechanism for transcriptional memory during cell division(15). BRD4 knockdown in primary human keratinocytes by RNAi results in severe cytokinesis defects and down-regulation of Aurora B expression. Aurora kinases (A, B and C) are essential for mitotic entry and progression(16). The A and B isoforms play distinct roles during mitosis: Aurora A is required for mitotic spindle assembly during pro and metaphase while Aurora B is part of the mitotic passenger complex mediating chromosome segregation by ensuring proper bi-orientation of sister chromatids during meta and anaphase(17, 18). Both Aurora isoforms are highly expressed in cancer, augment Ras-induced transformation and have therefore emerged as attractive therapeutic targets(19, 20). Interestingly, transcription of Aurora A and B is strongly up-regulated by the BRD4 target gene Myc while in turn Aurora kinases also have a critical function in regulating c-Myc turnover by regulating protein stability, suggesting that activity of these growth promoting proteins is tightly regulated by a feedback loop(21).
Here we describe a novel highly potent inhibitor PFI-1 that selectively targets BET bromodomains. PFI-1 binds to BET bromodomains with low nM potency and is chemically distinct from previously reported BET inhibitors. Exposure of leukaemia cells to PFI-1 results in induction of caspase dependent apoptosis, differentiation and in down-regulation of the Aurora B kinase. This highly selective chemical probe provides a versatile tool for further validation of BRD4 in cancer and other diseases and suggests synergism between two major oncogenes, c-Myc and Aurora B that can be simultaneously targeted by selective BET inhibition.
Methods
BRD2, BRD3, BRD4, BRDT and CREBBP bromodomains were cloned, expressed and purified as previously described(10). For biotin labelling, CREBBP (R1081-G1198) and BRD2 (K71-N195) were subcloned into pNIC-BIO1 (Gene Bank: EF198106) and expressed in BL21 (DE3)-R3-BirA. D-Biotine was dissolved into 10 mM bicine pH 8.3 and added to the culture at 500 μM final. Biotinylated protein was immobilized on Super Streptavidin Biosensors using 50 mM HEPES pH 7.4, 100 mM NaCl, 0.01 % Tween.
Isothermal titration calorimetry, temperature shift assays and fluorescence recovery after photobleaching were carried out as previously described(22). All cell lines were obtained from ATCC and were cultured in RPMI-1640 medium (Sigma) containing 10 % fetal bovine serum (FBS). In vitro cytotoxicity assays were performed in triplicate using either Cell-Titer-Glo reagent (Promega) or WST-1 (Roche) according to instructions provided by the vendor.
CD34+ human hematopoietic stem cells, obtained from peripheral blood of healthy patients, were plated in methylcellulose (StemAlpha) supplemented with human cytokines (H4535, Stem Cell Technologies) at a cell dose of 1 x 10³ per plate.
B-ALL primagraft
NOG mice were engrafted with B-ALL primary blasts t(1,19)+ using a sample obtained from a 9 year old child with high risk B-ALL. The engraftment process was monitored by staining peripheral blood samples for human CD45 and mouse CD45. At 5 weeks hCD45 was at least 1% and a treatment cycle was initiated by injection of 50 mg/kg (+)-JQ1 four times per week into the peritoneum (IP), for 3 weeks. Bone marrow was extracted from the femur of (+)-JQ1 and vehicle (DMSO) treated mice, fixed in 10% formalin and mounted in paraffin blocks.
Fixation, immunostaining and confocal microscopy
Approximately 5 x 10⁴ cells were used for each cytospot. Cells were centrifuged at 500 rpm for 5 min using a Cytospin 3 SHANDON cytocentrifuge. Fixation of the cells was performed with 4 % paraformaldehyde solution in PBS. Incubation was performed for 16h at 4 °C in 0.3 % Triton X-100, 0.5 % BSA and the indicated primary antibody. After washing, cells were incubated with the secondary antibody for 2 h. Cells were washed and a cover slip was placed on top by adding a droplet of mounting solution (Clear-Mount, Invitrogen). Confocal fluorescence images were obtained by a LSM710 microscope (Zeiss).
Chromatin immunoprecipitation
ChIP assays were performed using the EZ-ChIP™ kit by Millpore according to the manufacture’s protocol. Results were quantified both by semi-quantitative and quantitative PCR, performed using Terra qPCR Direct SYBR Premix (Clonetech) on an ABI 7900HT.
Results
In a screen for putative acetyl-lysine mimetic compounds we identified the simple fragment 6-bromo-3-methyl-3,4-dihydroquinazoline-2-one as a BRD4 and CREBBP bromodomain inhibitor. This inhibitor displaced tetra-acetylated histone 4 peptides in ALPHA (Amplified Luminescent Proximity Homogeneous Assay) screen assays with an IC50 value of approximately 50 μM for the first domain of BRD4 (BRD4(1)). Expansion of this scaffold resulted in a series of highly potent and specific benzenesulfonamide-quinazolin-2-one BET inhibitors. PFI-1 was selected as one of the most potent and selective compounds of about 300 inhibitors profiled in ALPHA screen assays (Figure 1A). The inhibitor was synthesized as outlined in Supplemental Figure-S1. Structure activity relationship (SAR) of this class of compounds will be described elsewhere(23).
Figure 1. Potency and selectivity of PFI-1.

A.: Chemical structure of PFI-1. B.: Selectivity screening data of PFI-1 using temperature shift assays. Screened targets are highlighted in bold. Temperature shifts are indicated by red filled circles with increasing radii for higher Tm values as indicated in the figure. C.: Isothermal titration data measured on BRD4(1) (black) and BRD4(2) (red). Shown are heat effects for each injection and the normalized binding isotherms (insert) including the fitted function (solid line). D.: ALPHA-screen data measured using isolated bromodomains of BRD4(1) (red triangle) BRD4(2) (blue triangle) as well as the bromodomain of CREBBP (green circle). Fitted functions are show as solid lines.
PFI-1 is a potent and selective BET bromodomain inhibitor
ALPHA screen assays demonstrated that PFI-1 displaces histone 4 peptide acetylated at lysines K5, K8, K12 and K16 (H4K5acK8acK12acK16ac) with a potency (IC50) of 220 nM for BRD4(1) and 98 nM for BRD2(2). The tight interaction of PFI-1 with BET acetyl-lysine binding sites was confirmed by isothermal titration calorimetry (ITC) which revealed dissociation constants (KD) of PFI-1 of 47.4 ± 2.5 nM (BRD4(1)) and 194.9 ± 6 nM (BRD4(2)) for the two bromodomains present in BRD4. ITC titrations against BRDs of the BET family showed that PFI-1 bound with similar affinities (Figure 1B, Supplemental Table-S1). Binding of PFI-1 was strongly driven by large negative binding enthalpy change suggesting that polar interactions of PFI-1 with BET bromodomains are highly favourable. Interestingly, binding enthalpies (ΔH) were between -4 to -7 kcal/mol larger for N-terminal BET bromodomains. However, this large difference in favourable binding enthalpy was almost completely compensated by unfavourable changes in binding entropy (ΔS) resulting in similar binding constants. The largest difference in binding affinity (about 4 fold) was observed for the two bromodomains of BRD4.
Comprehensive screening of PFI-1 against 42 human bromodomains using temperature shift assays(10, 24) demonstrated high specificity of PFI-1 for the BET family of bromodomains (Figure 1C, Supplemental Table-S2). The largest ΔTm shift observed outside the BET family was 2.6°C for bromodomains present in the histone acetyl transferases CBP/EP300. The interaction with CBP was too weak for determination of an accurate IC50 value using ALPHA screen assays. However, we estimated an affinity of PFI-1 for CBP of approximately 11 μM using Bio-Layer Interferometry (Supplemental Figure-S2)(25) suggesting >300 fold selectivity over the two bromodomains that showed the largest ΔTm shift outside the BET bromodomain family. In comparison, BLI determined an affinity of 111 nM for BRD2(1) in agreement with ITC and ALPHA screen data. We also assessed activity of PFI-1 outside the bromodomain family. Screening against 38 protein kinases revealed no significant inhibitory activity of PFI-1. Similarly no significant activity was observed screening PFI-1 against 40 human kinases and 14 human membrane receptors (Supplemental Tables-S3 & S4).
PFI-1 binds to the acetyl-lysine binding site of BET bromodomains
Co-crystallization of PFI-1 with BRD4(1) revealed the binding mode of this highly specific BET bromodomain inhibitor. Crystals of the BRD4(1)/PFI-1 complex diffracted to high (1.52 Å) resolution providing a detailed view of the interactions formed by this inhibitor with the bromodomain acetyl-lysine binding site. Details on data collection and refinement are summarized in Supplemental Table-S5. The overall structure of the PFI-1 in complex with BRD4(1) revealed the typical helical fold and structural elements of bromodomains (Figure 2A) and comparison with the apo-structure (PDB-ID:2OSS) showed only minor structural rearrangements in the ZA-loop regions. The inhibitor and coordinating residues and water molecules were well defined by electron density (Figure 2B). PFI-1 showed an extraordinary shape complementarity with the Kac binding site. The quinazolinone carbonyl and nitrogen acted as a hydrogen bond donor/acceptor pair that interacted with the conserved asparagine N140. The quinazolinone carbonyl formed also a second water mediated hydrogen bond with the conserved residue Y97. The network of five tightly bound water molecules that are typically found at the base of bromodomain acetyl-lysine binding pocket was also conserved in the BRD4(1) PFI-1 complex. Comparison to BRD4(1) structures of di-acetylated peptide complexes(2) confirmed the acetyl-lysine mimetic binding mode of PFI-1 (Figure 2C). The carbonyl moieties of the quinazolinone and the acetyl-lysine are in similar position and mediate the same interactions in superimposition of both BRD4(1) ligand complexes. Superimposition with the BRD4(1)/(+)-JQ1 complex revealed a largely diverse binding mode. However, both complexes form an acetyl-lysine mimetic hydrogen bond to N140 as well as aromatic stacking and hydrophobic interactions with W81 and the shelf region of the acetyl-lysine binding site.
Figure 2. PFI-1 co-crystal structure with BRD4(1) and BRD2(2).

A.: Structural overview of the PFI-1/BRD4(1) complex. PFI-1 is shown in ball and stick representation. Hydrogen bonds to the conserved asparagine (N140) are shown as dotted lines and water molecules as semi-transparent spheres. B.: 2FoFc omit electron density map contoured at 2σ around the PFI-1. C.: Superimposition of the PFI-1 complex with the di-acetylated K5acK8ac peptide complex(2) (upper panel) and the BRD4(1)/(+)-JQ1 complex(10) (lower panel). D.: Surface representation of the BRD4(1) acetyl-lysine binding site. Residues that are different between first and second bromodomains are labelled in red and conserved residues in black, respectively. The conserved asparagine is highlighted in blue. E.: Surface representation of the BRD2(2) acetyl-lysine binding site. Residues were labelled using the same colour code as in D.
ITC data showed a significantly smaller binding enthalpy change to second bromodomains of BET family members and we were interested if the co-crystal structure of PFI-1 with a second bromodomain would explain these striking differences in the observed binding thermodynamics. Comparison of the structure of the PFI-1 complex of BRD4(1) and BRD2(2) showed that polar interaction of the inhibitor with BRD2(2) are less optimal (Figure 2D and 2E). The hydrogen bond between the quinazolinone NH with the conserved asparagine residue (N140 in BRD4(1) and N429 in BRD2(2)) is less favourable (distance of 3.3 Å) in the case of BRD2(2) when compared BRD4(1) (distance of 2.9 Å). In addition, the water mediated hydrogen bond between the sulfonamide NH function and the ZA loop backbone carbonyl observed in the BRD4(1) complex (3.2 Å) is further away from the bridging water molecule which was however still observed in the BRD2(2) co-crystal structure (3.8 Å). Interestingly, in contrast to (+)-JQ1 bromodomain complexes, H433 reoriented and flipped into the acetyl-lysine binding site to interact with the methoxybenzyl moiety of PFI-1. This large structural rearrangement may provide an explanation for the large difference in ΔS upon binding of PFI-1 to the first and second bromodomains. H433 is conserved in all second bromodomains whereas in N-terminal BET bromodomains this residue is always an aspartate (D144 in BRD4(1)). This difference in Kac site composition may be explored for the development of inhibitors that preferentially recognize either the first or second bromodomain.
PFI-1 displaces BRD4 from chromatin
To establish whether PFI-1 dissociates full-length BRD4 from acetylated chromatin in cells we developed fluorescence recovery after photo-bleaching (FRAP) experiments in human osteosarcoma cells (U2OS) transfected with GFP-BRD4. The utility of FRAP in assessing the diffusion of bromodomain-containing proteins tagged with fluorescent fusion partners and therefore providing evidence of the level of chromatin association has been previously established(22) and we have successfully utilized this method to demonstrate the on-target effect of the BET inhibitor JQ1 in BRD4 dependent NMC cell lines(10). Cells treated with 1 and 5 μM PFI-1 showed significantly faster fluorescent recovery times when compared to cells that have not been exposed to this inhibitor, suggesting that full–length BRD4 was displaced from chromatin in PFI-1 treated cells (Figure 3). Differences in fluorescent recovery time of PFI-1 treated cells were comparable with effects observed for the biochemically active (+)-JQ1 stereoisomer.
Figure 3. FRAP data demonstrating dissociation of GFP-BRD4 from chromatin.

A.: Nuclei of PFI-1 treated (upper panel) and untreated (lower panel) cells. The bleached area is indicated by a read polygon. B.: Time dependence of fluorescent recovery in the bleached area for DMSO, (+)-JQ1 and PFI-1 (1, 5 μM) treated cells. C.: Half times of fluorescence recovery of DMSO, (+)-JQ1 and PFI-1 (1, 5 μM) treated cells. The data shown represent the average values of 20 experiments.
PFI-1 inhibits proliferation of a subset of leukaemic cells
We used a luminescent ATP-based cytotoxicity assay to examine the sensitivity of a panel of established leukaemia cell lines to PFI-1 in a dose dependent manner (Table I). In agreement with earlier studies we found that cell lines carrying oncogenic rearrangements in the MLL locus(26) such as MV4;11 (MLL-AF4), NOMO-1 (MLL-AF9), SEMKH2 (MLL-AF4) RS4;11 (MLL-AF4) or THP-1 (MLL-AF9) were highly sensitive to BET inhibition(12, 13, 27). Comparable activity was also observed for the AML1-ETO fusion oncogenes bearing AML cell line Kasumi. Significantly less sensitive (5–10μM) was the acute lymphoblastic leukaemia (ALL) derived cell line KOCL-45 despite its MLL-AF4 rearrangement and the human histiocytic lymphoma cell line U937. No significant activity was detected for K-562 (BCR-ABL positive blast crisis chronic myelogenous leukaemia (CML)) and PL-21 (AML) demonstrating that the growth inhibition observed in certain leukaemia cell lines is not due to a general cytotoxicity of PFI-1. However, the activity of PFI-1 on cell proliferation of leukaemia cell lines was between 5- and 10-fold weaker than that observed for the pan-BET inhibitor (+)-JQ1.
Table 1.
Sensitivity of leukaemic cell lines to PFI-1
| Cell line | Cell type | GI50[μM] |
|---|---|---|
| MV4;11 | childhood B-cell myelomonocytic acute leukaemia (MLL/AF4) | 1.5 ± 1 |
| THP-1 | acute monocytic leukaemia (MLL/AF9) | 4 ± 2 |
| KASUMI-1 | acute myeloid leukaemia with t(8;21) translocation (AML1-ETO) | 0.8 ± 1 |
| NALM-17 | Pre B-blast ALL | 8 ± 4 |
| TOM-1 | Ph1-positive acute lymphoblastic leukaemia (ALL) | 3 ± 5 |
| REH | adult acute lymphoblastic leukaemia (ALL) | 9 ± 4 |
| SD-1 | Epstein-Barr virus immortalised Ph-1 positive ALL | 8 ± 3 |
| NALM-6 | pre-B acute lymphoblastic leukaemia (t(5; 12)(q33; p13)) | 8 ± 3 |
| NOMO-1 | acute monocytic leukaemia (MLL/AF9) | 3 ± 3 |
| SEMKH2 | acute monocytic leukaemia (MLL/AF9) | 2 ± 2 |
| RS4;11 | acute monocytic leukaemia (MLL/AF4) | 2 ± 2 |
| KOCL-45 | acute monocytic leukaemia (MLL/AF4) | 10 ± 5 |
| U937 | leukaemic monocytic lymphoma | 5 ± 3 |
| PL21 | acute promyelolytic leukaemia | 10 ± 5 |
| SUPB-15 | Ph+ childhood B-cell ALL | 11 ± 4 |
| K-562 | erythroleukaemia CML blast (Bcr-ABL) | >20 |
We also investigated the efficiency of PFI-1 to suppress the clonogenic growth of leukaemic cells in methylcellulose. In agreement with the cytotoxicity assays in liquid culture we observed strong ablation of clonogenic growth in the PFI-1 sensitive cell lines MV4;11 and THP-1 (Figure 4). However, clonogenic growth of human CD34 positive human haematopoietic stem cells from two different healthy donors was also significantly impaired. Interestingly, colony formation of the PFI-1 insensitive cell line K562 was not affected, but exposure to PFI-1 did significantly reduce cell numbers suggesting that growth is still compromised in this cell line. This effect was also observed using (+)-JQ1 (Figure 4D–F). The sensitivity of cell lines to BET dependent growth inhibition was independent of BRD4 mRNA expression levels. We performed qRT-PCR experiments quantifying the levels of the two main BRD4 isoforms (long (GI:19718731) and short (GI:7657218)). We found comparable levels of the short BRD4 isoforms in all cell lines. mRNA expression levels of the long isoform were particularly high in K-562 and THP-1 cells (Supplemental Figure-S3).
Figure 4. Effects of PFI-1 on cell survival and clonogenic growth.

A.: Dose response of cell survival of MV4;11 and K-562 cell lines in the presence of PFI-1 and (+)-JQ1 (B). C.: Effects of PFI-1 on clonogenic growth of MV4;11 and human CD34+ stem cells (HSC) and K-562 cells (D). E.: Bar diagram showing the number of colonies or cells (F) measured in clonogenic growth assays of leukaemic cells and HSCs. The measurements have been carried out in duplicates. However, due to variations of the colony numbers obtained from different donors only one set of data is shown for CD34+ stem cells.
PFI-1 induces cell cycle arrest and apoptosis in sensitive cell lines
Annexin V staining combined with FACS analysis established strong induction of apoptosis by BRD4 knockdown or chemical inhibition of BET proteins(12, 13, 27). Here we were interested to characterize the mechanism of PFI-1 induced apoptosis using Western blot analysis of proteins known to play key roles in apoptosis. In the BET inhibitor sensitive cell line MV4;11 we observed strong induction of PARP1 and pro-caspase 7 cleavage after 24 h exposure with PFI-1, whereas protein levels as well as the phosphorylation state of the pro-apoptotic protein BAD were unaffected. In contrast, neither PARP1 nor pro-caspase 7 cleavage was observed in the PFI-1 insensitive cell line K-562 (Figure 5). In agreement with earlier studies using (+)-JQ1 we also detected significantly lower c-Myc protein levels in PFI-1 treated MV4;11 cells, but only a minor reduction in c-Myc levels was observed in K-562 cells(12, 27). This analysis demonstrates that the canonical caspase-induced apoptotic pathway is activated in cell lines that are sensitive to BET bromodomain inhibition by low molecular weight inhibitors. As predicted from RNAi knock down studies and studies on (+)-JQ1(10) that demonstrated a key role of BRD4 in cell cycle progression we found that exposure of cells sensitive to PFI-1 cause cell cycle arrest. In contrast, the cell cycle in PFI-1 insensitive cell lines (K-562) was not affected as demonstrated by flow cytometry (Supplemental Figure-S4). Since c-Myc drives expression of a number of genes that are essential for cell cycle progression (e.g. E2Fs, CDC25A, CDK2, CDK4, and Rb) the observed G1/S arrest might be a consequence of c-Myc depletion in sensitive MV4;11 but not K-562 cells(28–31).
Figure 5. Western Blots demonstrating induction of apoptosis and downregulation of c-Myc in MV4;11 but not K-562 cells.
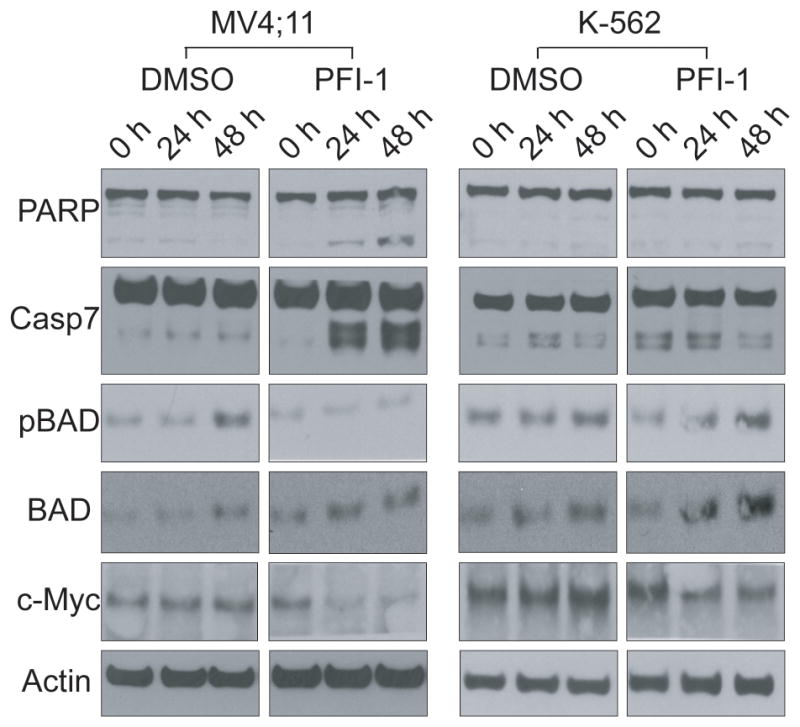
Shown are western blot data on the BET inhibitor sensitive cell line MV4;11 and the insensitive cell line K-562 (cleavage of pro-caspase 7, PARB activation, BAD phosphorylation and c-Myc downregulation) using cell extracts of PFI-1 treated cells with after 0, 24 and 48h incubation times.
PFI-1 down regulates Aurora B and attenuates H3S10 phosphorylation
BRD4 is one of the few transcriptional regulators that are recruited to chromatin during mitosis providing a mechanism for transcriptional memory during cell division(14, 15, 22). Mitotic entry and progression are principally regulated by serine/threonine kinases of the Aurora family(16). Aurora kinases are highly expressed in diverse cancer types and are also frequently up-regulated in leukaemia(32, 33). In addition, Aurora B expression levels are modulated by BRD4 and are stimulated by c-Myc while c-Myc stability is regulated by Aurora kinase dependent degradation(21). We were therefore interested to study if inhibition of BET bromodomains by the inhibitors PFI-1 and (+)-JQ1 would affect Aurora B protein levels resulting in indirect inhibition of the Aurora B oncogene.
We found high expression levels in Western blots using Aurora B specific antibodies in both MV4;11 and K-562 cells (Figure 6A). Aurora B often appeared as a double band possibly due to different phosphorylation states of the protein. Exposure of these cells to PFI-1 and (+)-JQ1 resulted in significant reduction of Aurora B protein levels after 8 h exposure in the BET inhibitor sensitive cell line MV4;11. In K-562 cells, a reduction of Aurora B has been observed after 4h but the protein levels were increased again after 8h. This is likely due to differences of BET inhibitors on Aurora-B mRNA expression and Aurora-B degradation in these two cell lines. As a consequence of Aurora B down-regulation we observed significantly reduced phosphorylation of the Aurora substrate histone 3 S10 (H3S10) in cells stained with H3S10p specific antibodies (Figure 6B); H3S10 phosphorylation was completed ablated in Western blots (Figure 6C) in MV4;11 cells. Immunocytochemistry and Western blots demonstrated that reduction of H3S10 phosphorylation levels were significantly less dramatic in K-562 cells than observed in MV4;11 cells. In conclusion, BRD4 inhibition results in significant Aurora B inactivation offering an alternative strategy for inhibition of this attractive kinase target.
Figure 6. Downregulation of Aurora B.

A.: Western blot analysis of Aurora B expression in MV4;11 and K-562 cells treated with PFI-1 and (+)-JQ1. B: Immunohistochemistry showing reduction of phosphorylation of the Aurora B substrate H3S10. DNA is stained with DAPI. C.: Western blot analysis of phosphor H3S10 after PFI-1 and (+)-JQ1 treatment of MV4;11 and K-562 cells.
Synthetic lethality of BET and Aurora kinase inhibition
Since efficacious killing of tumour cells by Aurora inhibitors is often constrained by dose limiting toxicity we were interested if dual inhibition of BET proteins and Aurora kinases would be synergistic. We selected for these studies the potent and reversible small-molecule Aurora inhibitor VX-680 (MK-0457) that inhibits all three Aurora kinase isoforms with low nM potency (0.6, 18 and 4.6nM for Aurora-A, Aurora-B and Aurora-C, respectively). This inhibitor has demonstrated in vivo efficacy in xenograft models of in human AML and other cancers and has entered clinical testing(34–37). Aurora kinases interact with many key regulators of the cell cycle and cell survival, including p53, cyclin B, and Cdc2. As a consequence, inhibition of Aurora kinases affects different stages of the cell cycle: Aurora-A inhibition has been associated with G2/M phase arrest, whereas Aurora-B inhibition leads to failure in cell division, abnormal exit from mitosis, polyploidy cells and ultimately induction of apoptosis. We observed at low inhibitor concentration (lower then 20nM) cell cycle arrest in G2/M phase consisted with Aurora-A inhibition. A higher concentration, VX680 caused predominantly G0/G1 arrest. Apoptosis was observed at concentrations higher than 160nM (Supplemental Figure-S5). Interestingly, combination PFI-1 or (+)-JQ1 and VX-680 at concentration that do not cause observable toxicity as single agents led to strong cancer cell toxicity (Figure 7A). Intriguingly, the optimal concentration of VX-680 was 40nM for both BET inhibitors tested. At this concentration the G2/M arrest observed at lower VX-680 is release leading to sensitization of the tested cell lines to dual Aurora and BET inhibition. At higher VX-680 concentration however this synergistic effect is lost. It is therefore likely that the strong induction of apoptosis at 40nM VX-680 with both BET inhibitors is highly dependent on differences in BET dependent gene expression and cell cycle effects induced by Aurora kinase inhibitors. No synergy between VX-680 and BET inhibitors was observed in K-562 cells that are insensitive to BET inhibition (data not shown).
Figure 7. Synergy of BET and Aurora inhibition in vitro and in vivo and effects on HOXA9 expression.

A: Cytotoxicity of MV4;11 cells using combinations of BET inhibitors (PFI-1, JQ1) and the pan-Aurora inhibitor VX-680. Values shown represent data from four independent experiments.
B.: Staining for Aurora B and c-Myc of bone marrow extracted from JQ1 and vehicle treated BALL bearing mice. C.: Chromatin immunoprecipitation (ChIP) of BRD4 binding to the HOXA9 promoter, THP-1 cells were treated with either vehicle (DMSO) or PFI-1. D.: qRT-PCR of HOXA9 levels in K-562 and MV4;11 cells. E.: MLL-AF9 murine leukaemic blast cells treated with vehicle (DMSO) and PFI-1.
BET inhibition causes downregulation of Aurora B in vivo
To study down-regulation of Aurora-B in vivo we established a xenograft model of high risk primary childhood B-cell ALL. Pharmacokinetics studies in mice suggested that the necessary effective dose of PFI-1 cannot be obtained in vivo(23) which prevented us from using PFI-1 for long term in vivo studies in mice and (+)-JQ1 was therefore used. Engraftment was monitored by staining peripheral blood samples for human CD45 and mouse CD45. After 5 weeks of engraftment in NOG mice the level of hCD45 was at least 1% and mice were treated for 3 weeks with 50 mg/kg (+)-JQ1 as described(10). Bone marrow was extracted from the femur of tumour bearing mice and stained with specific anti-bodies for Aurora-B and c-Myc. The immunofluorescent images revealed strong down-regulation of both Aurora-B as well as c-Myc (Figure 7B) demonstrating that BET inhibition significantly reduces Aurora-B levels in this in vivo model.
PFI-1 and JQ1 dissociate BRD4 from HOXA9 and promotes differentiation
Evolutionarily conserved HOX genes are transcription factors that play an important role during hematopoiesis in regulating apoptosis, receptor signalling, differentiation, motility and angiogenesis. Aberrant expression of HOX genes has been implicated in development of leukaemia and other cancers(38–40). During hematopoietic cell development, clusters of HOX genes are highly expressed in primitive hematopoietic cells and in poorly differentiated leukaemic cells whereas they are largely down-regulated in differentiated cells. In particular HOXA9 has been identified as a marker of poor prognosis in patients with acute myeloid leukaemia(41) and overexpression of HOXA9 leads to immortalization of bone marrow cells and development of leukaemia in mice(42). We were therefore interested if BRD4 inhibition directly influences HOXA9 expression and induces differentiation of primary blast cells. Chromatin immunoprecipitation assays (ChIP) showed that both (+)-JQ1 as well as PFI-1 displace BRD4 from the HOXA9 promoter region (Figure 7C, Supplemental Figure-S6). Q-PCR showed that HOXA9 mRNA is up-regulated after 4 h but strongly down-regulated after incubation times of 8 h and 24 h in PFI-1 treated MV4;11 cells but not in BET inhibitor insensitive K-562 cells that follow however the same bi-phasic pattern of the detected mRNA levels (Figure 7D). The delayed response of HOXA9 transcriptional down-regulation suggests an indirect mechanism that is possibly regulated by reduced c-Myc levels. Since PFI-1 inhibits all BET family members differences in BET protein levels or levels of the target genes may result in the different overall response of HOXA9 expression in these two cell lines. In agreement with the known key function of HOXA9 in suppressing differentiation, murine MLL-AF9 leukaemic blasts treated with PFI-1 showed rapid differentiation into cells with polymorphonuclear neutrophil like appearances (Figure 7E).
Discussion
This study presents a chemically diverse BET inhibitor PFI-1 with high potency and selectivity for this subfamily of bromodomain containing proteins. Here we used PFI-1 to study the role of BET proteins in acute leukaemia and in regulating HOXA9 expression as well as Aurora B kinase activity. Inhibition of BET bromodomains results in the change of transcription of diverse target genes, many of them linked to cellular proliferation and prevention of apoptosis. The set of BET regulated target genes is highly correlated in sensitive cell lines. For instance, in the study by Dawson et al(13) the top 100 genes that were found to be decreased in the sensitive MLL cell lines MOLM-13 and MV4;11 overlapped and contained many known MLL target genes such as key regulators of proliferation (MYC, CDK6) and anti-apoptotic genes (BCL2) suggesting that BET proteins are required for efficient expression of genes driven by oncogenic MLL-fusion proteins. Expression of these genes was less affected in inhibitor insensitive K-562 cells expressing the BCR-ABL fusion gene product. A recent study by Mertz et al. demonstrated that MYC expression was affected by BET inhibition only in the context of natural, chromosomally translocated or amplified gene loci but not if expression is driven by non-endogenous promoters or viral insertions providing a possibility for stratification for BET sensitive cancer types(27).
In this study we also demonstrated that BET inhibition results in significant down-regulation of Aurora B kinase in vitro as well as in vivo. However, if Aurora B expression is directly mediated by BET or indirectly through down-regulation of MYC expression remains to be shown. A recent report showed that knockdown of the BET family member BRD4 results in downregulation of Aurora B expression whereas exogenous overexpression of BRD4 increases Aurora B protein levels(43). In synchronized cells, Aurora B protein levels have been significantly reduced during mitosis after RNAi knockdown of BRD4(43) and abnormal chromosomal segregation has been observed in BRD4 depleted primary human foreskin keratinocytes leading to high frequency of binuclear tetraploid and octoploid nuclei(43). Aurora B activity is also tightly linked to c-Myc function. Yang et al demonstrated recently that the pan-Aurora inhibitor VX-680 preferentially kills cells that overexpress c-Myc(44) and that both oncogenes are frequently amplified in colorectal carcinomas and medulloblastomas(45, 46). Here we showed that VX-680 inhibition is strongly synergistic with BET inhibition showing effective induction of apoptosis at concentration that did not show any cytotoxic effects of the single agents. Interestingly, synergism of VX-680 has also been observed with the HDAC inhibitor vorinostat as a result of reactivated pro-apoptotic genes and enhanced cancer cell death. It is likely that suppression of anti-apoptotic and re-activation of pre-apoptotic genes that have been reported for BET inhibitors(13) leads to the strong induction of apoptosis that have been observed in our synergy study.
The eight bromodomains present in the four human BET family members share high sequence similarity in their acetyl-lysine binding sites making the design of target selective inhibitors a challenging task. While we believe that it will be difficult to achieve high selectivity for any of the isoforms we observed that all first and second bromodomains contain a set of diverse residues. These differences could be explored for the development of subdomain specific inhibitors which is an on-going research activity in our laboratory.
Supplementary Material
Acknowledgments
JME, JW and SK are grateful are supported by the SGC, a registered charity (number 1097737) that receives funds from the Canadian Institutes for Health Research, the Canada Foundation for Innovation, Genome Canada, GlaxoSmithKline, Pfizer, Eli Lilly, Takeda, AbbVie, the Novartis Research Foundation, the Ontario Ministry of Research and Innovation and the Wellcome Trust. PF is supported by a Wellcome Trust Career-Development Fellowship (095751/Z/11/Z). J.S. was supported by the Gertrude von Meissner Foundation, the Swiss National Research Foundation (SNF, 31003A-130661), the Swiss Cancer League (OCS-02357-2009), and the Swiss Bridge Award.
Footnotes
Data deposition: The crystal structures reported in this paper have been deposited in the Protein Data Bank, www.pdb.org.
Conflict of Interest: None of the authors disclose any potential conflict of interest.
References
- 1.Mujtaba S, He Y, Zeng L, Farooq A, Carlson JE, Ott M, et al. Structural basis of lysine-acetylated HIV-1 Tat recognition by PCAF bromodomain. Mol Cell. 2002;9:575–86. doi: 10.1016/s1097-2765(02)00483-5. [DOI] [PubMed] [Google Scholar]
- 2.Filippakopoulos P, Picaud S, Mangos M, Keates T, Lambert JP, Barsyte-Lovejoy D, et al. Histone recognition and large-scale structural analysis of the human bromodomain family. Cell. 2012;149:214–31. doi: 10.1016/j.cell.2012.02.013. [DOI] [PMC free article] [PubMed] [Google Scholar]
- 3.Muller S, Filippakopoulos P, Knapp S. Bromodomains as therapeutic targets. Expert Rev Mol Med. 2011;13:e29. doi: 10.1017/S1462399411001992. [DOI] [PMC free article] [PubMed] [Google Scholar]
- 4.Dhalluin C, Carlson JE, Zeng L, He C, Aggarwal AK, Zhou MM. Structure and ligand of a histone acetyltransferase bromodomain. Nature. 1999;399:491–6. doi: 10.1038/20974. [DOI] [PubMed] [Google Scholar]
- 5.Owen DJ, Ornaghi P, Yang JC, Lowe N, Evans PR, Ballario P, et al. The structural basis for the recognition of acetylated histone H4 by the bromodomain of histone acetyltransferase gcn5p. Embo J. 2000;19:6141–9. doi: 10.1093/emboj/19.22.6141. [DOI] [PMC free article] [PubMed] [Google Scholar]
- 6.Moriniere J, Rousseaux S, Steuerwald U, Soler-Lopez M, Curtet S, Vitte AL, et al. Cooperative binding of two acetylation marks on a histone tail by a single bromodomain. Nature. 2009;461:664–8. doi: 10.1038/nature08397. [DOI] [PubMed] [Google Scholar]
- 7.Dey A, Mochizuki K, Ozato K. Reduced expression of bromodomain protein Brd4 impedes Rb inactivation add S phase entry. Molecular Biology of the Cell. 2004;15:254a-a. [Google Scholar]
- 8.French CA. Pathogenesis of NUT midline carcinoma. Annu Rev Pathol. 2012;7:247–65. doi: 10.1146/annurev-pathol-011811-132438. [DOI] [PubMed] [Google Scholar]
- 9.Rahl PB, Lin CY, Seila AC, Flynn RA, McCuine S, Burge CB, et al. c-Myc Regulates Transcriptional Pause Release. Cell. 2010;141:4323–445. doi: 10.1016/j.cell.2010.03.030. [DOI] [PMC free article] [PubMed] [Google Scholar]
- 10.Filippakopoulos P, Qi J, Picaud S, Shen Y, Smith WB, Fedorov O, et al. Selective inhibition of BET bromodomains. Nature. 2010;468:1067–73. doi: 10.1038/nature09504. [DOI] [PMC free article] [PubMed] [Google Scholar]
- 11.Delmore JE, Issa GC, Lemieux ME, Rahl PB, Shi J, Jacobs HM, et al. BET Bromodomain Inhibition as a Therapeutic Strategy to Target c-Myc. Cell. 2011;146:904–17. doi: 10.1016/j.cell.2011.08.017. [DOI] [PMC free article] [PubMed] [Google Scholar]
- 12.Zuber J, Shi J, Wang E, Rappaport AR, Herrmann H, Sison EA, et al. RNAi screen identifies Brd4 as a therapeutic target in acute myeloid leukaemia. Nature. 2011 doi: 10.1038/nature10334. [DOI] [PMC free article] [PubMed] [Google Scholar]
- 13.Dawson MA, Prinjha RK, Dittmann A, Giotopoulos G, Bantscheff M, Chan WI, et al. Inhibition of BET recruitment to chromatin as an effective treatment for MLL-fusion leukaemia. Nature. 2011;478:529–33. doi: 10.1038/nature10509. [DOI] [PMC free article] [PubMed] [Google Scholar]
- 14.Dey A, Chitsaz F, Abbasi A, Misteli T, Ozato K. The double bromodomain protein Brd4 binds to acetylated chromatin during interphase and mitosis. Proc Natl Acad Sci U S A. 2003;100:8758–63. doi: 10.1073/pnas.1433065100. [DOI] [PMC free article] [PubMed] [Google Scholar]
- 15.Dey A, Nishiyama A, Karpova T, McNally J, Ozato K. Brd4 marks select genes on mitotic chromatin and directs postmitotic transcription. Mol Biol Cell. 2009;20:4899–909. doi: 10.1091/mbc.E09-05-0380. [DOI] [PMC free article] [PubMed] [Google Scholar]
- 16.Andrews PD, Knatko E, Moore WJ, Swedlow JR. Mitotic mechanics: the auroras come into view. Curr Opin Cell Biol. 2003;15:672–83. doi: 10.1016/j.ceb.2003.10.013. [DOI] [PubMed] [Google Scholar]
- 17.Nezi L, Musacchio A. Sister chromatid tension and the spindle assembly checkpoint. Curr Opin Cell Biol. 2009;21:785–95. doi: 10.1016/j.ceb.2009.09.007. [DOI] [PubMed] [Google Scholar]
- 18.Lampson MA, Cheeseman IM. Sensing centromere tension: Aurora B and the regulation of kinetochore function. Trends Cell Biol. 2011;21:133–40. doi: 10.1016/j.tcb.2010.10.007. [DOI] [PMC free article] [PubMed] [Google Scholar]
- 19.Lens SM, Voest EE, Medema RH. Shared and separate functions of polo-like kinases and aurora kinases in cancer. Nat Rev Cancer. 2010;10:825–41. doi: 10.1038/nrc2964. [DOI] [PubMed] [Google Scholar]
- 20.Dar AA, Goff LW, Majid S, Berlin J, El-Rifai W. Aurora kinase inhibitors--rising stars in cancer therapeutics? Mol Cancer Ther. 2010;9:268–78. doi: 10.1158/1535-7163.MCT-09-0765. [DOI] [PMC free article] [PubMed] [Google Scholar]
- 21.Otto T, Horn S, Brockmann M, Eilers U, Schuttrumpf L, Popov N, et al. Stabilization of N-Myc is a critical function of Aurora A in human neuroblastoma. Cancer Cell. 2009;15:67–78. doi: 10.1016/j.ccr.2008.12.005. [DOI] [PubMed] [Google Scholar]
- 22.Dey A, Ellenberg J, Farina A, Coleman AE, Maruyama T, Sciortino S, et al. A bromodomain protein, MCAP, associates with mitotic chromosomes and affects G(2)-to-M transition. Mol Cell Biol. 2000;20:6537–49. doi: 10.1128/mcb.20.17.6537-6549.2000. [DOI] [PMC free article] [PubMed] [Google Scholar]
- 23.Fish PV, Filippakopoulos P, Bish G, Brennan PE, Bunnage ME, Cook AS, et al. Identification of a Chemical Probe for Bromo and Extra C-Terminal Bromodomain Inhibition through Optimization of a Fragment-Derived Hit. J Med Chem. 2012;55:9831–7. doi: 10.1021/jm3010515. [DOI] [PMC free article] [PubMed] [Google Scholar]
- 24.Fedorov O, Marsden B, Pogacic V, Rellos P, Muller S, Bullock AN, et al. A systematic interaction map of validated kinase inhibitors with Ser/Thr kinases. Proc Natl Acad Sci U S A. 2007;104:20523–8. doi: 10.1073/pnas.0708800104. [DOI] [PMC free article] [PubMed] [Google Scholar]
- 25.Rich RL, Myszka DG. Higher-throughput, label-free, real-time molecular interaction analysis. Anal Biochem. 2007;361:1–6. doi: 10.1016/j.ab.2006.10.040. [DOI] [PubMed] [Google Scholar]
- 26.Drexler HG, Quentmeier H, MacLeod RA. Malignant hematopoietic cell lines: in vitro models for the study of MLL gene alterations. Leukemia. 2004;18:227–32. doi: 10.1038/sj.leu.2403236. [DOI] [PubMed] [Google Scholar]
- 27.Mertz JA, Conery AR, Bryant BM, Sandy P, Balasubramanian S, Mele DA, et al. Targeting MYC dependence in cancer by inhibiting BET bromodomains. Proc Natl Acad Sci U S A. 2011;108:16669–74. doi: 10.1073/pnas.1108190108. [DOI] [PMC free article] [PubMed] [Google Scholar]
- 28.Galaktionov K, Chen X, Beach D. Cdc25 cell-cycle phosphatase as a target of c-myc. Nature. 1996;382:511–7. doi: 10.1038/382511a0. [DOI] [PubMed] [Google Scholar]
- 29.Mateyak MK, Obaya AJ, Sedivy JM. c-Myc regulates cyclin D-Cdk4 and -Cdk6 activity but affects cell cycle progression at multiple independent points. Mol Cell Biol. 1999;19:4672–83. doi: 10.1128/mcb.19.7.4672. [DOI] [PMC free article] [PubMed] [Google Scholar]
- 30.Hermeking H, Rago C, Schuhmacher M, Li Q, Barrett JF, Obaya AJ, et al. Identification of CDK4 as a target of c-MYC. Proc Natl Acad Sci U S A. 2000;97:2229–34. doi: 10.1073/pnas.050586197. [DOI] [PMC free article] [PubMed] [Google Scholar]
- 31.O’Donnell KA, Wentzel EA, Zeller KI, Dang CV, Mendell JT. c-Myc-regulated microRNAs modulate E2F1 expression. Nature. 2005;435:839–43. doi: 10.1038/nature03677. [DOI] [PubMed] [Google Scholar]
- 32.Careta FP, Gobessi S, Panepucci RA, Bojnik E, de Oliveira FM, Matos DM, et al. The Aurora A and B kinases are upregulated in bone marrow-derived chronic lymphocytic leukemia cells and represent potential therapeutic targets. Haematologica. 2012;97:1246–54. doi: 10.3324/haematol.2011.054668. [DOI] [PMC free article] [PubMed] [Google Scholar]
- 33.Nagai K, Ochi T, Fujiwara H, An J, Shirakata T, Mineno J, et al. Aurora kinase A-specific T-cell receptor gene transfer redirects T lymphocytes to display effective antileukemia reactivity. Blood. 2012;119:368–76. doi: 10.1182/blood-2011-06-360354. [DOI] [PubMed] [Google Scholar]
- 34.Bebbington D, Binch H, Charrier JD, Everitt S, Fraysse D, Golec J, et al. The discovery of the potent aurora inhibitor MK-0457 (VX-680) Bioorg Med Chem Lett. 2009;19:3586–92. doi: 10.1016/j.bmcl.2009.04.136. [DOI] [PubMed] [Google Scholar]
- 35.Harrington EA, Bebbington D, Moore J, Rasmussen RK, Ajose-Adeogun AO, Nakayama T, et al. VX-680, a potent and selective small-molecule inhibitor of the Aurora kinases, suppresses tumor growth in vivo. Nat Med. 2004;10:262–7. doi: 10.1038/nm1003. [DOI] [PubMed] [Google Scholar]
- 36.Elkins JM, Santaguida S, Musacchio A, Knapp S. Crystal structure of human aurora B in complex with INCENP and VX-680. J Med Chem. 2012;55:7841–8. doi: 10.1021/jm3008954. [DOI] [PMC free article] [PubMed] [Google Scholar]
- 37.Kitzen JJ, de Jonge MJ, Verweij J. Aurora kinase inhibitors. Crit Rev Oncol Hematol. 2010;73:99–110. doi: 10.1016/j.critrevonc.2009.03.009. [DOI] [PubMed] [Google Scholar]
- 38.Sauvageau G, Lansdorp PM, Eaves CJ, Hogge DE, Dragowska WH, Reid DS, et al. Differential expression of homeobox genes in functionally distinct CD34+ subpopulations of human bone marrow cells. Proc Natl Acad Sci U S A. 1994;91:12223–7. doi: 10.1073/pnas.91.25.12223. [DOI] [PMC free article] [PubMed] [Google Scholar]
- 39.Calvo KR, Sykes DB, Pasillas MP, Kamps MP. Nup98-HoxA9 immortalizes myeloid progenitors, enforces expression of Hoxa9, Hoxa7 and Meis1, and alters cytokine-specific responses in a manner similar to that induced by retroviral co-expression of Hoxa9 and Meis1. Oncogene. 2002;21:4247–56. doi: 10.1038/sj.onc.1205516. [DOI] [PubMed] [Google Scholar]
- 40.Shah N, Sukumar S. The Hox genes and their roles in oncogenesis. Nat Rev Cancer. 2010;10:361–71. doi: 10.1038/nrc2826. [DOI] [PubMed] [Google Scholar]
- 41.Golub TR, Slonim DK, Tamayo P, Huard C, Gaasenbeek M, Mesirov JP, et al. Molecular classification of cancer: class discovery and class prediction by gene expression monitoring. Science. 1999;286:531–7. doi: 10.1126/science.286.5439.531. [DOI] [PubMed] [Google Scholar]
- 42.Kroon E, Krosl J, Thorsteinsdottir U, Baban S, Buchberg AM, Sauvageau G. Hoxa9 transforms primary bone marrow cells through specific collaboration with Meis1a but not Pbx1b. EMBO J. 1998;17:3714–25. doi: 10.1093/emboj/17.13.3714. [DOI] [PMC free article] [PubMed] [Google Scholar]
- 43.You J, Li Q, Wu C, Kim J, Ottinger M, Howley PM. Regulation of aurora B expression by the bromodomain protein Brd4. Mol Cell Biol. 2009;29:5094–103. doi: 10.1128/MCB.00299-09. [DOI] [PMC free article] [PubMed] [Google Scholar]
- 44.Yang D, Liu H, Goga A, Kim S, Yuneva M, Bishop JM. Therapeutic potential of a synthetic lethal interaction between the MYC proto-oncogene and inhibition of aurora-B kinase. Proc Natl Acad Sci U S A. 2010;107:13836–41. doi: 10.1073/pnas.1008366107. [DOI] [PMC free article] [PubMed] [Google Scholar]
- 45.Neben K, Korshunov A, Benner A, Wrobel G, Hahn M, Kokocinski F, et al. Microarray-based screening for molecular markers in medulloblastoma revealed STK15 as independent predictor for survival. Cancer Res. 2004;64:3103–11. doi: 10.1158/0008-5472.can-03-3968. [DOI] [PubMed] [Google Scholar]
- 46.Lassmann S, Weis R, Makowiec F, Roth J, Danciu M, Hopt U, et al. Array CGH identifies distinct DNA copy number profiles of oncogenes and tumor suppressor genes in chromosomal- and microsatellite-unstable sporadic colorectal carcinomas. J Mol Med (Berl) 2007;85:293–304. doi: 10.1007/s00109-006-0126-5. [DOI] [PubMed] [Google Scholar]
Associated Data
This section collects any data citations, data availability statements, or supplementary materials included in this article.