

Abstract
Diploid cells undergoing senescence and mitotic slippage have been reported in the literature. However, the mechanisms triggering senescence in long-term G2-arrested cells are currently unclear. Previously, we reported that the cell cycle of the human uveal melanoma cell line, 92-1, is suspended for up to 6 d upon exposure to 10 Gy ionizing radiation (IR), followed by senescence. In the current study, we initially distinguished senescence in long-term blocked 92-1 cells from mitotic slippage by confirming the blockage of cells in the G2 phase. We subsequently showed that the genes essential for G2-M transition are prematurely downregulated at both the transcriptional and translational levels. Furthermore, levels of the G1-specific markers, Cyclin D1 and Caveolin-1, were distinctly increased, while S/G2-specific markers, Cyclin B1 and Aurora A, were significantly downregulated. These findings collectively imply that long-term G2-arrested cells undergo senescence via G2 slippage. To our knowledge, this is the first study to report that the cellular process of G2 slippage is the mechanism responsible for senescence of cells under long-term G2 arrest.
Keywords: ionizing radiation, G2 slippage, senescence, cell cycle checkpoint, DNA damage response, mitotic slippage
Introduction
Cellular senescence is induced by several factors, such as telomere shortening below a crucial length,1 constitutive activation of oncogenes,2 tumor suppressor inactivation,3 exposure to exogenous DNA damaging agents4 and mitochondrial oxidative stress,5 which are associated with activation of DNA damage response (DDR) pathways and irreversible loss of proliferative potential. Cellular senescence, as a naturally existing mechanism, was described to involve in organismal aging by terminating cellular proliferation in vivo.6 Senescent cells usually contain diploid DNA, a typical characteristic of the G1 phase in somatic or in vitro cultured cells.7,8 Several earlier and recent studies have reported that replicatively senescent or DNA damage-induced senescent cells contain a sizeable subpopulation with tetraploid DNA content.9-13 As a dogma, once a cell progresses past the restriction point, it becomes irreversibly committed to the S phase and subsequent division until the next G1 phase, signifying that all intermediate phases are unstable, except G0 and early G1.14-16 Upon completion of genome replication, G2 cells accumulate significant amounts of mitotic enzymes for chromosome segregation and cytokinesis. These factors are degraded by the anaphase-promoting complex (APC/C) to promote exit of cells from mitosis,17 and their unscheduled degradation is believed to result in long-term G2 arrest. Indeed, in response to DNA damage, APC/C, normally inactive from late G1 to metaphase, is prematurely activated in G2.12,18,19 Moreover, factors destroyed by APC/C cannot recover, and long-term G2-arrested cells present a senescence-like phenotype.12 However, the mechanisms by which cells in long-term G2 arrest undergo senescence remain to be established.
When the spindle assembly checkpoint is activated by nocodazole (Noc), colcemid, taxol, monastrol, vinblastine or other cytotoxic reagents, cells exit mitosis via mitotic slippage accompanied by Cyclin B1 proteolysis, re-enter the G1 phase and are subsequently arrested at this phase in association with senescence.20,21 This phenomenon gives rise to the theory that long-term G2 arrested cells undergo G2 slippage, bypass the M phase, directly enter the G1 phase via degradation of Cyclin B1, and consequently become senescent.
In this study, we found that after 92-1 cells exposed to 10 Gy X-rays, long-term G2 arrest was induced accompanied by the downregulation of genes essential for G2-M transition. Next, we proved that these cells skipped M phase, directly slipped into G1 phase, and then underwent senescence. To our knowledge, this is the first study to present the current hypothesis on G2 slippage and provide supportive experimental evidence using the highly radiosensitive cell line, 92-1. In this case, the cell cycle is suspended following treatment with 10 Gy IR, and cells undergo senescence 5 d after irradiation.
Results
Cells under long-term G2 arrest undergo senescence
Previous studies have shown that upon exposure to 10 Gy IR, the cell cycle of exponentially growing 92-1 cells is suspended, and cells undergo senescence.22 In the current investigation, we repeated the cell cycle assay with 92-1 cells synchronized at the G1/S border using thymidine. As shown in Figure 1A, untreated G1/S border cells showed typical cell cycle progression and successively entered S, G2/M and the subsequent G1 phase. Cells exposed to IR also resumed cell cycle progression, but failed to undergo cell division, and tetraploid cells accumulated in a dose-dependent manner.

Figure 1. IR induces long-term G2 arrest. 92-1 cells were synchronized in the G1/S border with 1 mM thymidine for 24 h and released with fresh culture medium to allow re-entry into the cell cycle. After release for 1 h, cells were treated with the specified radiation doses. Between 0 and 144 h after X-ray treatment, cells were harvested and analyzed with a flow cytometer. (A) Kinetics of cell cycle distribution. Square, 0 Gy; circle, 2 Gy; up-triangle, 5 Gy; down-triangle, 10 Gy; cross, 15 Gy. (B) Kinetic variations in Cyclin B1 protein analyzed via immunoblot using anti-Cyclin B1 antibody. Protein levels of Cyclin B1 were calculated by averaging results from three independent experiments. Bars represent SEM. Square, 0 Gy; circle, 2 Gy; up-triangle, 5 Gy; down-triangle, 10 Gy. 92-1 cells in exponentially growing status with 70% confluence (C and D) or G1/S border cells synchronized with thymidine and released for 1 h (E and F) were exposed to 10 Gy of X-rays, prior to administration of 100 ng/mL nocodazole (Noc). The percentage of cells in each cell cycle phase was shown in panel (C and E). Levels of Cyclin B1 protein and H3 phosphorylated at Ser 28 were shown in panel (D and F).
Cyclin B1, a regulatory subunit of the M phase-promoting factor, is essential for G2-M transition. Downregulation or overexpression of a non-degradable form of Cyclin B1 can lead to blockage of cells in the tetraploid stage.23,24 Monitoring of the kinetics of Cyclin B1 expression in G1/S border cells exposed to X-rays revealed similar threshold dose-dependent induction by Cyclin B1 to cell cycle progression. At doses above the threshold level, Cyclin B1 degradation was induced about 6 h after IR, and the cell cycle was not recovered (Fig. 1B).
Next, we wanted to distinguish G2 block from the mitotic spindle checkpoint in exponentially growing 92-1 cells treated with 10 Gy X-rays by using phosphorylated histone H3 serine 28, a marker of mitotic cells. After the treatment with Noc, which blocks cells in prometaphase,25 the percentage of tetraploid cells increased (Fig. 1C), with upregulated phosphorylation level of histone H3 at Ser 28 (Fig. 1D) indicating that these cells were in M phase. But we didn’t observe the phosphorylation of H3 Ser 28 in the cells treated by IR (Fig. 1D). Similar results were obtained with G1/S border cells (Fig. 1E and F). The phosphorylation of H3 Ser 28 was not observed, even though the proportion of tretraploid cells reached to 79.4 ± 0.06% 15 h after irradiation. These results demonstrate that tetraploid 92-1 cells induced by 10 Gy X-rays are actually in the G2 phase.
To confirm whether long-term G2-blocked cells undergo senescence, we repeated the senescence assay with 92-1 cells synchronized at the G1/S border with thymidine. The rates of SA-β-gal-positive cells were not significantly different among G1, exponentially growing and S phase cells, and displayed a dramatic increase on the day 5 after irradiation (Fig. 2A). As senescent cells could not undergo cell cycle recovery, cell proliferation was investigated. Ki67 is an accepted marker for determining cell growth fractions,26 as it is preferentially expressed during the late G1, S, G2 and M phases but absent in resting cells (G0) and the early G1 phase. As shown in Figure 2B and C, at 48 h after IR, Ki67 was significantly decreased in 92-1, but not in OCM-1 cells, which were able to recover and re-enter the cell cycle (Fig. 2D and E).22
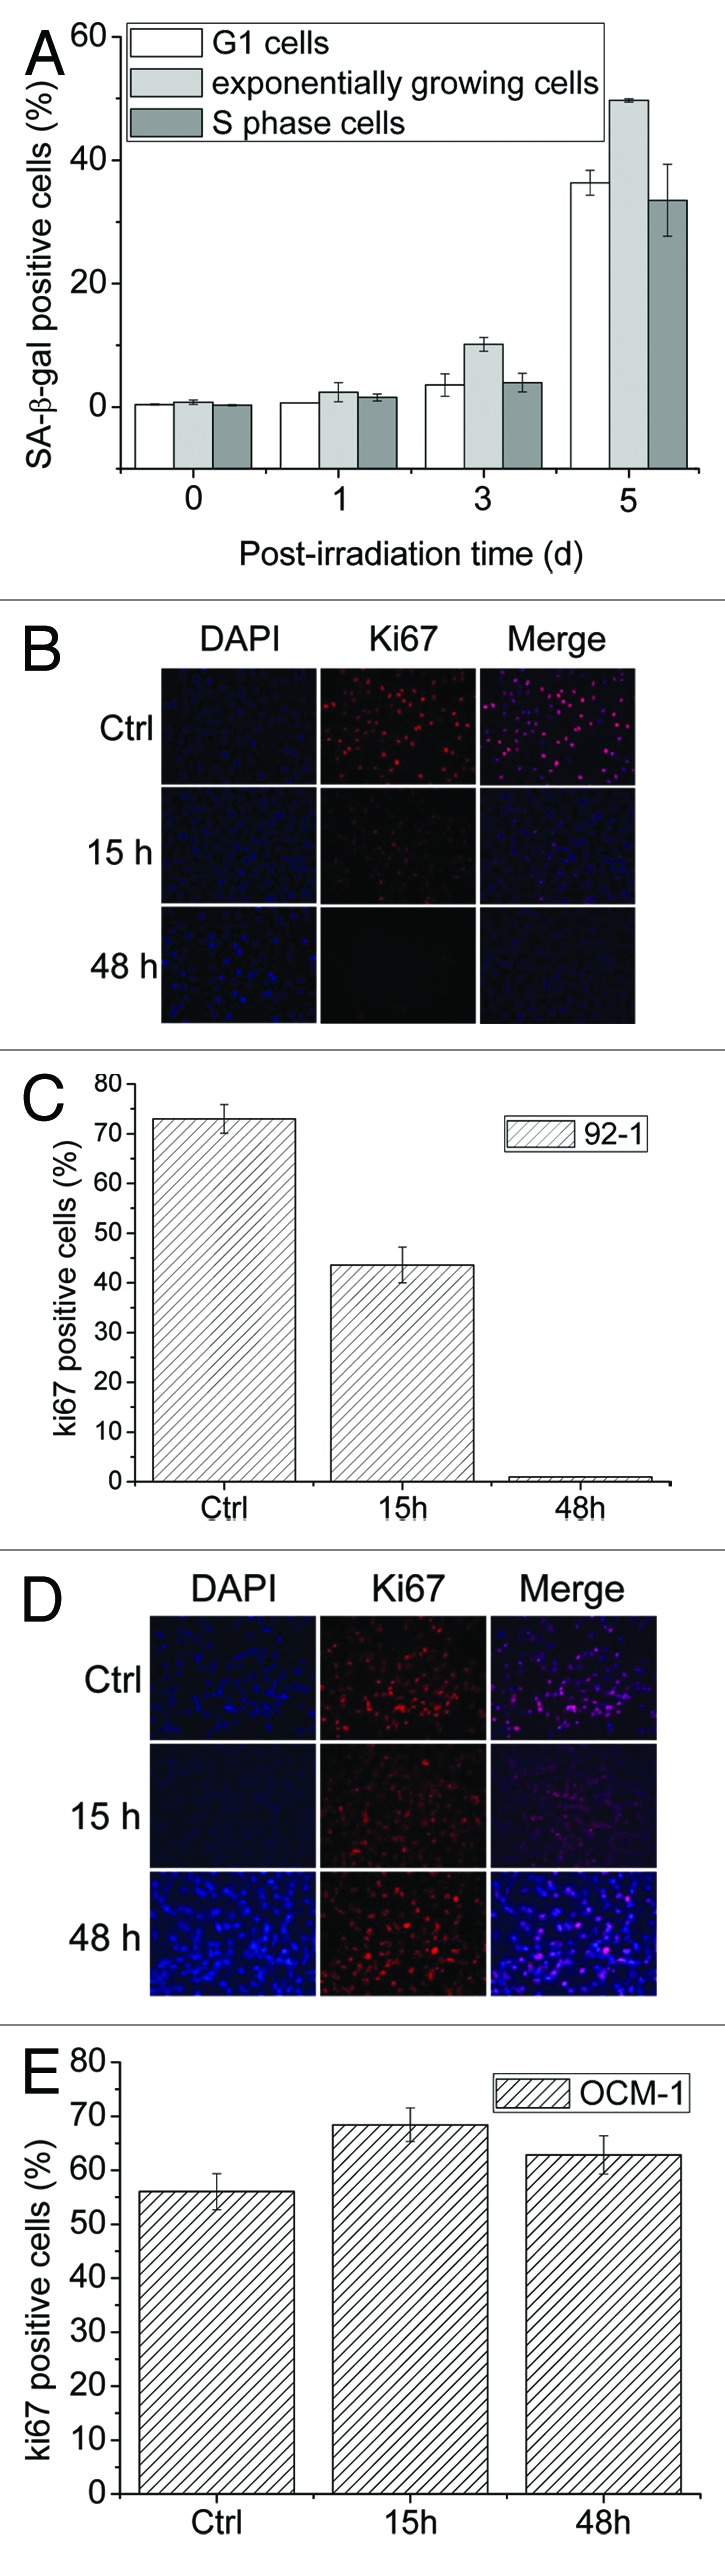
Figure 2. Long-term G2 arrested cells undergo senescence. (A) 92-1 cells in the exponentially growing phase and G1/S border cells released for 1 h (S phase) or for 18 h (G1 phase) were treated with 10 Gy X-rays. Cells were fixed and stained with the Senescence β-Galactosidase Staining Kit at the corresponding times. Ratios of SA-β-gal-positive cells were quantified by counting at least 1,000 cells. Cells in the exponentially growing phase were irradiated at a dose of 10 Gy, harvested at early (15 h) or late (48 h) time points and analyzed for Ki67 expression with immunofluorescence staining. Ratios of Ki67-positive cells were calculated for 92-1 (B and C) and OCM-1 (D and E) basing on the results obtained by counting at least 1,000 cells.
Genes functioning in G2-M transition are downregulated upon long-term G2 arrest
To establish the precise mechanism underlying long-term G2 arrest induced by IR, we measured global genome expression profiles following exposure of cells to 10 Gy X-rays with Affymetrix Human Genome U133 Plus 2.0 Arrays containing more than ~54,000 probe sets representing ~38,500 different human genes. The mean transcript levels from two independent replicate experiments were highly reproducible, with r2 values of 0.993 to 0.997 (Table 1).
Table 1. Spearman rank correlation for two independent replicate experiments.
| Repeat |
Ctrl |
15 h |
48 h |
Noc |
|||||
| 1 |
2 |
1 |
2 |
1 |
2 |
1 |
2 |
||
| Ctrl |
1 |
1.000 |
0.997 |
0.991 |
0.991 |
0.981 |
0.983 |
0.991 |
0.992 |
| |
2 |
0.997 |
1.000 |
0.992 |
0.992 |
0.981 |
0.983 |
0.992 |
0.992 |
| 15h |
1 |
0.991 |
0.992 |
1.000 |
0.997 |
0.985 |
0.987 |
0.990 |
0.990 |
| |
2 |
0.991 |
0.992 |
0.997 |
1.000 |
0.984 |
0.987 |
0.990 |
0.990 |
| 48h |
1 |
0.981 |
0.981 |
0.985 |
0.984 |
1.000 |
0.993 |
0.981 |
0.982 |
| |
2 |
0.983 |
0.983 |
0.987 |
0.987 |
0.993 |
1.000 |
0.982 |
0.984 |
| Noc |
1 |
0.991 |
0.992 |
0.990 |
0.990 |
0.981 |
0.982 |
1.000 |
0.997 |
| 2 | 0.992 | 0.992 | 0.990 | 0.990 | 0.982 | 0.984 | 0.997 | 1.000 | |
r2 value for two independent replicate experiments. Four kinds of samples, “Ctrl,” “15 h,” “48 h” and “Noc” as described in Materials and Methods, were analyzed by Affymetrix Human Genome U133 Plus 2.0 Arrays. Two independent replicate experiments were measured by Spearman Rank Correlation.
As depicted in Figure 3A, 1,265 genes displayed a 2-fold or higher change following treatment, compared with sham control (Ctrl), among which 772 genes were annotated with a biological process using the PANTHER program (Fig. 3B) and 925 using the GOTERM program. Among the 925 genes, 206 in the cell cycle category were further annotated with a biological process using GOTERM program. Within this gene subgroup, 63 functioned in nuclear division, 39 in chromosome segregation and 26 in DNA replication (Fig. 2C). The majority of these genes were downregulated after irradiation (except 10 cases), and expression changes were markedly different from those following Noc treatment. Analysis of the significance of the functional categories revealed that changes were significant in genes associated with nuclear division and chromosome segregation among the 1,265 altered genes (Fig. 3D). Enrichment was additionally observed in mRNA transcription, DNA replication and chromatin packaging and remodeling categories.

Figure 3. G2-M transition genes are downregulated. Four sample groups, specifically “Ctrl,” “15 h,” “48 h” and “Noc,” were analyzed using Affymetrix Human Genome U133 Plus 2.0 Arrays. (A) In total, 1,256 genes with changes in mRNA levels (at least 2-fold) were selected. This subset of genes was clustered hierarchically into groups on the basis of similarities in expression profiles. (B) Gene ontology analysis of genes displaying at least a 2-fold change was performed with the PANTHER program. Among the 1,256 genes, 772 were assigned to 27 biological processes. Genes for which no biological process could be assigned were omitted from this display. Categories with more than 10 assigned genes are shown. (C) Subdivisions of the cell cycle categories using the GOTERM program. In total, 206 genes in this category were assigned to more detailed biological processes. Categories with more than two assigned genes are presented. (D) Significance refers to the –log10(p value), obtained with PANTHER or GOTERM. Threshold was set as 1.301, which means −log10 (0.05). (E) Expression of single genes, compared with Ctrl, is shown. For gene expression, 92-1 cells in the G1/S border (F) were exposed to 10 Gy irradiation. Whole-cell lysates were examined using immunoblot analysis.
A number of key factors, Cdc25, Cdk1, Cyclin B1, Plk1 and Aurora A, essential for G2-M transition were significantly downregulated after IR exposure, but not Noc treatment (Fig. 3E and F). Notably, FoxM1, an essential factor in DNA damage checkpoint recovery, was decreased by 17-fold. Wiebusch and colleagues showed that long-term G2 arrest is induced via p53/p21-dependent premature Cdh1 activation.12 As shown in Figure 3F, IR induced stability of p53 and p21 accumulation. Cdc20 and Cdh1, E3 activators of APC/C, target several essential mitotic regulators for proteolysis. Moreover, Cdc20 is one of the substrates of Cdh1.27 Notably, Cdh1 expression was stable, but not Cdc20, implying that Cdh1 promotes the degradation of targeted proteins by the proteasome in irradiated 92-1 cells. Based on these collective findings, we propose that IR triggers downregulation of genes essential for G2-M transition at both the mRNA and protein levels, leading to long-term G2 arrest.
Long-term G2-arrested cells undergo G2 slippage
Within the gene expression spectrum, 31 cell cycle-relevant genes were altered upon X-ray irradiation. Genes associated with the S/G2 phase were downregulated, while those functioning in G0/G1 were upregulated after IR (Fig. 4A), implying possible slippage from the G2 to G1 phase. Therefore, we assessed the actual status of long-term G2-arrested cells.

Figure 4. Long-term G2 arrested cells undergo G2 slippage. (A) Overall, 31 cell cycle-specific genes were analyzed and presented in the heatmap. Caveolin-1 (encoded by CAV1), Cyclin D1 (encoded by CCND1), H2B (encoded by HISTIH2B), Aurora A (encoded by AURKA), Ki67 (encoded by MKI67) and Cyclin B1 (encoded by CCNB1) are presented. Magenta, upregulated; green, downregulated. Cell cycle distribution (B) and protein expression of specific biomarkers (C) of 92-1 cells synchronized in the G1/S border, as described in Figure 1, and released at the indicated time-points were analyzed. (D–F), Protein expression of specific biomarkers in 92-1 cells exposed to 10 Gy irradiation. Positive/negative controls, whose cell cycle distribution are displayed in (B), were loaded on each side of the western blot gel. G1, 92-1 cells obtained by synchronization in G1/S with thymidine and release for 18 h; S, 92-1 cells obtained by synchronization in G1/S with thymidine and release for 6 h; G2, 92-1 cells obtained by synchronization in G1/S with thymidine and release for 9 h; M, 92-1 cells obtained by synchronization in the M phase, with Noc treatment for 15 h. Cav-1, Caveolin-1; p-H3, phosphorylated histone H3. (D) Exponentially growing 92-1 cells. (E) G1 phase 92-1 cells obtained by synchronization in G1/S with thymidine and release for 18 h. (F) S-phase 92-1 cells obtained by synchronization in G1/S with thymidine and release for 6 h. (G) Expression of Cyclin D1, NFκB and Akt1 in exponentially growing cells exposed to 10 Gy X-rays. Whole-cell lysates were analyzed for expression of the indicated proteins via immunoblot analysis. Western blot experiments were independently repeated three times. A single gel for each protein is presented.
Initially, Cyclin B1 and Aurora A were validated as markers for G2 phase cells. Meanwhile, Cyclin D1 and Caveolin-1 were identified as the markers for the G1 phase, based on their corresponding cell cycle distribution (Fig. 4B) and expression patterns (Fig. 4C) of cells released from the G1/S border synchronized with thymidine. Next, expression patterns of cell cycle-specific genes from G1/S border cells after IR were examined. Notably, Cyclin B1 and Aurora A proteins disappeared, while the expression of Cyclin D1 and Caveolin-1 gradually increased during the post-irradiation incubation period (Fig. 4D–F). Alterations were confirmed in cells from G2 to G1 phases, with upregulation of NFκB and Akt that regulate Cyclin D1 expression (Fig. 4G).28-30 These findings collectively indicate that 92-1 cells undergo mitotic-like slippage from G2 directly to the G1 phase.
Discussion
In the current study, we showed that long-term G2-arrested 92-1 cells undergo senescence via G2 slippage due to promoted degradation of numerous APC/C substrates. The microarray assay revealed significant downregulation of the mRNA levels of the majority of G2-M transition genes. Furthermore, levels of the G1-specific markers, Cyclin D1 and Caveolin-1, were significantly increased,31-33 while those of S/G2-specific markers, Cyclin B1 and Aurora A, were markedly decreased.34,35 The data collectively provide insights into the mechanisms underlying long-term G2 arrest induced by IR, and support the hypothesis that long-term G2-arrested cells undergo senescence via G2 slippage.
G2 slippage describes a process whereby S or G2 phase cells treated with DNA damage agents are arrested in the G2 phase. Although most of the damage is repaired rapidly,22 these cells cannot enter the M phase and display downregulation of the genes essential for G2-M transition. Instead, they bypass the M phase and slip into the G1 phase without mitosis. G2 slippage is distinct from endocycle or endomitosis and represents a novel process of endoreplication. Endocycle is a form of endoreplication in which the cell cycle consists of discrete S and G phases. The duplicated chromatids remain physically associated, leading to the production of polytene chromosomes.36,37 In contrast, long-term G2-arrested cells exhibit obvious separate sister chromatids interspersed with dispersed centromeres.13 Mitotic slippage, a canonical case of endomitosis, is another form of endoreplication in which cells contain early mitotic markers, such as phosphohistone H3, but do not undergo chromosome segregation and cytokinesis.36-38 In long-term G2-arrested cells, phospho-histone H3 and chromosome segregation were not detected in this study. Therefore, G2 slippage appears to represent a third means of endoreplication with chromatid separation, but lack early mitotic markers and mitosis.
Although the mechanism of G2 slippage is unknown at present, a number of findings have provided clues. First, the genes essential for G2-M transition were downregulated at both transcriptional and translational levels. Most of these genes are substrates of Cdh1 and transcribed by FoxM1.27,39 Stress-induced Cdh1 activation may be explained by at least three distinct mechanisms. Phosphorylated Cdc14B may be released from the nucleolus to nucleoplasm and induce activation of Cdh1 in response to genotoxic stress.19 In addition, downregulation of Emi1 functions as a redundant mechanism to safeguard Cdh1 activation after DNA damage.12 The Notch signaling pathway influences mitosis to endoreplication transition through modulating the expression of three important genes. This pathway induces expression of Cdh1, but suppresses the S-phase Cyclin-dependent kinase inhibitor, p27 and Cdc25.40 Earlier studies demonstrated that Notch mutation prevents follicle cells from switching to endoreplication, but mitotic division is continued.41,42 Activation of Notch signaling following exposure to IR has been reported.43 Interestingly, the genes (CFD, DLL1, NRG1 and JAG1) participating in the Notch signaling pathway were significantly upregulated (Table 2), while Cdc25 expression was decreased, following X-ray irradiation. Second, the transcription factor network, in which transcription factors expressed in one cell cycle phase bind to the promoters of genes encoding transcription factors that function in a subsequent phase,44 may drive cells to undergo G2 slippage and enter the G1 phase regardless of the Cyclin-Cdk complex. Yeast cells lacking S phase and mitotic B-Cyclin genes showed oscillations and repeated G1 events, despite failure of DNA replication, mitosis and cytokinesis.45 Recent studies revealed that these events are driven by regulation of the transcription factor network, independently of the Cyclin-Cdk complex.46 In conclusion, after X-ray irradiation, activation of ATM/ATR induces immediate G2 arrest and premature activation of Cdh1, in turn, causing marked downregulation of substrate genes at both protein and mRNA levels and maintenance of cells in long-term G2 arrest. Subsequently, the transcription factor network drives G2 slippage and causes arrested cells to enter the G1 phase. However, the detailed mechanisms require further investigation.
Table 2. Fold change of gene expression in Notch signaling pathway category.
| Genes | Fold change (15 h vs. Ctrl) | Fold change (48 h vs. Ctrl) | Fold change (Noc vs. Ctrl) |
|---|---|---|---|
| DLL1 |
2.44 |
1.37 |
4.03 |
| NRG1 |
2.57 |
2.05 |
1.16 |
| CFD |
1.33 |
2.27 |
1.15 |
| JAG1 | 3.58 | 1.65 | 1.07 |
Replicatively senescent cells tend to remain at the G1 or G0 stage of the cell cycle.8 However, a few studies to date have reported that populations of senescent cells contain a sizeable fraction of tetraploid cells.9-11,13 G2 slippage provides a reasonable explanation for why cells with 4N DNA content undergo cellular senescence. Indeed, our group and other researchers consistently observed that Cyclin B1, which promotes G2/M transition, is absent in senescent cells with 4N DNA content, while Cyclin D1 promoting progression through G1/S is elevated significantly within the process of senescence.13 However, it is unclear why these cells become polyploid through G2 slippage. One possibility is that polyploidization occurs as a precursor to aneuploidy that may contribute to oncogenesis.47 Another hypothesis is that these cells use G2 slippage as a means of survival during mitotic or genotoxic stress. Endopolyploidization in senescence is associated with re-replication of the genome in damaged G2/M cells, which undergo meiotic-like division and become genome-reduced. Indeed, besides diploid and tetraploid, aneuploid cells are present as reverted cells that escape senescence.48 Moreover, 0.3% of senescent cells in the G2 phase can re-replicate the genome.13
Conclusion
Both G2 slippage and cellular senescence are responses of S or G2 phase cells to genotoxic stress, which prevent those with DNA damage from dividing. The G2 slippage mechanism explains why long-term G2 arrested cells undergo cellular senescence. Based on the collective findings, we propose a model whereby G2-arrested cells undergo G2 slippage and subsequently become senescent, and additionally present evidence that cellular senescent cells are in the G1 phase.
Materials and Methods
Cell culture and radiation exposure
Cells were cultured and treated, as described previously.22 Briefly, human choroidal malignant melanoma 92-1 cells were cultured in RPMI-1640 (Sigma) complemented with 10% fetal bovine serum (FBS, Hyclone), 100 μg/mL streptomycin and 100 units/mL penicillin in a humidified atmosphere of 5% CO2. Cells were seeded in 12-well plates, ϕ35 mm culture dishes or 25 cm2 culture flasks 2 d before irradiation, resulting in < 70% confluence at the time of irradiation at room temperature (100 kV, 5 mA, no additional filter; Faxitron RX650) and a dose rate of 1 Gy/min.
Cell synchronization
For cell synchronization, 92-1 cells were grown in medium containing 1 mM thymidine (Sigma) for 24 h, and released by culture in RPMI-1640 for different times to obtain the corresponding phase cells. G1/S border cells were released for 0 h, S phase cells for 6 h and G2 cells for 8 h. M phase cells were obtained by synchronization with 100 ng/mL nocodazole (Noc) for 15 h.
Cell cycle assay
Cells were harvested and fixed with 70% pre-chilled ethanol for over 24 h at −20°C. Prior to analysis, fixed cells were washed twice with PBS, treated with 100 μg/mL RNase A and 50 μg/mL propidium iodide (BD Biosciences) for 30 min at 37°C and analyzed using FACS Calibur flow cytometry (Becton Dickinson). Cell cycle distribution was analyzed with FlowJo. DNA content was measured with CellQuest (Becton Dickinson).
Immunofluorescence
Exponentially growing cells were plated on sterile coverslips at a density of 1 × 10⁵ cells/well. After 48 h, cells were irradiated with X-rays, fixed in 4% paraformaldehyde for 10 min and methanol at −20°C for 5 min, permeabilized with 0.5% Triton X-100 for 1 h, blocked in buffer (5% non-fat dry milk with 0.5% Triton X-100) for 2 h and stained with primary anti-Ki67 antibody (1:2,000, Cell Signaling Technology) for 2 h. Bound antibody was visualized using Alexa Fluor 594 anti-rabbit antibody (1:2,000, Molecular Probes), and cell nuclei were counterstained with DAPI solution (Invitrogen). Images were obtained using a fluorescence microscope (Keyence). Ki67-positive cells were counted using fluorescence microscopy (Nikon BX50), and at least 500 cells scored for each sample.
cDNA synthesis and microarray hybridization
Four types of samples were prepared for microarray assay. Cells were synchronized for 24 h with 1 mM thymidine and released by culture in regular medium for 2 h. “Ctrl” represents the sham control group. Cells were harvested immediately after release. The “15 h” group represents G2 blocked cells. Cells were treated with 10 Gy X-rays after release and harvested after 15 h. The “48 h” group signifies long-term blocked cells. Cells were treated with 10 Gy irradiation after release and harvested 48 h later. The “Noc” group represents M phase cells. Cells were administered 100 ng/mL Noc after release and harvested 15 h later. For harvest, cells were washed twice with PBS and collected by gentle centrifugation (300 g for 5 min). Pellets were frozen immediately in liquid nitrogen, and total RNA was extracted from cells as described previously.20 RNA was purified with an RNAeasy MinElute Cleanup Kit (Qiagen). cDNA synthesis and fluorescent labeling were performed by the Gene Tech (Shanghai) Company using GeneChip One cycle Labeling (Affymetrix), and hybridized to Human 2.0 Expression array (Affymetrix). Hybridization and image collection were performed by the Gene Tech Company.
Western blot analysis
Western blotting was performed as described previously.22 Briefly, cells were collected and lysed with RIPA solution (Beyotime). Samples were centrifuged at 10,000 g for 15 min at 4°C, and total protein concentrations determined from supernatants using the BCA protein assay kit (Pierce). Thereafter, samples were resolved with SDS-PAGE and transferred onto polyvinylidene difluoride (PVDF) membrane (GE healthcare). Membranes were blocked for 2 h in blocking buffer (5% non-fat dry milk) and incubated with primary antibodies for 2 h. Next, membranes were washed three times with PBS containing 0.1% Tween-20, and incubated with secondary antibody for 1.5 h. Following three further washes with PBS containing 0.1% Tween-20, protein bands were visualized using the enhanced chemiluminescence system (Amersham-Buchler) and exposed to X-ray medical film (Kodak). β-actin or GAPDH was used as the loading control. The antibodies employed in this study were: anti-β-actin (1:5,000, Santa Cruz), anti-Cdh1 (1:1,000, DCS-266, Abcom), anti-Cdc20 (1:1,000, H-175, Santa Cruz), anti-Skp2 (1:1,000, H-435, Santa Cruz), anti-Plk1 (1:1,000, 36–298, Abcam), anti-Aurora A (1:1,000, 35C1, Abcam), anti-Cyclin B1 (1:1,000, GNS1, Santa Cruz), anti-Cyclin D1 (1:1,000, A-12, Santa Cruz), anti-Akt1 (1:1,000, 9272, Cell Signaling), anti-NFκB (1:1000, 3037, Cell signaling) and Caveolin-1 (1:500, N-20, Santa Cruz).
SA-β-gal staining
92-1 cells (1 × 10⁵) were plated in 35 mm tissue culture dishes and incubated for 48 h before exposure to 10 Gy X-rays. At each indicated timepoint after treatment, cells were stained with the Senescence β-Galactosidase Staining Kit (C0602, Beyotime) following the standard protocol suggested by the manufacturer. Senescent cells were identified under a light microscope.
Computational and Statistical analyses
All experiments were repeated at least three times, and data presented as means ± SEM.
Bioinformatic analysis
To compare transcript dynamics among control, 15 h, 48 h and Noc groups, data sets were systematically aligned using Perseus software. Bioinformatics analysis was performed using PANTHER or GOTERM. Similar gene ontology analysis data were obtained with both programs.
Glossary
Abbreviations:
- IR
ionizing radiation
- DDR
DNA damage response
- APC/C
anaphase-promoting complex
- Noc
nocodazole
- Cav-1
Caveolin-1
- p-H3
phosphorylated histone H3
Disclosure of Potential Conflicts of Interest
No potential conflicts of interest were disclosed.
Footnotes
Previously published online: www.landesbioscience.com/journals/cc/article/24528
Reference
- 1.Harley CB, Futcher AB, Greider CW. Telomeres shorten during ageing of human fibroblasts. Nature. 1990;345:458–60. doi: 10.1038/345458a0. [DOI] [PubMed] [Google Scholar]
- 2.Halazonetis TD, Gorgoulis VG, Bartek J. An oncogene-induced DNA damage model for cancer development. Science. 2008;319:1352–5. doi: 10.1126/science.1140735. [DOI] [PubMed] [Google Scholar]
- 3.Chen Z, Trotman LC, Shaffer D, Lin HK, Dotan ZA, Niki M, et al. Crucial role of p53-dependent cellular senescence in suppression of Pten-deficient tumorigenesis. Nature. 2005;436:725–30. doi: 10.1038/nature03918. [DOI] [PMC free article] [PubMed] [Google Scholar]
- 4.Schmitt CA. Senescence, apoptosis and therapy--cutting the lifelines of cancer. Nat Rev Cancer. 2003;3:286–95. doi: 10.1038/nrc1044. [DOI] [PubMed] [Google Scholar]
- 5.Velarde MC, Flynn JM, Day NU, Melov S, Campisi J. Mitochondrial oxidative stress caused by Sod2 deficiency promotes cellular senescence and aging phenotypes in the skin. Aging (Albany NY) 2012;4:3–12. doi: 10.18632/aging.100423. [DOI] [PMC free article] [PubMed] [Google Scholar]
- 6.Kim WY, Sharpless NE. The regulation of INK4/ARF in cancer and aging. Cell. 2006;127:265–75. doi: 10.1016/j.cell.2006.10.003. [DOI] [PubMed] [Google Scholar]
- 7.Zhang H, Pan KH, Cohen SN. Senescence-specific gene expression fingerprints reveal cell-type-dependent physical clustering of up-regulated chromosomal loci. Proc Natl Acad Sci U S A. 2003;100:3251–6. doi: 10.1073/pnas.2627983100. [DOI] [PMC free article] [PubMed] [Google Scholar]
- 8.d’Adda di Fagagna F. Living on a break: cellular senescence as a DNA-damage response. Nat Rev Cancer. 2008;8:512–22. doi: 10.1038/nrc2440. [DOI] [PubMed] [Google Scholar]
- 9.Yanishevsky R, Mendelsohn ML, Mayall BH, Cristofalo VJ. Proliferative capacity and DNA content of aging human diploid cells in culture: a cytophotometric and autoradiographic analysis. J Cell Physiol. 1974;84:165–70. doi: 10.1002/jcp.1040840202. [DOI] [PubMed] [Google Scholar]
- 10.Grove GL, Mitchell RB. DNA microdensitometry as a measure of cycling-non-cycling activity in aged human diploid cells in culture. Mech Ageing Dev. 1974;3:235–40. doi: 10.1016/0047-6374(74)90019-0. [DOI] [PubMed] [Google Scholar]
- 11.Grove GL, Cristofalo VJ. Characterization of the cell cycle of cultured human diploid cells: effects of aging and hydrocortisone. J Cell Physiol. 1977;90:415–22. doi: 10.1002/jcp.1040900305. [DOI] [PubMed] [Google Scholar]
- 12.Wiebusch L, Hagemeier C. p53- and p21-dependent premature APC/C-Cdh1 activation in G2 is part of the long-term response to genotoxic stress. Oncogene. 2010;29:3477–89. doi: 10.1038/onc.2010.99. [DOI] [PubMed] [Google Scholar]
- 13.Mao Z, Ke Z, Gorbunova V, Seluanov A. Replicatively senescent cells are arrested in G1 and G2 phases. Aging (Albany NY) 2012;4:431–5. doi: 10.18632/aging.100467. [DOI] [PMC free article] [PubMed] [Google Scholar]
- 14.Zetterberg A, Larsson O, Wiman KG. What is the restriction point? Curr Opin Cell Biol. 1995;7:835–42. doi: 10.1016/0955-0674(95)80067-0. [DOI] [PubMed] [Google Scholar]
- 15.Tyson JJ, Novak B. Regulation of the eukaryotic cell cycle: molecular antagonism, hysteresis, and irreversible transitions. J Theor Biol. 2001;210:249–63. doi: 10.1006/jtbi.2001.2293. [DOI] [PubMed] [Google Scholar]
- 16.Novak B, Tyson JJ, Gyorffy B, Csikasz-Nagy A. Irreversible cell-cycle transitions are due to systems-level feedback. Nat Cell Biol. 2007;9:724–8. doi: 10.1038/ncb0707-724. [DOI] [PubMed] [Google Scholar]
- 17.Pines J. Cubism and the cell cycle: the many faces of the APC/C. Nat Rev Mol Cell Biol. 2011;12:427–38. doi: 10.1038/nrm3132. [DOI] [PubMed] [Google Scholar]
- 18.Sudo T, Ota Y, Kotani S, Nakao M, Takami Y, Takeda S, et al. Activation of Cdh1-dependent APC is required for G1 cell cycle arrest and DNA damage-induced G2 checkpoint in vertebrate cells. EMBO J. 2001;20:6499–508. doi: 10.1093/emboj/20.22.6499. [DOI] [PMC free article] [PubMed] [Google Scholar]
- 19.Bassermann F, Frescas D, Guardavaccaro D, Busino L, Peschiaroli A, Pagano M. The Cdc14B-Cdh1-Plk1 axis controls the G2 DNA-damage-response checkpoint. Cell. 2008;134:256–67. doi: 10.1016/j.cell.2008.05.043. [DOI] [PMC free article] [PubMed] [Google Scholar]
- 20.Poehlmann A, Habold C, Walluscheck D, Reissig K, Bajbouj K, Ullrich O, et al. Cutting edge: Chk1 directs senescence and mitotic catastrophe in recovery from G₂ checkpoint arrest. J Cell Mol Med. 2011;15:1528–41. doi: 10.1111/j.1582-4934.2010.01143.x. [DOI] [PMC free article] [PubMed] [Google Scholar]
- 21.Brito DA, Rieder CL. Mitotic checkpoint slippage in humans occurs via cyclin B destruction in the presence of an active checkpoint. Curr Biol. 2006;16:1194–200. doi: 10.1016/j.cub.2006.04.043. [DOI] [PMC free article] [PubMed] [Google Scholar]
- 22.He J, Li J, Ye C, Zhou L, Zhu J, Wang J, et al. Cell cycle suspension: a novel process lurking in G₂ arrest. Cell Cycle. 2011;10:1468–76. doi: 10.4161/cc.10.9.15510. [DOI] [PubMed] [Google Scholar]
- 23.Chang DC, Xu N, Luo KQ. Degradation of cyclin B is required for the onset of anaphase in Mammalian cells. J Biol Chem. 2003;278:37865–73. doi: 10.1074/jbc.M306376200. [DOI] [PubMed] [Google Scholar]
- 24.Yuan J, Yan R, Krämer A, Eckerdt F, Roller M, Kaufmann M, et al. Cyclin B1 depletion inhibits proliferation and induces apoptosis in human tumor cells. Oncogene. 2004;23:5843–52. doi: 10.1038/sj.onc.1207757. [DOI] [PubMed] [Google Scholar]
- 25.Hou F, Zou H. Two human orthologues of Eco1/Ctf7 acetyltransferases are both required for proper sister-chromatid cohesion. Mol Biol Cell. 2005;16:3908–18. doi: 10.1091/mbc.E04-12-1063. [DOI] [PMC free article] [PubMed] [Google Scholar]
- 26.Scholzen T, Gerdes J. The Ki-67 protein: from the known and the unknown. J Cell Physiol. 2000;182:311–22. doi: 10.1002/(SICI)1097-4652(200003)182:3<311::AID-JCP1>3.0.CO;2-9. [DOI] [PubMed] [Google Scholar]
- 27.Peters JM. The anaphase promoting complex/cyclosome: a machine designed to destroy. Nat Rev Mol Cell Biol. 2006;7:644–56. doi: 10.1038/nrm1988. [DOI] [PubMed] [Google Scholar]
- 28.Guttridge DC, Albanese C, Reuther JY, Pestell RG, Baldwin AS., Jr. NF-kappaB controls cell growth and differentiation through transcriptional regulation of cyclin D1. Mol Cell Biol. 1999;19:5785–99. doi: 10.1128/mcb.19.8.5785. [DOI] [PMC free article] [PubMed] [Google Scholar]
- 29.Hinz M, Krappmann D, Eichten A, Heder A, Scheidereit C, Strauss M. NF-kappaB function in growth control: regulation of cyclin D1 expression and G0/G1-to-S-phase transition. Mol Cell Biol. 1999;19:2690–8. doi: 10.1128/mcb.19.4.2690. [DOI] [PMC free article] [PubMed] [Google Scholar]
- 30.Saitoh M, Ohmichi M, Takahashi K, Kawagoe J, Ohta T, Doshida M, et al. Medroxyprogesterone acetate induces cell proliferation through up-regulation of cyclin D1 expression via phosphatidylinositol 3-kinase/Akt/nuclear factor-kappaB cascade in human breast cancer cells. Endocrinology. 2005;146:4917–25. doi: 10.1210/en.2004-1535. [DOI] [PubMed] [Google Scholar]
- 31.Iida S, Miki Y, Ono K, Akahira J, Nakamura Y, Suzuki T, et al. Synergistic anti-tumor effects of RAD001 with MEK inhibitors in neuroendocrine tumors: a potential mechanism of therapeutic limitation of mTOR inhibitor. Mol Cell Endocrinol. 2012;350:99–106. doi: 10.1016/j.mce.2011.11.024. [DOI] [PubMed] [Google Scholar]
- 32.Schwencke C, Schmeisser A, Walter C, Wachter R, Pannach S, Weck B, et al. Decreased caveolin-1 in atheroma: loss of antiproliferative control of vascular smooth muscle cells in atherosclerosis. Cardiovasc Res. 2005;68:128–35. doi: 10.1016/j.cardiores.2005.05.004. [DOI] [PubMed] [Google Scholar]
- 33.Rouault JP, Rimokh R, Tessa C, Paranhos G, Ffrench M, Duret L, et al. BTG1, a member of a new family of antiproliferative genes. EMBO J. 1992;11:1663–70. doi: 10.1002/j.1460-2075.1992.tb05213.x. [DOI] [PMC free article] [PubMed] [Google Scholar]
- 34.Bastians H, Topper LM, Gorbsky GL, Ruderman JV. Cell cycle-regulated proteolysis of mitotic target proteins. Mol Biol Cell. 1999;10:3927–41. doi: 10.1091/mbc.10.11.3927. [DOI] [PMC free article] [PubMed] [Google Scholar]
- 35.Williams GH, Stoeber K. Cell cycle markers in clinical oncology. Curr Opin Cell Biol. 2007;19:672–9. doi: 10.1016/j.ceb.2007.10.005. [DOI] [PubMed] [Google Scholar]
- 36.Fox DT, Duronio RJ. Endoreplication and polyploidy: insights into development and disease. Development. 2013;140:3–12. doi: 10.1242/dev.080531. [DOI] [PMC free article] [PubMed] [Google Scholar]
- 37.Edgar BA, Orr-Weaver TL. Endoreplication cell cycles: more for less. Cell. 2001;105:297–306. doi: 10.1016/S0092-8674(01)00334-8. [DOI] [PubMed] [Google Scholar]
- 38.Andreassen PR, Margolis RL. Microtubule dependency of p34cdc2 inactivation and mitotic exit in mammalian cells. J Cell Biol. 1994;127:789–802. doi: 10.1083/jcb.127.3.789. [DOI] [PMC free article] [PubMed] [Google Scholar]
- 39.Alvarez-Fernández M, Halim VA, Krenning L, Aprelia M, Mohammed S, Heck AJ, et al. Recovery from a DNA-damage-induced G2 arrest requires Cdk-dependent activation of FoxM1. EMBO Rep. 2010;11:452–8. doi: 10.1038/embor.2010.46. [DOI] [PMC free article] [PubMed] [Google Scholar]
- 40.Lee HO, Davidson JM, Duronio RJ. Endoreplication: polyploidy with purpose. Genes Dev. 2009;23:2461–77. doi: 10.1101/gad.1829209. [DOI] [PMC free article] [PubMed] [Google Scholar]
- 41.Deng WM, Althauser C, Ruohola-Baker H. Notch-Delta signaling induces a transition from mitotic cell cycle to endocycle in Drosophila follicle cells. Development. 2001;128:4737–46. doi: 10.1242/dev.128.23.4737. [DOI] [PubMed] [Google Scholar]
- 42.Drachman JG, Millett KM, Kaushansky K. Thrombopoietin signal transduction requires functional JAK2, not TYK2. J Biol Chem. 1999;274:13480–4. doi: 10.1074/jbc.274.19.13480. [DOI] [PubMed] [Google Scholar]
- 43.Scharpfenecker M, Kruse JJ, Sprong D, Russell NS, Ten Dijke P, Stewart FA. Ionizing radiation shifts the PAI-1/ID-1 balance and activates notch signaling in endothelial cells. Int J Radiat Oncol Biol Phys. 2009;73:506–13. doi: 10.1016/j.ijrobp.2008.09.052. [DOI] [PubMed] [Google Scholar]
- 44.Orlando DA, Lin CY, Bernard A, Wang JY, Socolar JE, Iversen ES, et al. Global control of cell-cycle transcription by coupled CDK and network oscillators. Nature. 2008;453:944–7. doi: 10.1038/nature06955. [DOI] [PMC free article] [PubMed] [Google Scholar]
- 45.Haase SB, Reed SI. Evidence that a free-running oscillator drives G1 events in the budding yeast cell cycle. Nature. 1999;401:394–7. doi: 10.1038/43927. [DOI] [PubMed] [Google Scholar]
- 46.Simmons Kovacs LA, Mayhew MB, Orlando DA, Jin Y, Li Q, Huang C, et al. Cyclin-dependent kinases are regulators and effectors of oscillations driven by a transcription factor network. Mol Cell. 2012;45:669–79. doi: 10.1016/j.molcel.2011.12.033. [DOI] [PMC free article] [PubMed] [Google Scholar]
- 47.Storchova Z, Pellman D. From polyploidy to aneuploidy, genome instability and cancer. Nat Rev Mol Cell Biol. 2004;5:45–54. doi: 10.1038/nrm1276. [DOI] [PubMed] [Google Scholar]
- 48.Walen KH. Genetic stability of senescence reverted cells: genome reduction division of polyploidy cells, aneuploidy and neoplasia. Cell Cycle. 2008;7:1623–9. doi: 10.4161/cc.7.11.5964. [DOI] [PubMed] [Google Scholar]