

Abstract
The selective pressures leading to cancers with mutations in both KRAS and PIK3CA are unclear. Here we demonstrate that somatic cell knock in of both KRAS G12V and oncogenic PIK3CA mutations in human breast epithelial cells results in cooperative activation of the PI3 Kinase and MAP Kinase pathways in vitro, and leads to tumor formation in immunocompromised mice. Xenografts from double knock in cells retain single copies of mutant KRAS and PIK3CA suggesting that tumor formation does not require increased copy number of either oncogene, and these results were also observed in human colorectal cancer specimens. Mechanistically, the cooperativity between mutant KRAS and PIK3CA is mediated in part by Ras/p110α binding, as inactivating point mutations within the Ras binding domain of PIK3CA significantly abates pathway signaling. In addition, Pdk1 activation of the downstream effector p90RSK is also increased by the combined presence of mutant KRAS and PIK3CA. These results provide new insights into mutant KRAS function and its role in carcinogenesis.
Keywords: Tumorigenicity, cancer, KRAS, PIK3CA
INTRODUCTION
KRAS is one of the most frequently mutated oncogenes in human cancers. Consequently, numerous studies have supported the role of mutant KRAS in tumorigenesis and other features of transformation [reviewed in (1)]. Although there are now many studies that have elucidated how missense mutations in RAS genes lead to hyperactivation of downstream pathways, less is known about the additional somatic events that are required for mutant Ras to impart an oncogenic phenotype. In particular, the oncogenic potential of mutant Ras may be dependent on the tissue of origin and the genetic context of the cell. For example, although overexpression of mutant RAS can contribute to tumorigenesis in human epithelial cells (2), overexpression of mutant RAS also has been shown to result in oncogene induced senescence in human fibroblasts (3). Additionally, recent studies have demonstrated that tissue specific expression of other tumor suppressors can also influence the carcinogenic potential of mutant KRAS (4).
It is also uncertain as to why mutations in RAS genes and PIK3CA, the gene encoding the p110α subunit of PI3 Kinaseα, are found concurrently in human cancers since both mutations result in increased signaling through the MAP Kinase and PI3 Kinase pathways (5–7). Specific selective pressures may allow for the emergence of such double mutant tumors and indeed, recent studies suggest that the presence or absence of mutant KRAS with mutant PIK3CA can alter drug resistance and sensitivity to various inhibitors in the MAP Kinase and PI3 Kinase pathways (8, 9). More recent studies propose that activation of the PI3 Kinase pathway may be dominant and override senescence that can be seen with overexpression of mutant Ras thus conferring a growth advantage for double mutant cancer cells (10).
Although tissue specificity undoubtedly is a factor when assessing the oncogenic potential of mutant KRAS, our prior work and the results of others demonstrated that somatic cell “knock in” of a single KRAS mutation in immortalized human breast epithelial cells and mouse liver cells did not result in any obvious phenotype (11, 12). It is possible that the tissue specific and/or genetic context of these two different cell types precluded the ability for mutant KRAS to elicit any appreciable phenotype. However, arguing against this is the fact that overexpression of a transgene mutant KRAS cDNA in these cell lines led to expected transformed phenotypes. These results could be explained by the fact that increased copy number/expression of mutant KRAS may be needed to impart a cancerous phenotype. Indeed, studies have reported that increased copy number of mutant KRAS is found in a significant fraction of human tumors (13), suggesting that multiple copies of mutant KRAS may impart a stronger oncogenic signal than a single mutant KRAS allele. Seemingly in contrast to this latter finding, sophisticated mouse tumor models incorporating single latent and/or conditional alleles of mutant KRAS have been developed, but interestingly the tumors that arise from these mice often have increased copy numbers of mutant KRAS (14), again implying that a single copy of mutant KRAS can predispose to, but is not sufficient for tumor formation.
In contrast to the somatic cell knock in models, elegant work in colorectal cancer cell lines has demonstrated that selective single allele “knock out” of mutant versus wild type KRAS leads to dramatic effects including decreased tumorigenicity and other features of transformation in vitro (15, 16). However, the DLD1 and HCT-116 cell lines used in these studies also harbor other mutations including single allelic oncogenic PIK3CA mutations in exons 9 and 20, respectively (17). Interestingly, these cell lines are derived from colorectal cancers with a microsatellite instability (MIN) phenotype, leading to a mostly diploid genome. We reasoned that in cancers less prone to increased copy number variations such as MIN tumors, a single mutant KRAS by itself may not be oncogenic, but this may select for other cooperative oncogenic mutations. Given data demonstrating that mutant KRAS signals through the Ras Binding Domain (RBD) of p110α (18), and studies showing oncogenic PIK3CA mutations activate the MAP kinase pathway (6, 19), we hypothesized that a single allele of mutant KRAS could impart transformative features when placed in the context of oncogenic PIK3CA, possibly through the interaction of Ras/p110α binding via the RBD. Using somatic cell gene targeting, our results demonstrate that mutant KRAS combined with mutant PIK3CA as single copies leads to increased MAP Kinase and PI3 Kinase pathway activation as measured by increased phosphorylation of downstream effectors and in vitro growth and transformation assays. Furthermore, cells with mutant KRAS and mutant PIK3CA formed tumors when grown as xenografts in immunocompromised mice whereas isogenic single mutant KRAS and PIK3CA cell lines do not. Importantly xenografts retain single copies of mutant KRAS and mutant PIK3CA demonstrating that increased copy number of these mutant alleles is not necessary for tumorigenesis. Using human samples from colorectal cancer patients, similar results were seen using a combination of FISH probes and standard sequencing. Mechanistically, cooperativity seen with mutant KRAS and PIK3CA is dependent on Ras/p110α binding as evidenced by functional mutation analysis of the RBD in p110α. In addition, further studies using small molecule inhibitors demonstrate that Pdk1 activation with subsequent downstream phosphorylation of p90RSK is differentially regulated in cells containing both mutant KRAS and mutant PIK3CA compared to their single mutant knock in counterparts. These findings elucidate a new mechanism of how single mutant KRAS and PIK3CA alleles can cooperate to induce a transformed phenotype and explain why concurrent mutations may be selected for in certain cancers.
Materials and Methods
Cell culture
The non-transformed human breast epithelial cell line MCF-10A (20) and its derivatives were grown in DMEM/F12 (1:1) supplemented with 5% horse serum (Hyclone), EGF at 20 ng/ml, insulin at 10 μg/ml, hydrocortisone at 0.5 μg/ml, and cholera toxin at 0.1 μg/ml (hereafter denoted as “supplemented DMEM/F12”). Cell lines with gene targeted PIK3CA mutations were grown in supplemented DMEM/F12 media without EGF. Retroviral infected cells were grown in supplemented DMEM/F12 media with 120ng/ml G418. MDA-MB-231 cells, HCT-116 cells and their derivatives were grown in DMEM media with 5% fetal bovine serum. All supplements were purchased from Sigma-Aldrich unless otherwise noted. MCF-10A and MDA-MB-231 cells were purchased from ATCC. HCT-116 derivatives were a generous gift from Dr. Bert Vogelstein.
Targeted knock in of oncogenic PIK3CA mutations and characterization of clones
Targeted knock in of PIK3CA exon 9 (E545K) and exon 20 (H1047R) mutations into MCF-10A cells already carrying a heterozygous KRAS G12V knock in mutation was conducted as previously described (6). We isolated two independently derived knock in clones each for E545K and H1047R mutations, as well as one randomly integrated control clone for each targeting vector. We also derived a “Targeted Wild Type” control for the E545K targeting vector whereby gene targeting had occurred at the correct locus, but the mutation in the homology arm was not retained, likely due to an early cross over event during homologous recombination as previously described (11). The knock in clones were determined to be single targeted homologous integrants with equal expression of mutant and wild type PIK3CA through PCR and direct sequencing of gDNA and cDNA, respectively (Figure S1). Single stranded cDNA was generated using First Strand cDNA Synthesis Kit (Amersham Biosciences) following the manufacturer’s directions. Primer sequences for PCR amplification and sequencing are shown in Table S6.
Cell proliferation and drug inhibitor assays
For cell growth assays in EGF-free conditions, exponentially growing cells were washed with HBSS twice and seeded in DMEM/F12 medium without EGF, using 1% charcoal dextran-treated fetal bovine serum, using 1% charcoal dextran treated serum, insulin at 10 μg/ml, hydrocortisone at 0.5 μg/ml, and cholera toxin at 0.1 μg/ml, without EGF or with 0.2 ng/ml EGF as indicated, Cells were seeded at a density of 2×10⁴ cells/well of a 6-well tissue culture dish on day 0. Medium was changed every third day. Cells were harvested on days 1, 6, 11, and 16, and cell numbers were counted using a Beckman Coulter counter. In some assays, cells were also stained with crystal violet (Sigma) after 3 days, or when cells in control flasks were ~90–95% confluent, diluted in formalin at a concentration of 2 mg/ml. For drug inhibitor assays, U0126 and rapamycin were purchased from Cell Signaling (Danvers, MA). Compounds were dissolved in DMSO which was also used as a vehicle only control in drug assays and used at concentrations of 1uM for U0126 and 1nM for rapamycin. GSK2334470 was purchased from Sigma and used at 5uM after establishing dosing curves for the cell lines. Drugs were added to cells with media changes as described above for proliferation assays. All assays and growth conditions were performed in triplicate and repeated at least twice.
Colony formation assay in semisolid medium and acinar morphogenesis assay
For colony formation assays, 3×10⁴ exponentially growing cells were cast in 3 ml of top-layer medium comprised of supplemented DMEM/F12 and 0.4% UltraPure Agarose (Invitrogen) and poured on top of a 2 ml bottom layer containing 0.6% agarose in 6-well tissue culture plates. Supplemented DMEM/F12 was added to the wells once a week. After 3 weeks of incubation, the colonies were stained with MTT (2-(3,5-diphenyltetrazol-2-ium-2-yl)-4,5-dimethyl-1,3-thiazole bromide) and visually inspected for colonies. Photos were taken with a phase contrast microscope (Nikon). Morphogenesis assays were carried out as previously described (21). Photographs were taken under phase contrast microscopy after three weeks of incubation.
Immunoblotting
Cells were seeded in media using EGF-free conditions for proliferation assays. HCT-116 derivative cells were seeded in media using EGF-free DMEM media with 0.5% charcoal dextran-treated fetal bovine serum. Cells were harvested after 48 hours for protein lysates, and immunoblotting was performed as previously described (11). In experiments with inhibitors, after 24 hours, the media was then changed so that cells were incubated for an additional 24 hours with or without drugs. Briefly, whole cell protein extracts prepared in Laemmli sample buffer were resolved by SDS-PAGE using NuPAGE gels (Invitrogen), transferred to Invitrolon PVDF membranes (Invitrogen), and probed with primary antibody followed by incubation with horseradish peroxidase-conjugated secondary antibodies. The primary antibodies used in this study include anti-p70 S6Kinase rabbit antibody (9202; Cell Signaling Technology), anti-phospho p70 S6Kinase rabbit antibody (9205S; Cell Signaling Technology), anti-p44/p42 MAP kinase rabbit antibody (9102; Cell Signaling Technology), anti-phospho p44/p42 MAP kinase (Thr 202/Tyr 204) mouse antibody (9106; Cell Signaling Technology), anti-AKT rabbit antibody (9272; Cell Signaling Technology), anti-phospho AKT (Ser 473) rabbit antibody (9271; Cell Signaling Technology), anti-phospho p90RSK (Ser380) rabbit antibody (9341; Cell Signaling Technology), anti-phospho p90RSK (Ser380) rabbit monoclonal antibody (9335; Cell Signaling Technology), anti-phospho p90RSK (Ser221) rabbit monoclonal antibody (3556; Cell Signaling Technology), anti-RSK1 rabbit antibody (9333; Cell Signaling Technology), anti-phospho S6 (Ser 235/236, Ser 240/245) rabbit antibody (4858, 2215; Cell Signaling Technology), anti-S6 rabbit antibody (2217; Cell Signaling Technology), anti-phospho 4E-BP1 (Thr 37/46) rabbit antibody (2855; Cell Signaling Technology), anti-4E-BP1 rabbit antibody (9644; Cell Signaling Technology), anti-PDK1 rabbit monoclonal antibody (5662; Cell Signaling Technology), anti-phospho PDK1 (Ser241) rabbit polyclonal antibody (3061; Cell Signaling Technology), anti-phospho PDK1 (Ser241) rabbit monoclonal antibody (3438; Cell Signaling Technology), and anti-GAPDH mouse antibody (6C5) (ab8245; Abcam).
Xenograft Assays
For each group, ten 8- to 10-week-old female athymic nude mice (Taconic) were injected subcutaneously in either flank with 200 μl mixture containing 3×10⁶ cells in 20% PBS and 80% Matrigel. After the appearance of palpable tumors, tumor volumes were analyzed biweekly and calculated by multiplying length, width, and height for each individual tumor. Some tumors were excised and readapted to culture while others were fixed in 10% formalin and embedded in paraffin after animals were euthanized at the end of the experiments. The National Institutes of Health Guide for the Care and Use of Laboratory Animals was followed in all experiments.
Immunohistochemistry
Immunohistochemical labeling of xenografts was performed on paraffin-embedded samples. Briefly, 4 μm sections were deparaffinized in xylene for 30 minutes and rehydrated using graded ethanol concentrations. Sections were stained with hematoxilyn and eosin using standard techniques and tumors photographed under various magnifications.
Retrovirus
Two pLXSN PIK3CA vectors were created using RT-PCR to clone cDNA with an activating PIK3CA mutation (either E545K or H1047R, respectively) as well as two RBD mutations (T208D and K227A). Mutations were introduced using PCR site directed mutagenesis (22). Retroviral vector was produced using AmphoPack-293 cells (BD Clontech) according to the manufacturer’s instructions and used for cell infection with 8 ng/mL of polybrene (Sigma-Aldrich). Antibiotic selection was started 3 days post infection and continued for 2 weeks before performing assays.
Quantitative real time PCR analyses
Cells were seeded at equal density and harvested the next day for gDNA using QIAamp DNA blood mini kits (Qiagen). Real time quantitative PCR was then performed as previously described (23). Primers used for real time PCR are listed in Table S6.
FISH
To prepare cell culture samples for FISH, cells were propagated in exponential growth condition, dissociated with trypsin, incubated in 40 mM KCl for 15 minutes at 37 °C, fixed with 3:1 mixture of methanol and glacial acetic acid, and then dropped onto glass slides. For probes, DNA was extracted from BAC clones and labeled by nick translation with Green dUTP or Red dUTP (Abbott Laboratories) using DNA polymerase/DNase I (Invitrogen). Slides and probes were denatured and hybridized over night at 37 °C in a humidity chamber. Slides were counterstained with 4′,6-diamidino-2-phenylindole (DAPI) prior to allele counting in approximately 200 interphase cells per probe per cell clone under fluorescence microscopy.
Cell Cycle Analysis with Flow Cytometery
Cells were seeded in 6-well plates and were then harvested the next day. Cells were fixed in phosphate buffered saline/3% formaldehyde/0.4% NP-40 containing 2 μg/mL Hoechst 33258 (Invitrogen). DNA content was measured with a BD LSR flow cytometer (BD Biosciences), and percentages of G1/G0, S, and G2/M phase cells were determined using Modfit LT software (Verity Software House).
Statistical Analysis
All statistical analyses were performed using GraphPad InStat software (La Jolla, CA). A P value of less than 0.05 was considered significant.
RESULTS
Gene targeting to create mutant KRAS/PIK3CA knock in cell lines
To address the hypothesis that mutant KRAS as a single copy may be oncogenic in the context of mutant PIK3CA, we performed gene targeting to separately knock in oncogenic PIK3CA mutations (E545K and H1047R) into MCF-10A cells already containing a KRAS G12V mutation that had been generated via somatic cell gene targeting (11). MCF-10A is a spontaneously immortalized non-tumorigenic human mammary epithelial cell line that is genetically stable with a mostly diploid karyotype (20, 24). Importantly, various models using transgene overexpression have demonstrated that MCF-10A cells can be transformed with mutant oncogene overexpression and selection in vivo as xenografts (25). We employed two vectors as described (6) to knock in the oncogenic hotspot PIK3CA mutations E545K and H1047R located in exons 9 and 20 of the PIK3CA gene, respectively. Using a pooled screening strategy (26), multiple gene targeting events were identified and two double knock in (DKI) clones were generated with each mutant PIK3CA targeting vector. Determining the relative ratios using sequencing analysis confirmed a single gene targeted event as well as equal expression from both alleles (Figure S1A). We also generated a gene-targeted wild type control clone dubbed Targeted WT (KRAS G12V/PIK3CA E545E) wherein homologous recombination occurred without integration of the PIK3CA E545K mutation (Figure S1). In addition, we isolated one non-gene targeted random integrant (RI) control for each vector. A complete list of the cell lines generated and used in this study can be found in Table S1.
Mutant KRAS cooperates with mutant PIK3CA in vitro
To characterize DKI cells for properties of transformation, we employed a number of different in vitro assays as previously described (6, 11, 27). MCF-10A cells require epidermal growth factor (EGF) for continuous proliferation, and growth factor independence is often associated with a transformed phenotype. In previous studies, KRAS G12V knock in mutations did not yield appreciable growth factor independence in human mammary epithelial cell lines, while PIK3CA single knock in mutations, E545K and H1047R, conferred EGF independence (6, 11). We found that in the absence of EGF, the DKI cells have increased proliferation rates compared to single PIK3CA knock in cell lines, thus exhibiting an enhanced growth effect of these two mutant oncogenes (Figure 1). This effect appears synergistic since mutant KRAS single knock in cells have no obvious phenotype and the two mutations together are therefore greater than the sum of the individual parts. Cell cycle analyses using flow cytometry was performed and demonstrated an increase in S phase in DKI cells compared with control and single mutant PIK3CA cell lines (Table S2). We then cultured DKI clones and control cells in semi-solid medium in order to assess their capacity to form anchorage-independent colonies, another feature of transformation in vitro. In this assay, equal number of cells were plated, and DKI clones formed colonies that were relatively small and fewer in number compared to the positive control of mutant KRAS overexpressing cells (Table S3), but were clearly present relative to control and single knock in cell lines (Figure 2). Subsequently we grew DKI clones in Matrigel, a three-dimensional basement membrane culture that supports acini formation of mammary epithelial cells in vitro (28). KRAS and PIK3CA single knock in clones showed no structural difference from wild type MCF-10A cells as previously reported (Figure S1B). In contrast, DKI clones showed striking phenotypic changes, including protrusions at the borders of acini, bridging between neighboring acini, and loss of structural integrity. These features resemble the invasive process of cancers and can also be seen in single PIK3CA knock in clones supplemented with high doses of EGF as previously described (27), suggesting that DKI cells may have increased activation of MAP Kinase and PI3 Kinase pathways.
Figure 1. Double mutant KRAS and PIK3CA cells show synergistic growth effects in EGF-independent condition.
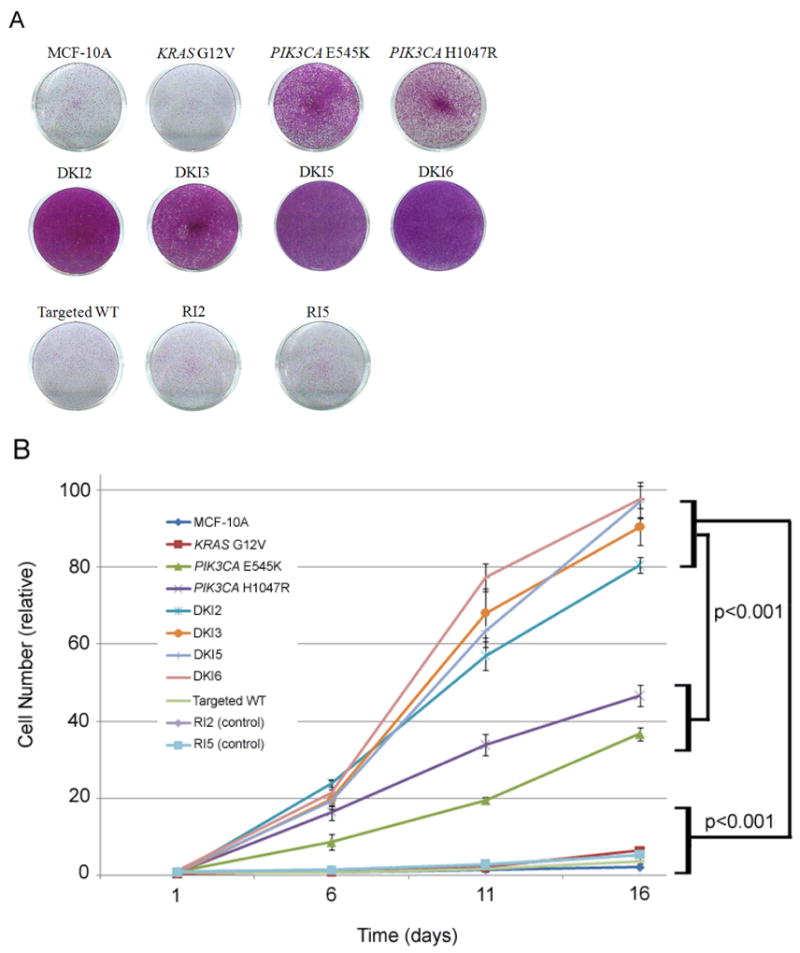
A, Cells were seeded at equal density in 6-well plates, grown in the absence of EGF for 10 days, and then stained with crystal violet to visualize cell viability and proliferation.
B, Cells were seeded at equal density in 6-well plates, grown in the absence of EGF for 16 days, and counted on days 1, 6, 11, and 16. Error bars represent SEM of triplicate samples. Results are representative of 5 independent experiments. Please see Supplemental Table S1 for cell line nomenclature.
Figure 2. Double mutant KRAS and PIK3CA cells form colonies in soft agar.

Representative colony formation of MCF-10A and its derivatives in semisolid medium cultured for 3 weeks in 6-well plates. MCF-10A cells constitutively overexpressing mutant KRAS G12V (LXSN KRAS V12) cells were used as a positive control (bottom right). Magnification: x40.
DKI cells form tumors in immunocompromised mice and retain single copies of mutant KRAS and PIK3CA
The ability to form tumors in immunocompromised mice is often a hallmark of in vivo transformation. We subsequently tested DKI clones in xenograft assays using athymic nude mice. Consistent with previous data, KRAS and PIK3CA single knock in clones were not capable of tumor formation (6, 11). In contrast, all DKI clones formed tumors within two weeks of inoculation (Figure 3A). However, on average DKI clones formed small tumors relative to established breast cancer cell lines such as MDA-MB-231 (Figure 3B), and in extended experiments, the majority of tumors reached a plateau in growth by week 5 and approximately 20% of tumors regressed. Hemotoxylin and eosin staining from DKI tumors resected at week 4 demonstrated well-defined borders with increased lymphocytic infiltration and cellular proliferation in ductal lumens, resembling human breast papillomas (Figure 3C). Interestingly, human breast papillary lesions, particularly those accompanied by findings of hyperplasia and atypical ductal hyperplasia, have been shown to have a high prevalence of PIK3CA mutations (29). Resection of xenografts and adaptation back to tissue culture verified the mutational status of the cell lines using direct sequencing of PCR products with genomic DNA as template. This analysis demonstrated that the allelic ratios of wild type to mutant KRAS and PIK3CA were identical to the original cells used for inoculation (Figure S2A). Further studies using quantitative real time PCR performed on gDNA confirmed that the relative copy number of KRAS alleles and PIK3CA alleles remained the same in xenograft tumors compared to parental MCF-10A, single KRAS G12V and pre-inoculation DKI cell lines (Figure S2B, C). Finally, fluorescence in situ hybridization (FISH) was used with gene specific probes for KRAS and PIK3CA. All cell lines including cell lines isolated from DKI xenografts tumors demonstrated two copies each of KRAS and PIK3CA identical to parental and input DKI cell lines (Figure S2D). These data confirm that single mutant copies of both KRAS and PIK3CA are sufficient for initiating and maintaining tumorigenesis, whereas mutation of either KRAS or PIK3CA as single copies is not adequate for tumorigenesis but likely predisposes to tumor formation.
Figure 3. Double mutant KRAS and PIK3CA cells form tumors in athymic nude mice.

A, DKI cells or B, MDA-MB-231 (positive control) cells were inoculated and grown as xenografts in nude mice as described in Materials and Methods. Results are average tumor volumes from five mice in each group and represent three independent experiments.
C, Histology of DKI tumor xenograft tissue in nude mice. Tumor xenografts were harvested 4 weeks post inoculation. Representative tumor xenograft slides were stained with hematoxylin and eosin. Magnifications: 100x in top row, 400x in bottom row. All DKI tumor xenografts show increased cell proliferation and lymphocyte invasion.
Consistent with these in vivo results, previous studies have shown that knock out of a single mutant KRAS allele in the human colorectal cancer cell lines HCT-116 and DLD1 dramatically affects tumorigenicity (8, 15, 16). Although the original report by Shirasawa et al. described a complete absence of tumor formation, our own unpublished observations and those of others demonstrated that knock out of mutant but not wild type KRAS results in a severely reduced tumorigenic phenotype, though tumor formation occurs in all inoculated mice (8, 15). More recently it has been described that DLD1 and HCT-116 also have oncogenic PIK3CA mutations in exons 9 and 20, respectively (17). In contrast to mutant KRAS knock out cell lines, somatic cell knock out of either the mutant or wild type PIK3CA allele in these cell lines was reported as having no effect on tumorigenicity. However, these results were presented qualitatively as the presence or absence of tumors. In our experiments, knock out of mutant versus wild type PIK3CA in HCT-116 cells led to dramatic differences in tumor volume and longer latency (Figure S3), though similar to the data by Samuels et al., all inoculated mice formed tumors. Taken together, these data suggest that in cancer cells containing a single allele of mutant KRAS and a single allele of mutant PIK3CA, both mutant oncogenes are necessary for conferring increased properties of cellular transformation.
DKI cells have increased phosphorylation of p90RSK and p70S6K
To elucidate how mutant KRAS cooperates with mutant PIK3CA to impart a cooperative phenotype, we analyzed the MAP Kinase and PI3 Kinase pathways via western blot in DKI cells and control cell lines. It has been shown that endogenous knock in of single PIK3CA mutations activates both PI3 Kinase and MAP Kinase pathways, whereas mutant KRAS knock in alone has no effect on downstream molecules in either pathway (6, 11). Using whole cell lysates prepared from cells grown in EGF-free conditions, all DKI clones exhibited increased levels of phosphorylated Erk and Akt compared to single KRAS knock in cells (Figure 4). Interestingly, there appeared to be slightly higher levels of phosphorylated Erk and slightly decreased levels of Akt in the DKI clones relative to single PIK3CA knock in cell lines. However, these observations did not demonstrate pronounced differences between DKI clones and single PIK3CA knock in counterparts that unequivocally accounted for their increased transformed phenotype. Similar to our prior results with single PIK3CA knock in clones, addition of physiologic concentrations of EGF also led to increases in Akt and Erk phosphorylation but at supraphysiologic levels, activation was saturated even in control cells (Figure S4). We then examined additional proteins in the MAP Kinase and PI3 Kinase pathways, p90RSK and p70S6K, respectively. Both p90RSK and p70S6K are protein kinases that when activated lead to the increased transcription and translation of growth promoting genes. Previous studies demonstrated that PIK3CA knock in cells do not activate the mTOR pathway in the absence of EGF despite EGF independent growth, as evidenced by resistance to the mTOR inhibitor rapamycin and the lack of p70S6K phosphorylation, a downstream substrate of mTORC1 (6). As shown in Figure 5A, all DKI clones showed dramatic increases in phosphorylated p70S6K relative to single knock in cell lines and controls, suggesting that in DKI clones, mutant KRAS coupled with mutant PIK3CA leads to hyperactivation of the PI3 Kinase pathway with subsequent downstream activation of mTOR. The slight decrease in Akt phosphorylation seen in DKI clones is consistent with this notion, as there is a known negative feedback between mTORC1 and PI3 Kinase activation (30, 31). In addition, recent evidence suggests that the presence of mutant KRAS with PIK3CA mutations can lead to increased phosphorylation of p90RSK, a substrate of phosphorylated Erk (8). As shown in Figure 5A, DKI cell lines demonstrated increased p90RSK phosphorylation relative to single knock in cells and controls suggesting that the presence of mutant KRAS with mutant PIK3CA also increases activation of the MAP Kinase pathway. We also examined substrates of p70S6K and p90RSK that is, phosphorylation of S6 ribosomal protein and 4E-BP1. As shown in Figure S5, phosphorylation of S6 was markedly increased in DKI cells relative to controls and single mutant PIK3CA knock in cells, whereas somewhat surprisingly, no increases in phosphorylation of 4E-BP1 were noted. The reasons for this are unclear but may be due to altered “rewiring” of signaling pathways that can occur when oncogenes become mutated. To determine if these results were reproducible in other cell types, we obtained the HCT-116 mutant versus wild type KRAS knock out cell lines (32) and examined their p90RSK and p70S6K phosphorylation status. As seen in Figure 5B, knock out of mutant KRAS (KRAS WT) relative to knock out of wild type KRAS (KRAS mut) led to significant reductions in p90RSK and p70S6K phosphorylation consistent with results in MCF-10A cells. Collectively, these data suggest that the phenotype seen with DKI clones is the result of hyperactivation of the MAP Kinase and PI3 Kinase pathways.
Figure 4. DKI cell lines show phosphorylation of Akt and Erk.
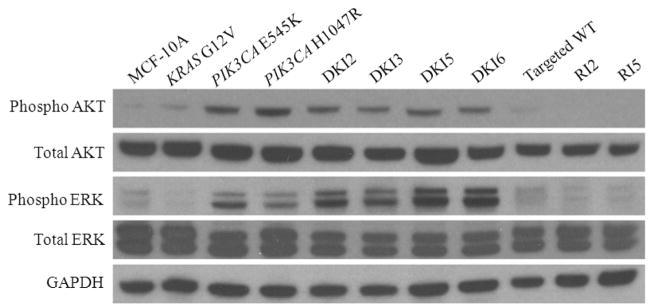
Western blot demonstrating levels of phosphorylated Akt (Ser-473), total Akt, phosphorylated Erk (Thr-202/Tyr-204), total Erk, in DKI cell lines and controls in the absence of EGF. GAPDH is shown as a loading control.
Figure 5. DKI cells have increased phosphorylation of p70S6K and p90RSK.

Western blot demonstrating levels of phosphorylated p70S6K (Thr389), total p70S6K, phosphorylated p90RSK (Ser380), and total p90RSK in cell lines grown in the absence of EGF for A, DKI cells along with MCF-10A and controls,
B, HCT-116 cells with a single copy of mutant KRAS (KRAS mut) and a single copy of wild type KRAS (KRAS WT). GAPDH is shown as a loading control.
To gain further insight into the dependence of the MAP Kinase versus the PI3 Kinase pathways for the increased transformed phenotypes seen in DKI cells, we performed growth assays with the MEK inhibitor U0126 and the mTOR inhibitor rapamycin as previously described for single mutant PIK3CA knock in cells (6). As shown in Figure S6A, U0126 treatment was selectively more toxic to DKI cells versus single mutant PIK3CA knock in cells. It should be noted that under these assay conditions without EGF, parental MCF-10A and mutant KRAS G12V cells do not proliferate and thus we cannot truly compare them with single mutant PIK3CA and DKI cells in terms of relative growth inhibitory effects as we previously reported (6), though the data are shown for illustrative purposes. In contrast, rapamycin had relatively little effect under no EGF conditions for both single mutant PIK3CA knock in cells as previously reported (6), and DKI cells (Figure S6B). In our prior work (6), lack of mTOR activation in no EGF conditions explained rapamycin resistance, yet mTOR activation is clearly present in DKI cells. Western blot analyses of DKI cells versus parental MCF-10A cells demonstrated that Mek inhibition with U0126 led to slight decreases in p70S6K phosphorylation, and minimal decrease to no change in p90RSK phosphorylation, however, rapamycin treatment had the predicted effect of dramatically reducing phosphorylation of p70S6K, but the unexpected finding of increased phosphorylation of p90RSK (Figure S6C). Although the mechanism of this is unknown, it is highly reminiscent of the known inhibition of the negative feedback loop that is seen with rapamycin leading to increased PI3 Kinase pathway activation as previously mentioned (30, 31), and may represent an explanation of how combined mutant KRAS with mutant PIK3CA leads to resistance against mTOR inhibitors as described by Bardelli and colleagues (8). To examine the effects of rapamycin on Akt phosphorylation on DKI cells, lysates with and without rapamycin were probed (Figure S6D, top panel). Interestingly, DKI5 and DKI6 (KRAS G12V/PIK3CA H1047R) clones demonstrated the expected increase in Akt phosphorylation upon rapamycin treatment, however, DKI2 and DKI3 clones (KRAS G12V/PIK3CA E545K) showed decreased Akt phosphorylation. The reasons for this are not entirely clear, but reinforce the data of Vogt and colleagues that previously demonstrated differential requirements for Ras binding between PIK3CA mutations (33). Regardless, the fact that rapamycin led to a change in Akt phosphorylation, albeit in different directions depending on the PIK3CA mutation, demonstrates that DKI cells retain signaling through Akt via the mTOR pathway. In addition, all DKI clones increased MAP Kinase activation upon rapamycin treatment as evidenced by increased Erk phosphorylation as previously seen in single PIK3CA knock in clones (6). In addition, to assess the degree of MAP Kinase inhibition by U0126, cell lysates from DKI cells were probed for Erk phosphorylation with and without drug treatment (Figure S6D, bottom panel). These results demonstrated a dramatic decrease in Erk phosphorylation with U0126 treatment, but no affect on Akt phosphorylation. Finally, to ensure the rapamycin resistance seen in DKI was not due to technical reasons, we then repeated the assays with physiologic EGF concentrations, as single mutant PIK3CA knock in clones are differentially inhibited with rapamycin under these conditions (6). As shown in Figure S6E, single mutant PIK3CA clones were now sensitive to rapamycin, yet DKI cells retained a relatively resistant phenotype.
To further determine the effects of mutant KRAS and mutant PIK3CA on downstream signaling and growth, additional assays using treatment with both rapamycin and U0126 were performed. As seen in Figure S6F, dual inhibitor treatment produced a western blot pattern that was “predominated” by rapamycin’s effects. That is, slight decreases and increases in Akt phosphorylation occurred in the DKI2, DKI3 and DKI5, DKI6 clones, respectively, along with dramatic decreases in p70S6K phosphorylation. Additionally, Erk phosphorylation was slightly increased in all DKI clones. These results mimicked single treatment with rapamycin in DKI cells. In contrast, phosphorylation of p90RSK appeared “even” in that the minimal decrease with U0126 as a single agent appeared offset by the increase seen with rapamycin alone, yielding a net result of no change. In accord with these results, dual treatment led to a relative resistance phenotype in DKI clones that was still sensitive relative to rapamycin alone, but more resistant than U0126 single treatment (Figure S6G). These results are intriguing in that they may point out potential caveats in treating mutant KRAS and mutant PIK3CA cancers for dual pathway inhibitor trials currently being initiated. Regardless, these data collectively demonstrate that Akt signaling is remains intact in DKI clones and that mTORC1 activity is responsible for p70S6K activation. However, given the minimal increases and decreases in p90RSK phosphorylation, we sought additional mechanisms as to how mutant KRAS cooperates with mutant PIK3CA to impart a transformed phenotype.
Increased phosphorylation of p90RSK and p70S6K in DKI cells is mediated in part by Ras/p110α interaction and Pdk1 activity
We next sought to determine how mutant KRAS cooperates with mutant PIK3CA. Previous work by others demonstrated that mutant Ras signals through the RBD of p110α (18). Based upon these studies, we reasoned that the interaction of mutant Kras specifically with mutant p110α could lead to increased activation of downstream pathways. We tested this hypothesis by mutational analysis of the RBD within p110α. We initially created a gene targeting vector with missense mutations in the RBD (T208D, K227A) similar to prior studies (18), and transduced these vectors into HCT-116 (H1047R) and DLD1 (E545K) colon cancer cell lines to obtain hemizygously targeted clones (data not shown). These missense mutations within the RBD have previously been reported to abrogate Ras/p110α binding while leaving other functions of p110α intact (18). Upon analyzing the cDNA from these clones using RT-PCR, we discovered that in 8 of 8 HCT-116 and 7 of 7 DLD1 clones, the RBD targeting vector had incorporated into the wild type PIK3CA allele (p<0.0001 assuming equal allele targeting frequency) (Table S4). We then used the same vector to target DKI cells and but due to technical reasons, we did not generate sufficient G418 resistant colonies to screen and obtain gene targeted DKI/RBD clones. However at this juncture based upon our results with the HCT-116 and DLD1 cell lines, we decided to employ a different strategy.
First, we created four retroviral vectors with PIK3CA cDNAs, two containing one PIK3CA activating mutation (E545K or H1047R) and the remaining two containing RBD mutations (T208D, K227A) in addition to oncogenic E545K and H1047R PIK3CA mutations (+RBD). The vectors were transduced into MCF-10A and KRAS G12V knock in cell lines and grown in antibiotic containing media. Despite antibiotic selection, we found clones carrying the vectors with RBD mutations lost expression of the cDNA transgene over several weeks (data not shown). We therefore carried out assays using bulk populations of retrovirally infected cells that had been selected with antibiotics for two weeks post infection. We determined via PCR and sequencing of cDNA that infected cells showed approximately equivalent expression levels of exogenous mutant and endogenous wild type alleles at this time point and this expression persisted for approximately two to four weeks (Figure S7A, B). Proliferation assays in the absence of EGF were then performed to assess the effects of RBD mutations on Ras/p110α interactions and downstream signaling events. MCF-10A cells infected with E545K and H1047R cDNAs showed markedly increased proliferation in EGF free conditions similar to single mutant PIK3CA knock in cells (Figure 6A). In contrast, MCF-10A cells expressing the RBD missense mutations demonstrated greatly reduced EGF independent growth, though there was still significant growth relative to empty vector controls. These same experiments were performed in parallel using KRAS G12V knock in cells. As shown in Figure 6B, KRAS G12V knock in cells transduced with E545K or H1047R cDNAs grew independent of EGF at a rate comparable to DKI clones. Consistent with the results in MCF-10A cells, KRAS G12V infected with RBD mutant vectors had greatly reduced rates of proliferation relative to non-RBD mutant vectors, however, they still proliferated at a faster rate than empty vector controls or MCF-10A cells infected with the same vectors. These results suggest there are additional interactions between mutant Kras and mutant p110α, though non-specific transgene effects using these vectors could not be ruled out. Regardless, the studies presented here further underscore the importance of Ras binding to p110α, as this interaction is necessary for full cooperativity between these two mutant oncoproteins leading to a cooperative effect. Interestingly, as mentioned previously some studies have shown differences in exon 9 (E542K, E545K) and exon 20 (H1047R) PIK3CA mutations in their requirement for Ras binding (34), and our results with rapamycin on Akt phosphorylation (Figure S6D) support this notion. However, in contrast our results with these growth assays did not show appreciable differences between E545K and H1047R mutations in the context of RBD mutations. Unfortunately, the transient nature of this system prevented the ability to assess the effects of RBD mutations on longer term assays including Matrigel and xenograft tumorigenicity assays.
Figure 6. Disruption of Ras/p110α binding reduces cooperativity between mutant KRAS and mutant PIK3CA.
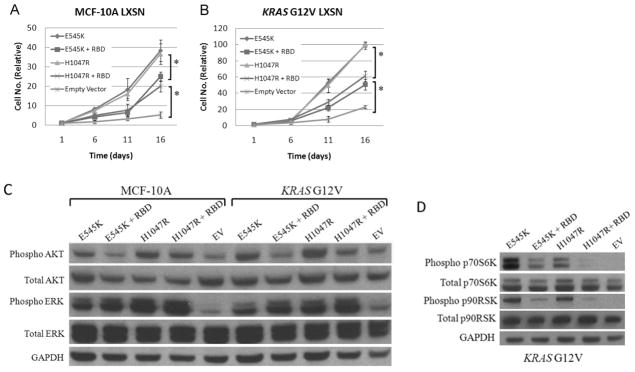
A, MCF-10A (MCF-10A LXSN) and B, KRAS G12V knock in cells (KRAS G12V LXSN) were retrovirally infected with cDNA transgene vectors with either mutant PIK3CA exon 9 (E545K) or mutant PIK3CA exon 20 (H1047R) cDNAs or with the same vectors with mutations in the Ras binding domain (+ RBD) as shown in Figure S7. Empty vector controls were also included. Error bars represent SEM of triplicate samples. Results are representative of 5 independent experiments. *p<0.001.
C, Western blot showing levels of phosphorylated Akt (Ser-473), total Akt, phosphorylated Erk (Thr-202/Tyr-204), and total Erk in MCF-10A and KRAS G12V cell lines transduced with mutant PIK3CA cDNAs (E545K, H1047R), mutant PIK3CA cDNAs with Ras binding domain mutations (+RBD), or empty vector (EV) controls after 24 hours in culture in the absence of EGF.
D, Western blot demonstrating levels of phosphorylated p70S6K (Thr389), total p70S6K, phosphorylated p90RSK (Ser380), and total p90RSK in KRAS G12V cells transduced with mutant PIK3CA cDNAs (E545K, H1047R), or mutant PIK3CA cDNAs with Ras binding domain mutations (+RBD), or empty vector control (EV) after 24 hours in culture in the absence of EGF. GAPDH is shown as a loading control.
To further characterize the cooperativity seen with mutant KRAS and mutant PIK3CA, we performed additional western blot experiments using our retroviral system. Both MCF-10A and KRAS G12V knock in cells transduced with mutant PIK3CA cDNAs resulted in relatively equivalent increased levels of phosphorylated Akt, however cells infected with mutant PIK3CA cDNAs containing RBD mutations showed a relative decrease in phosphorylated Akt (Figure 6C). Given that oncogenic PIK3CA mutations are thought to constitutively active the PI3 Kinase enzyme, this result was somewhat unexpected but suggests that oncogenic PIK3CA mutations require Ras binding for PI3K activation, an observation that helps to explain our results with RBD gene targeting of the HCT-116 and DLD1 cancer cell lines. In addition, Erk phosphorylation was increased at relatively equal levels in both MCF-10A and KRAS G12V transgene expressing cells akin to PIK3CA single knock in and DKI clones. In striking contrast to Akt phosphorylation, RBD mutations appeared to have no effect on Erk phosphorylation. The reasons for this are unclear but may suggest that mutant PIK3CA activates the MAP Kinase pathway in an RBD independent manner, and this may account for the residual EGF independent cell proliferation seen in Figure 6A. As expected under these conditions, MCF-10A cells infected with either E545K or H1047R mutant PIK3CA cDNAs displayed minimal to no increases in p70S6K and p90RSK, identical to single mutant PIK3CA knock in cells (data not shown). In contrast, when virally transduced KRAS G12V cells were examined for phosphorylated p70S6K and p90RSK, cells expressing an intact RBD demonstrated increased phosphorylation of these downstream effectors, while corresponding cDNAs with RBD mutations were attenuated (Figure 6D). Interestingly, the effect of RBD mutations appeared much greater on phosphorylated p70S6K than with phosphorylated p90RSK consistent with the results of Akt and Erk phosphorylation. Taken together, our results show that a significant component of mutant Ras/p110α cooperativity is mediated via the RBD, though additional interactions may also account for this increase in transformed phenotype.
The increased phenotype seen in DKI cells clearly was associated with increased phosphorylation of p70S6K and p90RSK. Although our RBD gene targeting and transgene experiments demonstrated that part of this effect was mediated by the RBD of PIK3CA, additional pathways must exist. A prior study had previously demonstrated differential membrane association of PI3 Kinase, Akt and Pdk1 in HCT-116 cells, which depended on whether the cells had a single mutant KRAS allele vs. no mutant KRAS vs. mutant HRAS overexpression (35). Pdk1 is thought to be an important substrate of PI3 Kinase and directly phosphorylates specific residues of key downstream effectors such as Akt and p90RSK (36). We had initially examined Pdk1 phosphorylation and found no significant differences between DKI cells versus control and single knock in cell lines using two separate anti-bodies (Figure S8A). However, we then examined phosphorylation of Pdk1’s specific downstream p90RSK phosphorylation substrate, Ser221. To become fully activated Ser221 must be phosphorylated by Pdk1 after initial phosphorylation at separate serine and threonine residues by Erk (36). Of note, the prior phosphorylation site we assayed by western blot was Ser380 which is a substrate of Erk. Similar to Ser380 phosphorylation, baseline levels of p90RSK Ser221 phosphorylation were elevated in DKI cells compared to controls (Figure S8B top panel). However, when treated with a specific Pdk1 inhibitor in preclinical development, GSK2334470 (37), major differences in Ser221 p90RSK phosphorylation were observed. As seen in Figure S8B (bottom panel), after treatment with GSK2334470, parental MCF-10A cells have no detectable Ser221 phosphorylation, while mutant KRAS knock in cells displayed a low level of phosphorylation. In contrast, single PIK3CA knock in cells displayed increased Ser221 phosphorylation relative to mutant KRAS cells, but most notably, DKI cells had pronounced Ser221 phosphorylation compared to single knock in and control cell lines. Under these conditions, cell growth was significantly reduced in single mutant PIK3CA knock in clones but not in DKI cell lines (Figure S8C) suggesting incomplete inhibition of Pdk1 in DKI cells. Again, under no EGF conditions, parental MCF-10A and mutant KRAS knock in cells do not proliferate, thereby making growth inhibition impossible to evaluate though the data are included for illustrative purposes. These results strongly suggest that mutant KRAS and mutant PIK3CA are capable of activating Pdk1 and that when combined, this activity is increased leading to elevated levels of phosphorylated p90RSK Ser221. Moreover, this is not a direct effect of increased Pdk1 phosphorylation as baseline levels of Pdk1 phosphorylation remain unchanged in all cell lines regardless of mutation status.
Our study and those of others suggested that mutant KRAS as a single allele requires a “second hit” to affect a phenotype, and this could be either increased copy number of mutant KRAS, or a second cooperating mutation e.g. mutation of a single PIK3CA allele. In concordance with this finding, initial analysis of archived colorectal cancer samples demonstrated that mutations in other oncogenes were more common in tumors with wild type KRAS or heterozygous mutant/wild type KRAS, compared to samples where only mutant KRAS was detected (Table S5). Unfortunately, copy number data was not available for these samples. Nonetheless, given these data and our DKI xenografts studies, we hypothesized that in cancers with a MIN phenotype, a more common mechanism may be to mutate a second oncogene given the nature of microsatellite instability, though certainly copy number changes can and do occur in MIN tumors and conversely, non-MIN tumors can also have mutations in both mutant KRAS and other cooperating oncogenes such as PIK3CA. However, we obtained a limited number of new colorectal cancer patient samples with KRAS mutations and PIK3CA mutations from four MIN cancers, as well as four non-MIN cancers with KRAS mutations but with wild type PIK3CA. We then tested their allelic ratios by standard sequencing of genomic DNA, as well as their gene copy number status of KRAS and PIK3CA using FISH. As seen in Figure 8 and Figure S9, MIN cancer cells had equivalent ratios of mutant to wild type KRAS and PIK3CA. Further analysis by FISH confirmed that these cancer cells had two copies each of KRAS and PIK3CA demonstrating that there were single alleles of mutant and wild type KRAS and PIK3CA. In contrast, three of four non-MIN tumors demonstrated homozygous mutant KRAS by standard sequencing, however, all samples demonstrated two or more copies of mutant KRAS by FISH, supporting our findings that a single copy of mutant KRAS requires additional genetic events for functional significance.
DISCUSSION
The role of mutant KRAS towards carcinogenesis and maintenance of a cancerous phenotype has been extensively studied. Mouse models in particular have proven that a single mutant KRAS allele predisposes towards the development of certain tumors (38). However, although these elegant models clearly demonstrate an increased susceptibility towards tumor development with a single mutant KRAS allele, most of these studies do not directly address the minimum genetic alterations that are required for mutant KRAS to elicit a transformed phenotype for establishing tumors. Jacks and colleagues demonstrated that increased mutant KRAS copy numbers can be found in tumors arising from mice with a single “latent” mutant KRAS allele (14), suggesting that increased copy number may be one method that mutant KRAS imparts oncogenic effects. On the other hand, somatic cell gene knock out of mutant KRAS in the colorectal cancer cell lines HCT-116 and DLD1 has unequivocally demonstrated that a single mutant KRAS allele can dramatically affect tumorigenicity (16). It was therefore striking that our previous studies and those by Arena et al. demonstrated no appreciable effects of knocking in a single mutant KRAS mutation in human breast epithelial cells and mouse liver cells (11, 12). This led to our hypothesis that in cells that are less prone to gains and losses in gene copy number such as colorectal cancers with defects in mismatch repair pathways (microsatellite instability or MIN), mutant KRAS as a single copy requires cooperativity with other oncogenes to bring about a transformed phenotype. In the case of the HCT-116 and DLD1 colorectal cancer cell lines, single copies of mutant PIK3CA appear to fulfill this requirement as knock out of either mutant KRAS or mutant PIK3CA dramatically affects tumorigenicity, the latter result being presented in the current study. However, these data need to be interpreted with caution, as there are clear examples of MIN cancers that can have an increased copy number of mutated oncogenes, as well as non-MIN tumors that harbor mutations in cooperating oncogenes. We hypothesize and demonstrate in a limited number of samples, that MIN tumors are more likely to harbor single copies of mutant oncogenes, but importantly we acknowledge that increased copy number can be found in these tumors. Indeed, increased copy number may impart additional selective advantages during tumor evolution, drug resistance etc., such that cancers with mutations in both KRAS and PIK3CA with increased copy number of one or both mutant genes will be seen at some frequency. Similarly, non-MIN tumors may initially have increased copy number of a mutated oncogene such as KRAS, but develop additional mutations in other oncogenes during tumor evolution. Thus, the main focus of our study is that mutant KRAS as a single copy is insufficient to impart a phenotypic change, but that an additional alteration is required prior to any functional consequence. Further studies are ongoing to elucidate the consequences of increasing copy numbers of mutant KRAS and/or PIK3CA in these experimental systems and its relevance to tumor evolution and drug resistance.
Concordant with the data using MIN colorectal cancer cells, our study demonstrates that double knock in of mutant KRAS and mutant PIK3CA in the genetically stable human breast epithelial cell line MCF-10A, leads to tumor formation and importantly, tumors that arise from these DKI cells retain single copies of mutant KRAS and mutant PIK3CA. However, it is notable that additional mutations and pathway activation beyond mutant KRAS and PIK3CA is likely required for full tumorigenicity, as DKI cell lines were tumorigenic, but did not appear invasive upon histologic evaluation. Consistent with this notion, knock out of mutant KRAS or mutant PIK3CA in HCT-116 and DLD1 cell lines has a pronounced effect on tumorigenicity, but does not completely abrogate tumorigenesis. Given the MIN phenotype of these cell lines, it is likely that additional mutations in other pathways would be selected for during xenograft formation that accounts for the emergence of smaller tumors with a longer latency.
How mutant KRAS and mutant PIK3CA cooperate was also addressed in our studies. Using HCT-116 KRAS knock out cell lines as well as MCF-10A single and DKI cells, we demonstrated that additional signaling through the MAP Kinase and PI3 Kinase pathways occurs in cells with mutations in both KRAS and PIK3CA as measured by increased phosphorylation of p90RSK and p70S6K. To further elucidate the mechanism of this interaction, we employed transgene expression using mutant PIK3CA cDNAs with and without RBD mutations, as our gene targeting experiments were hampered by the finding that RBD missense mutations preferentially targeted the wild type PIK3CA allele. This latter finding suggests that the interaction between mutant KRAS and mutant PIK3CA may lead to an oncogene addiction phenotype that is selected for in these double mutation positive cells. Although we demonstrated that RBD mutations greatly attenuate the proliferative effects of mutant Kras/p110α interaction, oncogene cooperativity was not completely abolished suggesting additional interactions between mutant Kras and mutant p110α. Further investigation into this interaction led to the findings that Pdk1 activity as measured by p90RSK Ser221 phosphorylation is increased in single knock in KRAS mutant and PIK3CA mutant cells, and dramatically increased in DKI cells upon pharmacologic inhibition at doses that completely abrogate Pdk1 activity in parental MCF-10A cells. The basis for this increased Pdk1 activity in DKI cells is unknown, but is not due to increased Pdk1 phosphorylation. Based upon a model using HCT-116 KRAS knock out cells (35), it is possible that membrane association of Pdk1 is differentially regulated in cells that harbor mutant KRAS, and indeed in this study overexpression of mutant HRAS led to changes in membrane association of Pdk1, Akt and PI3 Kinase suggesting a potential explanation for the effects of mutant KRAS overexpression /increased copy number to impart a phenotype. Further work into this phenomenon is currently underway. Interestingly, during the preparation of this manuscript Eser et al. published a manuscript demonstrating the Pdk1 is a downstream effector of mutant KRAS in models of pancreatic cancer (39). Taken together, our results suggest that the oncogene cooperativity seen with concurrent mutations in KRAS and PIK3CA are mediated by both Ras/p110α interaction and signaling through Pdk1 that directly mediates p90RSK activity.
An unanswered question regarding the current and past studies is the activation of the MAP Kinase pathway by mutant PIK3CA. Based on the known interaction between Kras and p110α we initially felt this could mediate mutant PIK3CA’s ability to activate the MAP Kinase pathway, but our RBD mutational studies did not support this. However, this “rewiring” of pathways clearly has important implications in terms of biology and therapeutic drug targeting. We speculate that this could be mediated via differences in membrane localization of Pdk1 leading to phosphorylation and activation of other downstream and perhaps upstream components of the PI3 Kinase and MAP Kinase pathways. Further studies are also ongoing to address this question.
Although our results creating DKI cells is consistent with those of Di Nicolantonio et al, in regards to mutant KRAS and mutant PIK3CA imparting resistance to mTOR inhibitors (8), their model using double knock in of mutant KRAS G13D and mutant PIK3CA H1047R in hTERT immortalized human mammary epithelial cells shows lack of tumorigenicity in contrast to our results with all DKI clones. Although this could be due to differences in cellular background, this same group has also recently reported that the KRAS G13D mutation may be distinct from other KRAS mutations in terms of biologic phenotype; notably these mutations do not seem to predict for resistance to anti-EGFR antibody therapies (40). Thus, the difference in tumorigenicity may extend beyond the genetic background of the cell line used, but may also include and be consistent with the notion that specific KRAS mutations may have subtle or pronounced phenotypic differences in terms of oncogenic effects that are observed.
Perhaps the most striking result from our study is the finding that mutant KRAS as a single copy can cooperate with mutant PIK3CA resulting in a transformed phenotype whereas without this cooperative oncogene, mutant KRAS as a single copy has little effect. Although the percentage of double mutant KRAS/PIK3CA cancers is relatively small, the high incidence of colon and other cancers makes this percentage a sizeable and significant absolute number. In addition, updated sequencing results from the COSMIC database has identified breast cancer samples with mutations in both KRAS and PIK3CA, demonstrating that such events, though rare, do occur in breast cancer patients. Our results suggest that the critical interaction between mutant Kras and mutant p110α via the RBD and signaling via Pdk1 could potentially be a therapeutic target in cancers that harbor these two mutations. In addition, the results presented here also raise potential concerns regarding mutational status of KRAS and PIK3CA and the use of dual mTORC1/Mek inhibition as DKI cells were relatively resistant compared to the use of Mek inhibition alone. Interestingly, work from the Rosen lab suggests that cells with mutant KRAS and mutant PIK3CA are best treated with dual pathway targeting of Mek and Akt (9), suggesting better therapeutic effects depending on which molecule in the pathway is inhibited. Further elucidation of mutant KRAS/mutant PIK3CA cooperativity may reveal new insights for targeting specific molecular effectors that would offer the highest likelihood of benefit.
Supplementary Material
Figure 7. Microsatellite (MIN) colorectal cancers with mutant KRAS and mutant PIK3CA have single copies of mutant alleles.

Colorectal cancer patient samples with known MIN status and mutant KRAS and mutant PIK3CA status were sequenced to compare relative ratios of mutant to wild type alleles. KRAS (red) and PIK3CA (green) specific probes were then used for FISH. Results are representative of 4 MIN tumors and 4 non-MIN tumors (other samples shown in Figure S8).
Acknowledgments
Grant Support
This work was supported by: DOD Breast Cancer Research Program BC087658 (M.J.H.), W81XWH-06 1-0325 (J.P.Gustin), BC083057 (M.M.); Flight Attendant Medical Research Institute (FAMRI) (J.L., H.K.); the Ministry of Education, Culture, Sports, Science and Technology, Japan (H.K., S.K., Y.H.); the V Foundation (J.L.); the Maryland Cigarette Restitution Fund (J.L.); The Avon Foundation (J.L., B.H.P.); NIH CA088843 (J.L., B.H.P.), CA109274 (J.P.Garay, B.H.P.), GM007309 (G.M.W.) CA009071 (D.J.); and Susan G. Komen for the Cure PDF0707944 (D.J.) KG090199 (J.L.), BCTR0707684 (B.H.P.).
Non-standard abbreviations
- DKI
Double knock in
Footnotes
Authors’ Contributions
Conception and design: GM Wang, HY Wong, JP Gustin, JP Garay, M Mohseni, J Lauring, BH Park
Development of methodology: GM Wang, HY Wong, H Konishi, BG Blair, Z Rasheed, W Matsui, J Cidado, S Croessmann, R Cochran, S Karnan, Y Konishi, A Ota, Y Hosokawa, BH Park
Acquisition of data: GM Wang, HY Wong, H Konishi, JP Gustin, B Blair, A Abukhdeir, DM Rosen, S Denmeade, Z Rasheed, W Matsui, MJ Higgins, D Jelovac, S Karnan, Y Konishi, A Ota, Y Hosokawa, P Argani
Analysis and interpretation of data: GM Wang, HY Wong, H Konishi, BG Blair, P Argani, J Lauring, BH Park
Writing, review, and/or revision of the manuscript: GM Wang, HY Wong, J Lauring, BH Park
Study supervision: BH Park
We apologize to our colleagues whose important work could not be cited due to space constraints. We thank Bert Vogelstein, Kathy Romans and Christine Ann Iacobuzio-Donahue for supplying critical patient samples.
Supplementary data for this article are available.
Disclosure of Potential Conflicts of Interest
B.H.P. has received research funding from GlaxoSmithKline in the past, though none of the studies presented here were supported by GlaxoSmithKline. B.H.P. is also a paid consultant for GlaxoSmithKline and Horizon Discovery, LTD and sits on the scientific advisory board of Horizon Discovery, LTD. Under separate licensing agreements between Horizon Discovery, LTD and The Johns Hopkins University, B.H.P. is entitled to a share of royalties received by the University on sales of products. The terms of this arrangement are being managed by the Johns Hopkins University in accordance with its conflict of interest policies. All other authors declare no potential conflicts.
References
- 1.Riely GJ, Marks J, Pao W. KRAS mutations in non-small cell lung cancer. Proc Am Thorac Soc. 2009;6:201–5. doi: 10.1513/pats.200809-107LC. [DOI] [PubMed] [Google Scholar]
- 2.Elenbaas B, Spirio L, Koerner F, et al. Human breast cancer cells generated by oncogenic transformation of primary mammary epithelial cells. Genes Dev. 2001;15:50–65. doi: 10.1101/gad.828901. [DOI] [PMC free article] [PubMed] [Google Scholar]
- 3.Serrano M, Lin AW, McCurrach ME, Beach D, Lowe SW. Oncogenic ras provokes premature cell senescence associated with accumulation of p53 and p16INK4a. Cell. 1997;88:593–602. doi: 10.1016/s0092-8674(00)81902-9. [DOI] [PubMed] [Google Scholar]
- 4.Young NP, Jacks T. Tissue-specific p19Arf regulation dictates the response to oncogenic K-ras. Proc Natl Acad Sci U S A. 2010;107:10184–9. doi: 10.1073/pnas.1004796107. [DOI] [PMC free article] [PubMed] [Google Scholar]
- 5.Ramjaun AR, Downward J. Ras and phosphoinositide 3-kinase: partners in development and tumorigenesis. Cell Cycle. 2007;6:2902–5. doi: 10.4161/cc.6.23.4996. [DOI] [PubMed] [Google Scholar]
- 6.Gustin JP, Karakas B, Weiss MB, et al. Knockin of mutant PIK3CA activates multiple oncogenic pathways. Proc Natl Acad Sci U S A. 2009;106:2835–40. doi: 10.1073/pnas.0813351106. [DOI] [PMC free article] [PubMed] [Google Scholar]
- 7.Isakoff SJ, Engelman JA, Irie HY, et al. Breast cancer-associated PIK3CA mutations are oncogenic in mammary epithelial cells. Cancer Res. 2005;65:10992–1000. doi: 10.1158/0008-5472.CAN-05-2612. [DOI] [PubMed] [Google Scholar]
- 8.Di Nicolantonio F, Arena S, Tabernero J, et al. Deregulation of the PI3K and KRAS signaling pathways in human cancer cells determines their response to everolimus. J Clin Invest. 2010;120:2858–66. doi: 10.1172/JCI37539. [DOI] [PMC free article] [PubMed] [Google Scholar]
- 9.Halilovic E, She QB, Ye Q, et al. PIK3CA mutation uncouples tumor growth and cyclin D1 regulation from MEK/ERK and mutant KRAS signaling. Cancer Res. 2010;70:6804–14. doi: 10.1158/0008-5472.CAN-10-0409. [DOI] [PMC free article] [PubMed] [Google Scholar]
- 10.Kennedy AL, Morton JP, Manoharan I, et al. Activation of the PIK3CA/AKT pathway suppresses senescence induced by an activated RAS oncogene to promote tumorigenesis. Mol Cell. 2011;42:36–49. doi: 10.1016/j.molcel.2011.02.020. [DOI] [PMC free article] [PubMed] [Google Scholar]
- 11.Konishi H, Karakas B, Abukhdeir AM, et al. Knock-in of mutant K-ras in nontumorigenic human epithelial cells as a new model for studying K-ras mediated transformation. Cancer Res. 2007;67:8460–7. doi: 10.1158/0008-5472.CAN-07-0108. [DOI] [PubMed] [Google Scholar]
- 12.Arena S, Isella C, Martini M, de Marco A, Medico E, Bardelli A. Knock-in of oncogenic Kras does not transform mouse somatic cells but triggers a transcriptional response that classifies human cancers. Cancer Res. 2007;67:8468–76. doi: 10.1158/0008-5472.CAN-07-1126. [DOI] [PubMed] [Google Scholar]
- 13.Soh J, Okumura N, Lockwood WW, et al. Oncogene mutations, copy number gains and mutant allele specific imbalance (MASI) frequently occur together in tumor cells. PLoS One. 2009;4:e7464. doi: 10.1371/journal.pone.0007464. [DOI] [PMC free article] [PubMed] [Google Scholar]
- 14.Johnson L, Mercer K, Greenbaum D, et al. Somatic activation of the K-ras oncogene causes early onset lung cancer in mice. Nature. 2001;410:1111–6. doi: 10.1038/35074129. [DOI] [PubMed] [Google Scholar]
- 15.Plattner R, Anderson MJ, Sato KY, Fasching CL, Der CJ, Stanbridge EJ. Loss of oncogenic ras expression does not correlate with loss of tumorigenicity in human cells. Proc Natl Acad Sci U S A. 1996;93:6665–70. doi: 10.1073/pnas.93.13.6665. [DOI] [PMC free article] [PubMed] [Google Scholar]
- 16.Shirasawa S, Furuse M, Yokoyama N, Sasazuki T. Altered growth of human colon cancer cell lines disrupted at activated Ki-ras. Science. 1993;260:85–8. doi: 10.1126/science.8465203. [DOI] [PubMed] [Google Scholar]
- 17.Samuels Y, Diaz LA, Jr, Schmidt-Kittler O, et al. Mutant PIK3CA promotes cell growth and invasion of human cancer cells. Cancer Cell. 2005;7:561–73. doi: 10.1016/j.ccr.2005.05.014. [DOI] [PubMed] [Google Scholar]
- 18.Gupta S, Ramjaun AR, Haiko P, et al. Binding of ras to phosphoinositide 3-kinase p110alpha is required for ras-driven tumorigenesis in mice. Cell. 2007;129:957–68. doi: 10.1016/j.cell.2007.03.051. [DOI] [PubMed] [Google Scholar]
- 19.Isakoff SJ, Engelman JA, Irie HY, et al. Breast cancer-associated PIK3CA mutations are oncogenic in mammary epithelial cells. Cancer Res. 2005;65:10992–1000. doi: 10.1158/0008-5472.CAN-05-2612. [DOI] [PubMed] [Google Scholar]
- 20.Soule HD, Maloney TM, Wolman SR, et al. Isolation and characterization of a spontaneously immortalized human breast epithelial cell line, MCF-10. Cancer Res. 1990;50:6075–86. [PubMed] [Google Scholar]
- 21.Debnath J, Muthuswamy SK, Brugge JS. Morphogenesis and oncogenesis of MCF-10A mammary epithelial acini grown in three-dimensional basement membrane cultures. Methods. 2003;30:256–68. doi: 10.1016/s1046-2023(03)00032-x. [DOI] [PubMed] [Google Scholar]
- 22.Ho SN, Hunt HD, Horton RM, Pullen JK, Pease LR. Site-directed mutagenesis by overlap extension using the polymerase chain reaction. Gene. 1989;77:51–9. doi: 10.1016/0378-1119(89)90358-2. [DOI] [PubMed] [Google Scholar]
- 23.Bachman KE, Blair BG, Brenner K, et al. p21(WAF1/CIP1) Mediates the Growth Response to TGF-beta in Human Epithelial Cells. Cancer Biol Ther. 2004;3:221–5. doi: 10.4161/cbt.3.2.666. [DOI] [PubMed] [Google Scholar]
- 24.Weiss MB, Vitolo MI, Mohseni M, et al. Deletion of p53 in human mammary epithelial cells causes chromosomal instability and altered therapeutic response. Oncogene. 2010;29:4715–24. doi: 10.1038/onc.2010.220. [DOI] [PMC free article] [PubMed] [Google Scholar]
- 25.Kadota M, Yang HH, Gomez B, et al. Delineating genetic alterations for tumor progression in the MCF10A series of breast cancer cell lines. PLoS One. 2010;5:e9201. doi: 10.1371/journal.pone.0009201. [DOI] [PMC free article] [PubMed] [Google Scholar]
- 26.Konishi H, Lauring J, Garay JP, et al. A PCR-based high-throughput screen with multiround sample pooling: application to somatic cell gene targeting. Nat Protoc. 2007;2:2865–74. doi: 10.1038/nprot.2007.409. [DOI] [PubMed] [Google Scholar]
- 27.Lauring J, Cosgrove DP, Fontana S, et al. Knock in of the AKT1 E17K mutation in human breast epithelial cells does not recapitulate oncogenic PIK3CA mutations. Oncogene. 2010 doi: 10.1038/onc.2009.516. [DOI] [PMC free article] [PubMed] [Google Scholar]
- 28.Petersen OW, Ronnov-Jessen L, Howlett AR, Bissell MJ. Interaction with basement membrane serves to rapidly distinguish growth and differentiation pattern of normal and malignant human breast epithelial cells. Proc Natl Acad Sci U S A. 1992;89:9064–8. doi: 10.1073/pnas.89.19.9064. [DOI] [PMC free article] [PubMed] [Google Scholar]
- 29.Troxell ML, Levine J, Beadling C, et al. High prevalence of PIK3CA/AKT pathway mutations in papillary neoplasms of the breast. Mod Pathol. 2010;23:27–37. doi: 10.1038/modpathol.2009.142. [DOI] [PubMed] [Google Scholar]
- 30.O’Reilly KE, Rojo F, She QB, et al. mTOR inhibition induces upstream receptor tyrosine kinase signaling and activates Akt. Cancer Res. 2006;66:1500–8. doi: 10.1158/0008-5472.CAN-05-2925. [DOI] [PMC free article] [PubMed] [Google Scholar]
- 31.Sun SY, Rosenberg LM, Wang X, et al. Activation of Akt and eIF4E survival pathways by rapamycin-mediated mammalian target of rapamycin inhibition. Cancer Res. 2005;65:7052–8. doi: 10.1158/0008-5472.CAN-05-0917. [DOI] [PubMed] [Google Scholar]
- 32.Yun J, Rago C, Cheong I, et al. Glucose deprivation contributes to the development of KRAS pathway mutations in tumor cells. Science. 2009;325:1555–9. doi: 10.1126/science.1174229. [DOI] [PMC free article] [PubMed] [Google Scholar]
- 33.Zhao L, Vogt PK. Class I PI3K in oncogenic cellular transformation. Oncogene. 2008;27:5486–96. doi: 10.1038/onc.2008.244. [DOI] [PMC free article] [PubMed] [Google Scholar]
- 34.Zhao L, Vogt PK. Helical domain and kinase domain mutations in p110alpha of phosphatidylinositol 3-kinase induce gain of function by different mechanisms. Proc Natl Acad Sci U S A. 2008;105:2652–7. doi: 10.1073/pnas.0712169105. [DOI] [PMC free article] [PubMed] [Google Scholar]
- 35.Caron RW, Yacoub A, Li M, et al. Activated forms of H-RAS and K-RAS differentially regulate membrane association of PI3K, PDK-1, and AKT and the effect of therapeutic kinase inhibitors on cell survival. Mol Cancer Ther. 2005;4:257–70. [PubMed] [Google Scholar]
- 36.Pearce LR, Komander D, Alessi DR. The nuts and bolts of AGC protein kinases. Nat Rev Mol Cell Biol. 2010;11:9–22. doi: 10.1038/nrm2822. [DOI] [PubMed] [Google Scholar]
- 37.Najafov A, Sommer EM, Axten JM, Deyoung MP, Alessi DR. Characterization of GSK2334470, a novel and highly specific inhibitor of PDK1. Biochem J. 2011;433:357–69. doi: 10.1042/BJ20101732. [DOI] [PubMed] [Google Scholar]
- 38.Tuveson DA, Jacks T. Technologically advanced cancer modeling in mice. Curr Opin Genet Dev. 2002;12:105–10. doi: 10.1016/s0959-437x(01)00272-6. [DOI] [PubMed] [Google Scholar]
- 39.Eser S, Reiff N, Messer M, et al. Selective Requirement of PI3K/PDK1 Signaling for Kras Oncogene-Driven Pancreatic Cell Plasticity and Cancer. Cancer Cell. 2013 doi: 10.1016/j.ccr.2013.01.023. [DOI] [PubMed] [Google Scholar]
- 40.De Roock W, Jonker DJ, Di Nicolantonio F, et al. Association of KRAS p. G13D mutation with outcome in patients with chemotherapy-refractory metastatic colorectal cancer treated with cetuximab. Jama. 2010;304:1812–20. doi: 10.1001/jama.2010.1535. [DOI] [PubMed] [Google Scholar]
Associated Data
This section collects any data citations, data availability statements, or supplementary materials included in this article.