

Abstract
Respondent-driven sampling (RDS) is often viewed as a superior method for recruiting hard-to-reach populations disproportionately burdened with poor health outcomes. As an analytic approach, it has been praised for its ability to generate unbiased population estimates via post-stratified weights which account for non-random recruitment. However, population estimates generated with RDSAT (RDS Analysis Tool) are sensitive to variations in degree weights. Several assumptions are implicit in the degree weight and are not routinely assessed. Failure to meet these assumptions could result in inaccurate degree measures and consequently result in biased population estimates. We highlight potential biases associated with violating the assumptions implicit in degree weights for the RDSAT estimator and propose strategies to measure and possibly correct for biases in the analysis.
Keywords: respondent-driven sampling, hidden populations, sampling weights, bias
INTRODUCTION
Generating accurate HIV prevalence and incidence estimates and approximations of HIV-associated risk behaviors is necessary to prioritize funding for HIV prevention and treatment, design targeted interventions for populations at highest risk, and monitor changes in the epidemic over time and across populations. However, this work is particularly challenging due to the absence of a sampling frame for marginalized and/or highly stigmatized populations (e.g., injection drug users, men who have sex with men, sex workers), who typically carry the greatest disease burden. Respondent-driven sampling (RDS) was introduced by Heckathorn in 1997 as an approach to sampling design and inference for “hidden” or “hard-to-reach” populations (1). RDS is a modified form of chain referral sampling which uses dual incentives (incentives for both study participation and peer recruitment) and probability weights to offset non-random recruitment. A small group of “seeds” are selected by the research staff to initiate peer recruitment. Each seed receives a limited number of recruitment coupons to recruit his/her peers. Eligible recruits are enrolled in the study and given the same number of coupons to recruit their peers. This process of recruits becoming recruiters continues through successive waves until the desired sample size is reached.
Respondent-Driven Sampling (RDS) has become an important recruitment approach for reaching highly marginalized populations who are disproportionately burdened with poor health outcomes. As an analytic tool, RDS employs sample weights to offset non-random recruitment and generate population estimates. Recruitment weights account for differences in recruitment and homophily by characteristics determined a priori to be strongly associated with the formation of social ties; degree weights account for variations in network size.
RDS Assumptions
The RDS post-stratified weighting process is thought to reduce selection bias; however, the validity of the RDS estimator depends on several assumptions. These include: 1) respondents know one another as members of the target population and recruitment ties are reciprocal, 2) there is sufficient cross-over between subgroups and networks are dense enough to sustain a chain referral process, 3) sampling occurs with replacement, 4) respondents are recruited from one’s network at random, 5) respondents can accurately report their personal network size, defined as the number of relatives, friends, and acquaintances who can be considered members of the target population, 6) each respondent recruits a single peer, and 7) a markov chain model of recruitment is appropriate, resulting in a sample independent of seeds at equilibrium (2).
Purpose of this report
This paper focuses on degree weights, which correct RDS sample estimates for over-/under-recruitment of individuals related to network size. Several assumptions are implicit in the degree weight (and in weighting sample estimates by self-reported degree) but are not routinely assessed. Failure to meet these assumptions could result in inaccurate degree measures. Because weighted population estimates are sensitive to variations in degree weights, inaccuracies in the degree measurement could result in biased population estimates. Understanding how and where biases may be introduced will 1) enable researchers to collect the relevant quantitative and qualitative information before and/or during the study so that biases can be measured and corrected for in the analysis and 2) provide researchers with additional confidence when interpreting study findings, particularly when RDS-adjusted and RDS-unadjusted estimates are substantially different.
This paper will discuss the RDS assumptions and prior work 1) evaluating whether these assumptions are routinely met in practice and 2) assessing the sensitivity of several different RDS estimators to these assumptions. We then provide a detailed discussion of the assumptions that are implicit in degree weights for the RDS estimator which is part of the freely available and widely used RDSAT software package, highlight the potential biases corresponding with violating each assumption, and propose ways to measure and/or account for these biases.
Current literature evaluating RDS assumptions
Each of the main RDS assumptions (listed above) were previously examined in a drug using sample and other studies have evaluated recruitment biases (3–6) and the uniform recruitment assumption (3, 4, 7–12) in a variety of target populations. Simulation studies have also assessed the sensitivity of RDS estimates to specific assumptions (13–18). For example, one simulation-based comparison of five existing RDS estimators (e.g., Naïve Estimator (1), Salganik-Heckathorn Estimator (19), Heckathorn Estimator (20), Volz-Heckatorn Estimator(21), and Successive Sampling Estimator (18)) compared their performance under conditions of differential recruitment, imperfect recruitment effectiveness, and non-response (17). Findings from this paper suggest that no estimator consistently outperformed the others (17).
Additionally, Gile and Handcock generated a realistic hard-to-reach population using a stochastic simulation process to assess the sensitivity of the Volz-Heckathorn estimator to seed selection bias, uncontrollable features of respondent behavior, and the without-replacement sampling assumption (13). They reported: the number of waves typically used in RDS studies may not be sufficient to remove seed bias and bias may be introduced through differential recruitment behavior and large sampling fractions (13). Another simulation which examined the sensitivity of the Volz-Heckathorn estimator to the with-replacement sampling assumption found that it produced biased estimates in cases of non-unity activity ratio, and more so for larger sample fractions (18). Gile (2011) explained that bias is introduced because diseased individuals typically have higher degrees and the true without-replacement sampling probabilities are closer to uniform than would be suggested by the proportional-to-degree estimates. Consequently, individuals with higher degrees are excessively down-weighted resulting in an underestimated disease prevalence (18).
While simulation studies have recently documented potential sources of bias and sensitivities of the estimators to different RDS assumptions, their findings have not been replicated using empirical data and it is unknown how well simulated samples approximate actual samples. While alternative RDS estimators have been proposed (13, 18), they are not widely available and most published findings using non-simulated RDS data use RDSAT (22), a freely available software program to generate post-stratified weights and population proportions. While violating many of the assumptions listed above increases the variance of RDS population estimates (23), violating those related to the weights are more likely to introduce bias. Below, we examine the RDS assumptions that are implicit when sample estimates are weighted by self-reported out-degree and we suggest methods to evaluate whether bias is likely to be present in empirical samples. If the level of bias can be approximated, the estimates can be adjusted accordingly.
Sensitivity of RDSAT population estimates to weights
Evidence from the RDS literature suggests that population estimates are sensitive to variations in weights. Frost and colleagues reported a wide range in the prevalence estimates for syphilis in Tijuana (12.4%–26.8%) and Ciudad Juárez (2.9%–15.6%) when homophily and degree sizes were varied (24). Additionally, empirical studies have reported discrepancies between crude and RDS-adjusted estimates (25–32). Yeka and colleagues compared RDS-adjusted and unadjusted estimates for socio-demographics in samples of men who have sex with men (MSM) and female sex workers (FSWs); discrepancies were as high as 24.4% among FSWs and 10.8% among MSM (26). Another study among FSWs reported an HIV prevalence that was twice as high prior to RDS adjustment (8% before and 4% after adjustment) (28).
Because discrepancies between crude and adjusted RDS estimates are due to a weighting factor which was designed to correct for sampling biases, these discrepancies are sometimes used to justify using the RDS-adjusted estimates. However, RDS weights also have the potential to introduce bias (6) if there are inaccuracies in how they are measured or if the assumptions upon which the weights are based are not valid. To be more confident in our estimates and the recommendations that follow, it is important to understand whether RDS-adjusted measures are biased and, if they are, how we can account for this bias either in the study design or through the analysis.
Implicit assumptions made with degree weights
In weighting recruits by the inverse of their self-reported out-degree (number of people he/she knows and/or would be able to recruit), several assumptions are implicit: 1) self-reported out-degree is equal to or proportional to in-degree (number of individuals who know and/or would recruit him/her) (Figure 1; derived from RDS assumption 1 above (21)), 2) recruitment probabilities are inversely proportional to degree (Figure 2; the RDSAT estimator accounts for non-random sampling resulting from variations in network size (21)), 3) recruits are drawn randomly from those comprising the degree (Figure 3; derived from RDS assumption 4 above (21)), and 4) degree is accurately recalled (derived from RDS assumption 5 above (21)).
Figure 1.
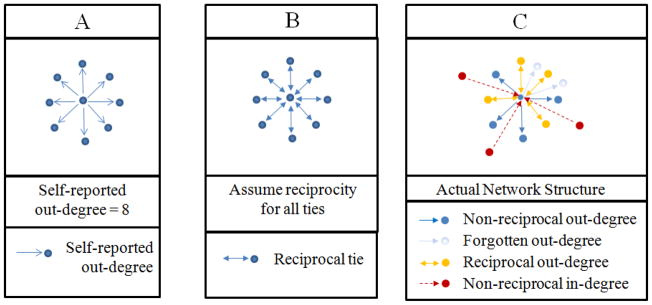
In-degree equals or is proportional to out-degree
Figure 2.
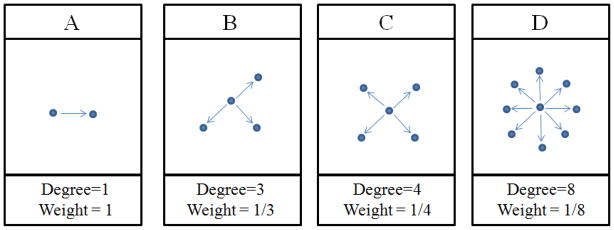
Assumption that the probability of recruitment is inversely proportional to degree
Figure 3.

Assumption that recruits are drawn randomly from those comprising the degree
Assumption one: In-degree equals or is proportional to out-degree (Figure 1)
As the degree estimate is meant to describe one’s probability of being recruited to the study, it should represent the total number of study-eligible network members from the target population who could recruit him/her (all in-degree network members from the target population). Because this number cannot be easily quantified, out-degree is used as a proxy for in-degree and we assume that the number of people he/she could recruit (out-degree) equals the number of people who could have recruited him/her (in-degree) (Figures 1A and 1B).
Problems with assumption one
The social network literature suggests that this assumption is unlikely to be true due to the preponderance of asymmetric ties within networks (Figure 1C) (33, 34). In studies by Shulman et al., only 36% of those named by study participants as close friends and kin felt symmetrically close to those who had named them (35, 36). Other social network studies also reported low reciprocation rates (36.2% – 43.2%) (35, 37, 38). Evidence from the RDS literature similarly suggests a lack of reciprocity between RDS recruiters and recruits. For example, McCreesh and colleagues reported that only 30% of recruits had been named as a contact by their recruiter (and identified) at their recruiter’s first interview (6) and Liu and colleagues reported that 38 RDS participants recruited more eligible peers than they reported knowing in their personal network inventory (5).
Low reciprocation rates between RDS recruits and their recruiters suggest that out-degree may not be a good proxy for in-degree. However, because the RDS estimator equation includes measures of degree in both the numerator and denominator, it relies on relative, rather than absolute degree reports. Therefore, bias will not be introduced if reciprocation rates across study participants are constant (e.g., if out-degree is not a good proxy for in-degree but the relationship between in-degree and out-degree is proportional). It is also possible that reciprocation rates vary across sub-populations of participants and as Liu et al. and McCreesh et al. suggest, some of these relationships may not be clear unless qualitative data are available to examine recruitment biases (5, 6).
Recommendations
To be confident that out-degree is a good proxy for in-degree, we must first evaluate the relationship between in-degree and out-degree in a respondent-driven sample. Asking both recruiters and recruits a series of additional questions could help us assess this relationship. Currently, respondents are asked to report the number of individuals in the target population who he/she knows (out-degree). Afterwards, interviewers could ask: 1) of the__individuals you reported knowing, how many would you be willing/able to recruit to participate in this study?, 2) is there anyone else in the target population that you would be willing/able to recruit to participate in this study that you did not think of previously when you told me that the number of individuals in the target population you knew was__?, 3) of the__individuals you reported knowing, how many do you think would invite you to participate in this study?, 4) is there anyone else in the target population that would invite you to participate in the study that you did not think of previously when you told me that the number of individuals in the target population that you knew was__?, and 5) of the__individuals you reported that you would be willing/able to recruit to participate in this study, how many do you think would have also invited you to participate in this study? Alternatively, a sociometric evaluation of symmetric and asymmetric ties among the target population as part of the formative phase would provide additional information about the probability of reciprocal relationships in the sample and possibly identify specific types of ties that are more likely to be reciprocal. Additionally, because reciprocation rates may vary across sub-populations of participants, we recommend that extensive qualitative work proceed and/or accompany RDS data collection to better identify potential recruitment biases so that they can be either acknowledged as potential limitations or corrected for in the analysis.
Assumption two: Recruitment probability is inversely proportional to degree (Figure 2)
By weighting individuals by the inverse of their degree, we presume that network size is the best predictor of recruitment and that there is a proportional relationship between network size and recruitment. For example, someone reporting three networks (Figure 2B) should be three times as likely to be recruited as someone reporting only one network (Figure 2A) and someone reporting four networks (Figure 2C) will be half as likely to be recruited as someone reporting eight networks (Figure 2D).
Problems with assumption two
If this assumption were true, we would expect that some would be better recruiters than others and that those reporting larger out-degrees would likely recruit more individuals to participate in the study. However, another study reported that those with more drug using network members (out-degree) did not recruit more drug using peers (39). This is likely because a process other than network size is driving peer recruitment. For example, individuals may selectively recruit some individuals over others and this selection process is likely not captured in the degree weight. Further, if this selection process is systematic, one’s probability of inclusion will not be proportional to his/her degree.
Individuals may, for example, be more likely to recruit “close” ties, those they trust, those with whom they discuss important matters, those they suspect will be most likely to participate in the study, those who would be most likely to benefit from study participation, those they interact with most frequently, or the first person encountered. In each case, the number of individuals approached for recruitment (and the number of individuals approached who are both willing and eligible to participate) may not be proportional to the number of individuals in the target population that comprise his/her out-degree.
Recommendations
Future research is needed to better quantify one’s probability of inclusion. Others employing RDS may consider comparing population-based estimates derived when other recruitment assumptions are made (e.g., peer recruitment is proportional to relationship closeness, geographic distance between ties, interaction frequency, duration of relationship). The Successive Sampling Estimator (18) for example, approximates the sampling process as a successive sampling process without replacement (rather than one that is proportional degree). However, this estimator also requires knowledge of the population size, which is typically unknown for hidden populations.
Before creating a better measure for degree that more closely predicts one’s probability of inclusion, more formative work is needed to better understand the processes driving peer recruitment (e.g., recruitment preferences and biases). For example, a sociometric evaluation of peer recruitment in combination with in-depth interviews may help us to better understand actual recruitment behavior and to develop better ways to account for the non-random recruitment within networks. Recruiters could be asked to describe the individuals whom he/she invited to participate in the study, explain why these individuals were approached (e.g., geographic proximity, frequency of interaction, type of relationship, duration of relationship, trust in relationship, dependence in relationship) and how the individuals approached differed from those comprising their degree measure that were not approached, and finally to characterize those accepting their invitation to participate in the study. Those recruited to the study could be asked questions about their recruiter and how his/her relationship with that individual influenced his/her willingness to participate. Others similarly suggest a need to expand data collection to learn more about RDS-respondent behavior (16) and recruitment/selection biases (5, 6). For example qualitative data collected following RDS recruitment in a study conducted by McCreesh and colleagues provided plausible explanations for recruitment biases identified in the quantitative assessment (6). Based on the responses to these additional questions and/or information provided by key informant interviews, a new degree question could be designed that more accurately reflects one’s probability of inclusion in a respondent-driven sample.
Assumption three: Recruits are drawn randomly from those comprising the degree (Figure 3)
While degree represents the number of people who could recruit him/her to participate in the study, we generally assume that this number is equivalent or proportional to the number of people he/she could recruit. Similarly, we assume that of those comprising one’s out-degree, each individual is as likely to be recruited as any other person in this subset. Many extend this assumption with the following logic: 1) if out-degree is a proxy for in-degree and 2) one’s probability of inclusion is proportional to his/her in-degree, then 3) those invited to participate in the study should be a random sample of those who could have been selected (e.g., people recruit exclusively from those comprising their out-degree and each individual is equally likely to be recruited) (Figure 3A).
With RDS, we are more concerned with the association between one’s in-degree and his/her inclusion probability. However, we can examine recruitment behavior as it relates to one’s out-degree (e.g., whether individuals recruit others randomly or selectively) which can provide insight into how well in-degree might correlate with one’s inclusion probability. If individuals do not recruit peers randomly from those comprising their out-degree, it is unlikely that an individual’s inclusion probability will be proportional to his/her in-degree.
Problems with assumption three
Study recruitment reflects several non-random processes: selecting peers to recruit and/or distribute coupons to, accepting recruitment coupons/deciding to participate, and eligibility screening. When individuals are asked to report their degree size, they are unlikely to report the number of individuals who they are certain would agree to participate and/or be eligible. For example, a person may report eight network members, but realistically only three of them would agree/be eligible to participate (Figure 3A). In this scenario, the recruit would be underrepresented in the weighted estimate (weight=1/8 instead of 1/3). Individuals may also only accept coupons when approached by certain individuals (e.g., close friends or those they trust). If peer-selection of recruits, coupon acceptance, or study eligibility are correlated with degree, disease status or characteristics associated with peer recruitment, the RDS estimator could be biased.
In another example (Figure 3B), a participant may report a degree of two, but know three others who would be eligible for the study and who he/she could theoretically recruit/be recruited by. In this case, the recruit would incorrectly be assigned a degree size of two (weight=1/2) instead of five (weight=1/5), which would inflate his/her contribution to the population estimate (weight=1/2 vs. 1/5). It is also not uncommon for RDS participants to report a degree size of zero, even though they were recruited into the study by a peer and may have also recruited ≥1 peer to participate in the study. Similarly, RDS participants in Liu et al.’s study recruited more individuals than were listed in their personal network inventory (5). This phenomenon may be due to inaccuracies in self-reported degree, but may also reflect that people preferentially recruit those who they believe are most likely to agree to participate in the study or are most likely to benefit from study participation and who may not necessarily be part of their network (Figure 3C).
Several studies have compared the characteristics of RDS peer recruits with self-reported network characteristics using t-tests and chi-squared statistics. In most cases, peer recruit characteristics did not reflect the ego-centric network characteristics reported by participants already enrolled (4, 5, 11, 40, 41). This suggests that peers may not be recruited randomly from those comprising degree estimates. Similarly, empirical studies have demonstrated the existence of non-random recruitment in respondent-driven samples (5, 6). McCreesh and colleagues reported that because recruitment was associated with characteristics other than network size, RDS inference methods generally failed to reduce bias when it occurred (6). Because this empirical data was conducted among a known and visible target population, the authors suspect that the bias may be more pronounced in studies among hidden and stigmatized populations.(6)
Furthermore, much of the RDS literature reports that close friends are more likely to be recruited than spouses, sex partners, or relatives, which suggests the selection process is not random. For example, peer-recruits were described as a friend or acquaintance 80%–93.8% of the time (4, 41, 42) and as a relative or sex partner 3.4%–6% of the time (4, 41, 42). Frost and colleagues also reported that peer recruits were overwhelmingly described as friends (24). Similarly, among individuals asked to describe their peer recruiter, 90% reported a friend/acquaintance, compared with 7% reporting a relative/sex partner (11). Further, the fact that a recruiter or a peer recruit is described as a friend/acquaintance does not imply that the relationship between recruiter and peer recruit is reciprocal. As the social network literature highlights, it is common for one individual to acknowledge a friendship while the other does not and the strength of the relationship is likely to vary from each individual’s perspective.
Recommendations
Similar to the recommendation provided in response to assumption one, researchers could collect additional information about the recruitment process to better characterize 1) peer recruitment (e.g., who do individuals selectively recruit?) and 2) coupon acceptance (e.g., what makes individuals more likely to accept peer invitations). This information could be used to design a better measure for degree that is more closely associated with one’s probability of inclusion. Researchers might also consider collecting additional ego-centric data from participants so that recruitment biases can be more extensively examined, and possibly corrected for in the analysis (e.g. demographic characteristics, relationship type, frequency of interaction, etc.). With additional ego-centric data, researchers could determine how peer recruitment differs from random recruitment (e.g., compare peer recruit characteristics with ego-network characteristics) (4, 5, 11, 40, 41) and use this to correct for recruitment biases, modify assumptions, or change the weighting factor.
For those who have identified recruitment biases by comparing egocentric network characteristics to those of RDS peer recruits, we recommend using the predictions from the logistic regression models as recruitment probability weights, as this approach improved RDS estimates in the McCreesh paper (6). While McCreesh and colleagues utilized known population data from non-hidden/non-stigmatized populations, this approach should be explored in hidden/stigmatized populations.
Assumption four: Degree is accurately recalled
We also assume that self-reported degree size is accurate and that over-/under-reporting occur at random and are not dependent on degree size, tie strength, outcome status, or any other variable that influences peer recruitment. However, because weights rely on proportions rather than absolute values, as long as respondents uniformly inflate/deflate degree, the estimator is unaffected (20).
Problems with assumption four
Brewer’s review article on the accuracy of self-reported networks suggests that this is likely not the case; forgetting networks is common and it is difficult to predict the proportion of networks forgotten (43). Additionally, several other studies in the social network literature suggest that both recall and reciprocity are higher for close/strong ties (43, 44), that discrepancies between self-reported network data and observed network data are more likely to be systematic than random (44), and that the rate of forgetting increases as network size increases (45).
Findings from simulations with RDS data suggest that RDS estimates may be biased when networks are not reciprocal and when recruitment is based on characteristics correlated with study outcomes (14). This is potentially problematic for RDS studies that estimate HIV prevalence, because recruitment homophily by HIV status is often high (3, 41, 46) and significant differences in RDS recruitment by HIV status have been reported (42, 47, 48). These discrepancies introduce bias only if systematic. For example, if those with disease are more/less likely to over-estimate their network size, diseased peer recruits are more likely to be willing/eligible to participate, or participants without disease are more likely to recruit outside of their network, population estimates will likely be biased. If individuals with disease report larger networks than those without disease and network size is not correlated with one’s probability of entering the study, those with disease will be excessively down-weighted thereby underestimating the prevalence of disease. On the contrary, if individuals with disease tend to have smaller networks and network size does not correlate well with recruitment probabilities, individuals with disease will be over-weighted, thereby over-estimating the disease prevalence in the population.
Recommendations
As an alternative to the current recruitment strategy, researchers could ask RDS participants for a list of potential recruits and then randomly select individuals for him/her to recruit. Alternatively, identifying those who are most likely to recruit him/her and using this number as the degree measure might be advantageous.
CONCLUSION
As a recruitment tool, RDS may be useful and effective. However, as an analytic tool, we cannot assume that RDS-weighted population estimates are free from bias. A few RDS studies have demonstrated that the RDS assumptions are not routinely met in practice, several researchers have proposed alternative estimators which rely on different assumptions, simulation studies have highlighted the sensitivity of various RDS estimators to many of these assumptions, and one paper demonstrated that RDS-adjusted estimates were not able to reduce bias resulting from non-random recruitment. This work collectively suggests that RDS estimates that rely on degree weights may be biased however, few studies have offered suggestions on how researchers can quantify or account for these biases. While developing a weight that more accurately reflects one’s probability of recruitment and study participation would reduce such bias, more work is needed to determine an appropriate replacement for degree or a more realistic strategy for weighting individuals. Because RDSAT-adjusted estimates may not reduce the bias resulting when assumptions are not met, alternative procedures should be employed to measure and account for biased estimates. As equilibrium or the number of recruitment waves reached may not accurately predict whether the population-based estimates are likely to be unbiased, other approaches such as those suggested here and by McCreesh et al (6) should be implemented to better assess potential sources of bias. This paper highlights several ways in which bias may be introduced through the degree weight when RDSAT is used to calculate weighted population estimates and offers strategies for researchers to measure and account for these biases both in the field and during the analysis. Understanding how and where biases may be introduced in RDS will enable researchers to more confidently interpret research findings and can be accomplished by 1) collecting relevant information (both quantitative and qualitative) from participants prior to and/or during study enrollment that can be used to identify and quantify potential biases and 2) accounting and correcting for potential biases when possible.
Acknowledgments
This work was supported by the National Institute on Drug Abuse at the National Institutes of Health (grant number K01 DA033879-01A1). All authors made substantial contributions to the a) conception and design of the study, or acquisition of data or analysis and interpretation of data, b) drafting the article or revising it critically for important intellectual content and c) final approval of the version to be published.
References
- 1.Heckathorn D. Respondent-Driven Sampling: A new approach to the study of hidden populations. Social Problems. 1997;44(2):174–99. [Google Scholar]
- 2.Heckathorn D. Respondent-Driven Sampling II. Deriving valid population estimates from chain-referral samples of hidden populations. Social Problems. 2002;49(1):11–34. [Google Scholar]
- 3.Iguchi M, Ober A, Berry S, Fain R, Heckathorn D, Gorbach P, et al. Simultaneous Recruitment of Drug Users and Men Who Have Sex with Men in the United States and Russia Using Respondent-Driven Sampling: Sampling Methods and Implications. Journal of Urban Health. 2009;86(1):S5–S31. doi: 10.1007/s11524-009-9365-4. [DOI] [PMC free article] [PubMed] [Google Scholar]
- 4.Wang J, Carlson RG, Falck RS, Siegal HA, Rahman A, Li L. Respondent-driven sampling to recruit MDMA users: a methodological assessment. Drug Alcohol Depend. 2005 May 9;78(2):147–57. doi: 10.1016/j.drugalcdep.2004.10.011. [DOI] [PubMed] [Google Scholar]
- 5.Liu H, Li J, Ha T. Assessment of Random Recruitment Assumption in Respondent-Driven Sampling in Egocentric Network Data. Social Networking. 2012;1(2):13–21. doi: 10.4236/sn.2012.12002. [DOI] [PMC free article] [PubMed] [Google Scholar]
- 6.McCreesh N, Frost SDW, Seeley J, Katongole J, Tarsh MN, Ndunguse R, et al. Evaluation of respondent-driven sampling. Epidemiology. 2012;23(1):138. doi: 10.1097/EDE.0b013e31823ac17c. [DOI] [PMC free article] [PubMed] [Google Scholar]
- 7.de Mello M, de Araujo PA, Chinaglia M, Tun W, Júnior A, Ilário M, et al. Assessment of risk factors for HIV infection among men who have sex with men in the metropolitan area of Campinas City, Brazil, using respondent-driven sampling: Population Council. 2008. [Google Scholar]
- 8.Johnston LG, Khanam R, Reza M, Khan SI, Banu S, Alam MS, et al. The effectiveness of respondent driven sampling for recruiting males who have sex with males in Dhaka, Bangladesh. AIDS Behav. 2008 Mar;12(2):294–304. doi: 10.1007/s10461-007-9300-1. [DOI] [PubMed] [Google Scholar]
- 9.Johnston LG, Malekinejad M, Kendall C, Iuppa IM, Rutherford GW. Implementation challenges to using respondent-driven sampling methodology for HIV biological and behavioral surveillance: field experiences in international settings. AIDS Behav. 2008 Jul;12(4 Suppl):S131–41. doi: 10.1007/s10461-008-9413-1. [DOI] [PubMed] [Google Scholar]
- 10.Scott G. “They got their program, and I got mine”: a cautionary tale concerning the ethical implications of using respondent-driven sampling to study injection drug users. Int J Drug Policy. 2008 Feb;19(1):42–51. doi: 10.1016/j.drugpo.2007.11.014. [DOI] [PubMed] [Google Scholar]
- 11.Heckathorn D, Semann S, Broadhead R, Hughes J. Extensions of Respondent-Driven Sampling: A new approach to the study of injection drug users aged 18–25. AIDS Behav. 2002;6(1):55–67. [Google Scholar]
- 12.Wang J, Falck RS, Li L, Rahman A, Carlson RG. Respondent-driven sampling in the recruitment of illicit stimulant drug users in a rural setting: findings and technical issues. Addict Behav. 2007 May;32(5):924–37. doi: 10.1016/j.addbeh.2006.06.031. [DOI] [PubMed] [Google Scholar]
- 13.Gile KJ, Handcock MS. Respondent-driven sampling: An assessment of current methodology. Sociological methodology. 2010;40(1):285–327. doi: 10.1111/j.1467-9531.2010.01223.x. [DOI] [PMC free article] [PubMed] [Google Scholar]
- 14.Lu X, Bengtsson L, Britton T, Camitz M, Kim BJ, Thorson A, et al. The Sensitivity of Respondent-Driven Sampling Method. statAP. 2010 [Google Scholar]
- 15.Goel S, Salganik MJ. Assessing respondent-driven sampling. Proceedings of the National Academy of Sciences of the United States of America. Apr 13;107(15):6743–7. doi: 10.1073/pnas.1000261107. [DOI] [PMC free article] [PubMed] [Google Scholar]
- 16.Gile KJ, Handcock MS. Respondent-driven sampling: An assessment of current methodology. Arxiv. 2009 doi: 10.1111/j.1467-9531.2010.01223.x. preprint arXiv:09041855. [DOI] [PMC free article] [PubMed] [Google Scholar]
- 17.Tomas A, Gile KJ. The effect of differential recruitment, non-response and non-recruitment on estimators for Respondent-Driven Sampling. ArXiv. 2010 Preprint. [Google Scholar]
- 18.Gile KJ. Improved Inference for Respondent-Driven Sampling Data With Application to HIV Prevalence Estimation. Journal of the American Statistical Association. 2011;106(493):135–46. [Google Scholar]
- 19.Salganik MJ, Heckathorn D. Sampling and estimation in hidden populations using respondent-driven sampling. Sociological Methodology. 2004;34:183–239. [Google Scholar]
- 20.Heckathorn D. Extensions of Respondent-Driven Sampling: Analyzing continuous variables and controlling for differential recruitment. 2007. [Google Scholar]
- 21.Volz E, Heckathorn DD. Probability based estimation theory for respondent driven sampling. Journal of Official Statistics. 2008;24(1):79. [Google Scholar]
- 22.Volz E, Wejnert C, Degani I, Heckathorn DD. Respondent-driven sampling analysis tool (RDSAT) version 5.6. Ithaca, NY: Cornell University; 2007. [Google Scholar]
- 23.Goel S, Salganik MJ. Assessing respondent-driven sampling. Proceedings of the National Academy of Sciences of the United States of America. 2010 Apr 13;107(15):6743–7. doi: 10.1073/pnas.1000261107. [DOI] [PMC free article] [PubMed] [Google Scholar]
- 24.Frost SD, Brouwer KC, Firestone Cruz MA, Ramos R, Ramos ME, Lozada RM, et al. Respondent-driven sampling of injection drug users in two U.S.-Mexico border cities: recruitment dynamics and impact on estimates of HIV and syphilis prevalence. J Urban Health. 2006 Nov;83(6 Suppl):i83–97. doi: 10.1007/s11524-006-9104-z. [DOI] [PMC free article] [PubMed] [Google Scholar]
- 25.Paz-Bailey G, Jacobson JO, Guardado ME, Hernandez FM, Nieto AI, Estrada M, et al. How many men who have sex with men and female sex workers live in El Salvador? Using respondent-driven sampling and capture–recapture to estimate population sizes. Sex Transm Infect. doi: 10.1136/sti.2010.045633. [DOI] [PubMed] [Google Scholar]
- 26.Yeka W, Maibani-Michie G, Prybylski D, Colby D. Application of respondent driven sampling to collect baseline data on FSWs and MSM for HIV risk reduction interventions in two urban centres in Papua New Guinea. J Urban Health. 2006 Nov;83(6 Suppl):i60–72. doi: 10.1007/s11524-006-9103-0. [DOI] [PMC free article] [PubMed] [Google Scholar]
- 27.Ma X, Zhang Q, He X, Sun W, Yue H, Chen S, et al. Trends in prevalence of HIV, syphilis, hepatitis C, hepatitis B, and sexual risk behavior among men who have sex with men. Results of 3 consecutive respondent-driven sampling surveys in Beijing, 2004 through 2006. J Acquir Immune Defic Syndr. 2007 Aug 15;45(5):581–7. doi: 10.1097/QAI.0b013e31811eadbc. [DOI] [PubMed] [Google Scholar]
- 28.DesJarlais D, Arasteh K, Perlis T, Hagan H, Abdul-Quader A, Heckathorn D, et al. Convergence of HIV seroprevalence among injecting and non-injecting drug users in New York City. AIDS. 2007;21:231–5. doi: 10.1097/QAD.0b013e3280114a15. [DOI] [PubMed] [Google Scholar]
- 29.Johnston LG, Whitehead S, Simic-Lawson M, Kendall C. Formative research to optimize respondent-driven sampling surveys among hard-to-reach populations in HIV behavioral and biological surveillance: lessons learned from four case studies. AIDS Care. Jun;22(6):784–92. doi: 10.1080/09540120903373557. [DOI] [PubMed] [Google Scholar]
- 30.Uuskula A, Kals M, Rajaleid K, Abel K, Talu A, Ruutel K, et al. High-prevalence and high-estimated incidence of HIV infection among new injecting drug users in Estonia: need for large scale prevention programs. Journal of public health (Oxford, England) 2008 Jun;30(2):119–25. doi: 10.1093/pubmed/fdn014. [DOI] [PMC free article] [PubMed] [Google Scholar]
- 31.Kajubi P, Kamya MR, Raymond HF, Chen S, Rutherford GW, Mandel JS, et al. Gay and bisexual men in Kampala, Uganda. AIDS and Behavior. 2008;12(3):492–504. doi: 10.1007/s10461-007-9323-7. [DOI] [PubMed] [Google Scholar]
- 32.He Q, Wang Y, Lin P, Raymond HF, Li Y, Yang F, et al. High prevalence of risk behaviour concurrent with links to other high-risk populations: a potentially explosive HIV epidemic among men who have sex with men in Guangzhou, China. Sex Transm Infect. 2009;85(5):383. doi: 10.1136/sti.2009.035808. [DOI] [PubMed] [Google Scholar]
- 33.Wellman B. Network analysis: Some basic principles. JSTOR. 1983:155–200. [Google Scholar]
- 34.Emerson RM. Power-dependence relations. American sociological review. 1962;27(1):31–41. [Google Scholar]
- 35.Shulman N. Network analysis: A new addition to an old bag of tricks. Acta Sociologica. 1976;19(4):307–23. [Google Scholar]
- 36.Shulman N. Unpublished doctoral dissertation. Department of Sociology, University of Toronto; 1972. Urban social networks. [Google Scholar]
- 37.Coleman J, Katz E, Menzel H. Medical Innovation. Indianapolis: The Bobbs-Merrill Company, Inc; 1966. [Google Scholar]
- 38.Laumann EO. Friends of urban men: an assessment of accuracy in reporting their socioeconomic attributes, mutual choice, and attitude agreement. Sociometry. 1969;32:54–69. [Google Scholar]
- 39.Rudolph AE, Crawford ND, Latkin C, White K, Benjamin EO, Jones KC, et al. Individual, Study, and Neighborhood Level Characteristics Associated With Peer Recruitment of Young Illicit Drug Users: Optimizing Respondent Driven Sampling. Soc Sci Med. 2011;73(7):1097–104. doi: 10.1016/j.socscimed.2011.06.040. [DOI] [PMC free article] [PubMed] [Google Scholar]
- 40.Wejnert C. An Empirical Test of Respondent-Driven Sampling: Point Estimates, Variance, Degree Measures, and out-of-Equilibrium Data. Sociological methodology. 2009 Aug 1;39(1):73–116. doi: 10.1111/j.1467-9531.2009.01216.x. [DOI] [PMC free article] [PubMed] [Google Scholar]
- 41.Rudolph AE, Crawford ND, Latkin C, Heimer R, Benjamin EO, Jones KC, et al. Subpopulations of illicit drug users reached by targeted street outreach and respondent-driven sampling strategies: implications for research and public health practice. Annals of epidemiology. 2011;21(4):280–9. doi: 10.1016/j.annepidem.2010.11.007. [DOI] [PMC free article] [PubMed] [Google Scholar]
- 42.Ramirez-Valles J, Heckathorn DD, Vazquez R, Diaz RM, Campbell RT. From networks to populations: the development and application of respondent-driven sampling among IDUs and Latino gay men. AIDS Behav. 2005 Dec;9(4):387–402. doi: 10.1007/s10461-005-9012-3. [DOI] [PubMed] [Google Scholar]
- 43.Brewer DD. Forgetting in the recall-based elicitation of personal and social networks. Soc Networks. 2000;22:29–43. [Google Scholar]
- 44.Marsden PV. Network data and measurement. Annual review of sociology. 1990;16:435–63. [Google Scholar]
- 45.Bell DC, Belli-McQueen B, Haider A. Partner naming and forgetting: recall of network members. Social networks. 2007;29(2):279–99. doi: 10.1016/j.socnet.2006.12.004. [DOI] [PMC free article] [PubMed] [Google Scholar]
- 46.Gwadz MV, Leonard NR, Cleland CM, Riedel M, Banfield A, Mildvan D. The Effect of Peer-Driven Intervention on Rates of Screening for AIDS Clinical Trials Among African Americans and Hispanics. Am J Public Health. 2011 Jun;101(6):1096–102. doi: 10.2105/AJPH.2010.196048. [DOI] [PMC free article] [PubMed] [Google Scholar]
- 47.Abramovitz D, Volz EM, Strathdee SA, Patterson TL, Vera A, Frost SDW, et al. Using Respondent-Driven Sampling in a Hidden Population at Risk of HIV Infection: Who Do HIV-Positive Recruiters Recruit? Sex Transm Dis. 2009 Dec;36(12):750–6. doi: 10.1097/OLQ.0b013e3181b0f311. [DOI] [PMC free article] [PubMed] [Google Scholar]
- 48.Broadhead RS, Heckathorn DD, Weakliem DL, Anthony DL, Madray H, Mills RJ, et al. Harnessing peer networks as an instrument for AIDS prevention: Results from a peer-driven intervention. Public Health. 1999 Jun;113:42–57. [PMC free article] [PubMed] [Google Scholar]