

Abstract
During application of high intensity focused ultrasound (HIFU) with therapy arrays, the existence of grating lobes can cause heating at unintended tissue regions. Therefore, the reduction of grating lobes in therapeutic arrays is an important goal. One way to reduce the grating lobes in therapy arrays is to excite the arrays with broadband signals (defined here as >10% fractional bandwidth). To achieve a reduction in grating lobe levels in an ultrasonic array, coded waveforms can be utilized that reduce the grating lobe levels while maintaining the spatial peak temporal average intensity. In this study, a 5-MHz, 9-element, 1.25 mm inter-elemental spacing linear array was excited by a sinusoidal waveform, a conventional linear chirp, and a modified linear chirp. Both chirps spanned the −3-dB bandwidth of the transducer. The conventional chirp was a broadband signal with a linear sweep of frequencies between 2.5 and 7.5 MHz, with all frequency components excited with equal amplitude. The modified chirp signal also swept the frequencies between 2.5 and 7.5 MHz, but the amplitude was weighted such that the edges (low and high frequencies of the band) were excited with more energy than the center of the band. In simulations, the field patterns for the sinusoidal, conventional chirp and modified chirp excitations were produced from the array using Field II and compared. For experiments, the beam pattern from a 5-MHz single-element transducer was mapped using a hydrophone for the sinusoidal, conventional chirp and modified chirp excitation. Each field from the transducer was repeated and summed to produce a field from an array of 9 elements. The difference in the time averaged intensity (in dB) in the main lobe and grating lobes were estimated for each excitation and compared. The results demonstrated that the chirp signals resulted in decreases in grating lobe levels compared to the main lobe, i.e. 10 dB down for focusing and 6 dB down for focusing and steering. A further 1 dB decrease in grating lobe levels was observed for the modified chirp excitation compared to the conventional chirp excitation, which corresponds to ~21% reduction in energy deposition at the grating lobe location.
Keywords: Chirp signal, grating lobes, therapeutic ultrasound arrays
1 Introduction
Phased ultrasound arrays for therapy have advantages of electronic focusing and steering over mechanically scanned transducers, which enable treatment of multiple spots in the therapy plane without physically moving the array [1]. Therefore, these types of arrays have become a promising option for clinical therapeutic applications [2-4]. Due to the periodic placement of the elements and the use of sinusoidal excitation, ultrasound arrays produce secondary lobes called grating lobes which can sometimes have pressure or intensity levels equal to or greater than the main lobe and cause unwanted tissue lesions during treatment [5].
Grating lobes can be avoided while steering by designing the array such that the center to center spacing between elements, i.e., the pitch, is approximately less than λ/2 [6], where λ is the wavelength. In practice, larger element sizes, capable of producing high ultrasound power to cause tissue lesions, are preferred for high intensity focused ultrasound applications. Therefore, more often than not, it is not possible to maintain a λ/2 pitch for large elements. The need for larger elements to supply more ultrasonic power to a tissue for therapy means that the pitch of the array elements may be larger than λ/2. Because of this, ultrasound therapy arrays are prone to grating lobes that can be as high as the main lobe in intensity and cause unwanted tissue lesions.
To reduce the grating lobe levels, several techniques have been employed. Use of aperiodic arrays with optimized random distribution of unequally sized elements can reduce grating lobe levels by about half in comparison to a periodic array [4, 7]. Gavrilov [8] observed that deactivating an optimum subset of elements can reduce the grating lobe amplitude by about 50% near the surface of the array. Goss et al. [9] simulated a spherical array, with sixty-four 8-mm circular diameter sources randomly distributed, and found that the random distribution of the sources reduced the grating lobes.
Array designs based on the mathematical concept of aperiodic tessellation, where one or more shapes are repeated over the surface area to achieve optimum surface area coverage, has been investigated to reduce grating lobe levels in ultrasound therapy arrays [10]. In this study, two types of tessellation patterns were compared to transducers with randomly distributed circular elements and a periodic array with square elements. The non-periodic arrays demonstrated acceptable (−10 dB) levels of grating lobes, whereas the periodic array had unacceptable performance for steering.
Another method for reducing grating lobes levels is to excite the array with broadband signals (defined here as >10% fractional bandwidth). Use of broadband excitation signals to reduce grating lobes in therapeutic ultrasound arrays was first put forth by Dupenloup et al. [11, 12]. In these studies, a pseudo-random code sequence (m-sequence) was emitted using an annular therapy array and compared to the fields produced by a monochromatic sine wave. The long code was used, as opposed to pulsed excitation, to provide a sufficient spatial peak temporal average intensity (ISPTA) to produce thermal effects. Experimental and simulation results demonstrated that exciting the transducer with a broadband coded signal as opposed to a monochromatic continuous wave signal reduced the axial grating lobe amplitudes. In addition, it was observed that the reduction in the grating lobe levels depended directly on the bandwidth of the excitation. Furthermore, the authors observed an axial widening of the grating lobe associated with increased bandwidth, meaning that the ultrasonic energy was being spread over a larger region rather than focused in a smaller region [12]. Use of coded excitation can reduce the grating lobe levels but can also lead to a reduction in the temporal average intensity at the focus due to reduced response of a transducer outside its bandwidth. To overcome this problem, this study proposes the use of amplitude modulated coded excitation signals to compensate for reduction in temporal average intensity at the focus caused by conventional coded excitation (i.e., codes without amplitude modulation).
In the study reported here, the performance of a linear array system was examined using two kinds of broadband codes. The first code was a linear chirp without amplitude weighting, called the conventional chirp in this work [13]. The second code was also a linear chirp but with amplitude weighting such that the output waveform had a larger bandwidth than the output from a linear chirp with no amplitude weighting, called the modified chirp in this work. Previous studies have demonstrated that the bandwidth of an ultrasonic system can be doubled with the use of modified chirps [14, 15]. The performance of the array using different broadband excitations, i.e., −3-dB fractional bandwidth ranging from 10 to 90%, was quantified in terms of grating lobe levels compared to continuous sine wave excitation. In addition, the output waveform and the time-averaged intensity (ITA) were compared using the different excitation signals for different points in the field. Briefly, a nominal 1dB reduction in grating lobe levels were observed for the amplitude weighted chirp (modified chirp) excitation in comparison to unweighted linear chirp (conventional chirp) excitation, which corresponds to ~21% reduction in the time averaged intensity at the grating lobe location.
2 Materials and Methods
2.1 Simulations
Ultrasound fields for the different excitation signals were simulated in Field II [16,17] and compared to measurement results. Simulations studies were conducted to provide insight into the performance of an array system with different characteristics for conventional and modified chirp excitation. A range of steering, focusing and array properties (pitch or element to element spacing and conventional chirp excitation bandwidth) were examined under simulation that could not be examined experimentally with the limited capabilities. Specifically, the transducer from the experimental system was simulated but also modified to examine the effects of decreasing bandwidth and pitch on the grating lobe suppression. A 5-MHz single-element transducer (08A330, Valpey Fisher, Hopkinton, MA) already available in the laboratory was found suitable to be used in these experiments and as a model for simulations. The field of an array transducer can be visualized by delay-sum beamforming the field from single element transducers.
A 5-MHz transducer array (similar to the array used in experiments) was simulated in Field II by specifying the width, length, radius of curvature and impulse response of the transducer. Sinusoidal signals, conventional chirp signals and modified chirp signals were used to excite the transducer (see 2.3 Excitation Signals). The pressure fields from an array of sources with focusing and steering attributes were calculated. The ITA was calculated from the simulated pressure fields for locations throughout the field.
An ultrasound array consisting of nine 1-mm by 10-mm single-element rectangular transducers, similar to the experimental transducer, with a pitch of 2.25 mm was simulated. This particular pitch was chosen because previous simulations studies indicated that the pitch would provide a grating lobe that was only −3-dB from the main lobe using sinusoidal excitation. The pitch of the array also corresponded to an inter-elemental distance of the array of 7.5λ, where λ is the wavelength for sinusoidal excitation. An inter-elemental distance of 7.5λ provided a worst case scenario for the array to test the efficacy of our method in grating lobe reduction, while still being able to electronically focus and steer the array to produce a focal spot.
An array with 9 elements was utilized because it allowed focusing and steering at 70 mm deep in the field and yet not complicating the delay-sum beamforming code in the experimental studies. The performance of the array, for focusing and steering conditions, were evaluated by estimating the main lobe and grating lobe levels (ITA). Focusing and steering capabilities for the 1D ultrasound array is limited to the axial (x) and lateral (y) planes only. In the unsteered case, the focusing position for the ultrasound array was set to 70 mm in the axial direction at the center of the array (x = 70, y = 0). The differences in ITA at the main and grating lobes were calculated. The focal position was then set to 70 mm depth axially and at −5 mm laterally (x = 70, y = −5) to evaluate performance of the technique for steering. The reduction in grating lobe levels in comparison to main lobe level was estimated for focusing and steering conditions for all three excitation signals. Performance of the array in reducing grating lobe levels while varying the inter-elemental distance from 4λ to 8λ, i.e. varying the pitch from 1.1 mm to 2.5 mm, and while varying the excitation bandwidths of the conventional chirp from 10% to 90% were also compared for the different excitation signals.
2.2 Experimental Measurements
A 5-MHz single-element rectangular transducer (08A330, Valpey Fisher, Hopkinton, MA), 1 mm by 10 mm, with 7.6 cm radius of curvature, was used for the study. The transducer was characterized and its bandwidth was measured using a hydrophone (0.5 mm diameter, Marconi 6999/1/000001/100; GEC Marconi Ltd., Great Baddow, UK). A pulser-receiver (5900PR, Panametrics-NDT, Waltham, MA) was set to drive the transducer in the through-transmission mode. Figure 1 shows the experimental setup along with related electronics. The transducer and the hydrophone were placed inside a tank filled with degassed water. The transducer was held stationary in the tank. The hydrophone was attached to a 3D positioning system (Daedal Inc., Harrison, PA) and scanned in the transducer focal plane to find the focus of the transducer by identifying the location of maximum received signal at the hydrophone.
Figure 1.

Experimental setup showing the 5 MHz transducer, hydrophone and related electronics.
The signal from the hydrophone located at the focus of the transducer was recorded to a PC for post processing. The impulse response of the transducer at the focal position was recorded at 250 MHz sampling rate and the −3-dB bandwidth of the transducer was later calculated from the frequency spectrum of the measured impulse response (Figure 2). The −3-dB bandwidth of the transducer, where the ultrasound pressure amplitude drops by half the center frequency, was measured to be 3.4 MHz (3.6-7 MHz).
Figure 2.

Impulse response and bandwidth of the 5 MHz single element transducer.
To mimic a linear phased array, the field from the single-element transducer was measured along the transducer width direction as shown in Figure 3. The field was measured at each position within a box defined by dimensions of 50 mm to 120 mm in the axial direction by a side length of 40 mm corresponding to scanning from −20 to 20 mm in the lateral direction about the transducer axis. The hydrophone scanned in steps of 250 μm in the lateral direction and 1 mm in the axial. At each point in the scanning plane, 0.1 ms long hydrophone signals were recorded by the computer DAQ at a sampling rate of 250 MHz. At each of the axial positions, we obtained a two dimensional matrix of size 161 by 28520.
Figure 3.

Depiction of the transducer and the field plane scanned by the hydrophone.
The field points measured from the transmission from the single-element transducer were used to create an array by delay-sum beamforming the measured fields. The number of elements and pitch of the ultrasound array were determined by the extent of the field that was measured from the single transducer. A pitch of 2.25 mm was used in experiments because according to simulations 2.25 mm represented the pitch value where the grating lobes were at −3-dB from the main lobe for sinusoidal excitation. In order to visualize an array containing more than nine elements, measurement of the single element field at lateral locations farther than 20 mm would be required. The −10-dB beam width of the single-element transducer in the lateral direction covered −7 to 7 mm, and hence measuring and using signals at locations outside 20 mm in lateral direction was not sensible due to the low signal-to-noise ratio (SNR) (< −10 dB) at these locations. Due to the above said constraints, a nine-element array was used for this study. The field from a nine-element linear array was visualized by delaying and summing the signals from the single-element transducer. The delays needed at each of the nine individual elements to focus the array at required positions in the x, y plane with x being the axial direction and y being the lateral direction, were obtained from beamforming delays [18],
| (1) |
where c is the speed of sound, Rf is the azimuthal focal point, N is the number of elements in the, d is the spacing between the elements, φs is the angle of steering and n is the element index.
To produce the array field pattern, for a given element the field from the single-element transducer at each depth position was delayed according to the Eq (1). At each axial position, the field was recorded as a 2D matrix. The calculated delays (μs) can be translated to number of data points based on the sampling rate. The number of data points that need to be shifted for a given delay can be calculated as a ratio of calculated delay (μs) to sampling period (μs). The 2D matrices were shifted by calculated number of data points (pertaining to the delays) and then a corresponding number of rows with zeroes were introduced to the start of the matrix to visualize delays. Nine such delayed matrices were obtained pertaining to each of the nine elements in the array. The delayed matrices were shifted by multiples of nine progressively, starting with the second matrix which was shifted by nine columns, the third by eighteen columns and so on till the ninth array which was shifted by 72 columns. Shifting the arrays by multiples of nine columns signified the increasing distance between the first and successive elements as a multiple of the pitch (2.25 mm). Zeroes were introduced to the shifted columns. The nine matrices were averaged column wise based on the number of summations the column acquired excluding the forced zero entries, to ensure that the averaging was done based on non-zero entries only. The number of zeroes inserted depends on the calculated delays and the pitch and have no consequence in the final field calculation. For each axial position, the final 2D matrix with the delay-summed signals was squared and summed to obtain ITA patterns. The grating lobe levels were evaluated for focusing the array to x = 70, y = 0 mm and then for focusing and steering the array to x = 70, y = −5 mm.
2.3 Excitation signals
Fields from the transducer were mapped out with the hydrophone using three different excitation schemes. The fields were measured when the transducer was excited by a sinusoidal waveform, a conventional linear chirp, and a modified linear chirp. Each of the three excitation signals was generated by a Matlab (The MathWorks, Inc., Natick, MA) code and fed into an arbitrary waveform generator (WW1281, Tabor Electronics, Irvine, CA). The signals from the arbitrary waveform generator were amplified by a RF power amplifier (EIN 2100L, Rochester, NY) and sent to the transducer. The bandwidth of the conventional chirp and modified chirp signals was chosen based on the transducer impulse response. The impulse response was estimated by exciting the transducer with pulse excitation (5900PR, Panametrics-NDT, Waltham, MA) and measuring the waveform at the focus with a calibrated hydrophone (0.5 mm diameter, Marconi 6999/1/000001/100; GEC Marconi Ltd., Great Baddow, UK). Figure 4 shows examples of the chirp excitation signals used in this study. The sinusoidal input was a monochromatic 5-MHz continuous wave signal. The bandwidth measured from the transducer was used to specify the bandwidth for the chirp input signal. To obtain a symmetric chirp output from the transducer, the input chirp signal was set to cover 2.5-7.5 MHz. The conventional chirp was a broadband signal with a linear sweep of frequencies between 2.5 and 7.5 MHz, with all frequency components excited with equal amplitude. The modified chirp signal also swept the frequencies between 2.5 and 7.5 MHz, but the amplitude was weighted such that the edges (low and high frequencies of the band) were excited with higher voltages than the center of the band. This procedure of modifying the chirp shape was done in accordance with the coding technique outlined in Oelze based on convolution equivalence [14, 15]. By modifying the chirp in this way, the transmitted signal, which is the convolution of the excitation signal with the transmit impulse response, will have a flat response across the frequencies swept by the chirp. In addition, this technique can result in increased bandwidth than for the conventional chirp excitation, therefore providing further reduction in the grating lobe levels in comparison to conventional chirp excitation and an ITA that closely resembles the sinusoidal excitation. All the three excitation signals were 12.8 μs long; this corresponded to a −3-dB fractional bandwidth of the sinusoidal excitation of approximately 1%.
Figure 4.

Conventional chirp (2.5-7.5 MHz) and modulated chirp (2.5-7.5 MHz) transducer excitation inputs and corresponding signals recorded by the hydrophone.
The transducer used in this study with a 3.4 MHz (70%) bandwidth was not necessarily representative of the clinically relevant transducers used for therapy, which typically have a narrower (<50%) bandwidth. Furthermore, pulse-echo measurements revealed that the transducer response was not symmetric about the center frequency and had a center frequency of 5.4 MHz (see Figure 2). This can introduce asymmetry in the signals, favoring the higher frequencies when using chirp excitation and pushing the location of the grating lobes to be closer to the main lobe location because of the decrease in wavelength associated with the center frequency. In order to compare the grating lobes located at approximately the same lateral distance from the main lobe when comparing chirp excitation with sinusoidal, the measured signals were convolved with a transfer function. The transfer function was given by
| (2) |
where h(f) is the Fourier transform of the transfer function h(t), cl(f) and cm(f) are the Fourier transforms of the input linear chirp signal and measured signal excited with a the modified chirp, and cm*(f) is the complex conjugate of cm(f).
The time domain transfer function, h(t), was obtained by calculating the inverse Fourier transform of h(f). The measured signals were convolved with the calculated transfer function h(t) to obtain a symmetric impulse response on transmit as recorded by the hydrophone. The transducer outputs for chirp and modified chirp excitation, after convolution with the transfer function are shown in Figure 5. Due to the convolution, the chirp and modified chirp responses were symmetric about the peak frequency. Furthermore, the output of the transducer excited with the modified chirp and convolved with the transfer function provided constant amplitude over the duration of the chirp similar to sinusoidal excitation. Convolving the chirp signals with the transfer function reduced the bandwidth (Figure 5). The original chirp signal had a −3 dB bandwidth of 5 MHz (2.5-7.5 MHz). The −3 dB bandwidth of the convolved chirp signal was 4.4 MHz (2.8 to 7.2 MHz). The frequency range covered by the conventional chirp and modified chirps signals for simulation studies was set to 2.8 to 7.2 MHz.
Figure 5.

Bandwidths (−3 dB) for chirp signal before and after convolution with modified impulse response.
3 Results
3.1 Simulation results
Figure 6 shows the simulated field from a nine element linear array with 2.25 mm pitch. The array was focused at a depth of 70 mm without steering, i.e., (70, 0). Distinct grating lobes can be observed while exciting the transducer with a sinusoidal input. The grating lobe levels are reduced with the conventional chirp and modulated chirp excitations but the widths of the grating lobes are extended. The grating lobe width of the sinusoidal excitation at −3 dB was approximately 2 mm and the widths for the conventional and modified chirps were approximately 4 mm and 5 mm, respectively. The reduction in the grating lobe levels for the chirp excitations were approximately 3.9 (5.1) dB from the grating lobe levels for sinusoidal excitation compared to the chirp (modified chirp) excitation. Figure 7 shows the simulated field from the nine-element linear array for sinusoidal, conventional chirp and modulated chirp excitation when the array was steered to −5 mm laterally and focused at a depth of 70 mm, i.e., (70,-5). The grating lobe levels were further reduced for modified chirp excitation (−5.4 dB from the sinusoidal grating lobe level) in comparison to the conventional chirp (−4.3 dB from the sinusoidal grating lobe level) and sinusoidal inputs. For the steering case, the grating lobe levels were as high as the main lobe for sinusoidal excitation. Use of the modulated chirp further reduced the grating lobe level by about 1.1 dB in comparison to conventional chirp excitation. It can also be observed that the use of conventional chirp and modulated chirp broadened the width of the grating lobes. Similar to the unsteered case, the grating lobe width of the sinusoidal excitation at −3 dB was approximately 2 mm and the widths for the conventional and modified chirps were approximately 4 mm and 5 mm, respectively.
Figure 6.
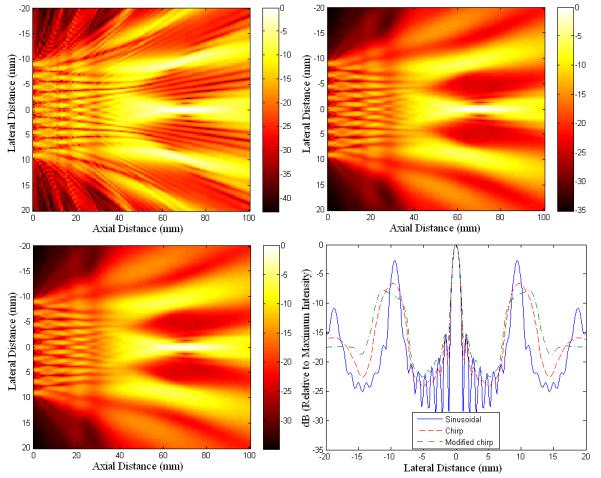
Comparison of simulated fields and sidelobe levels for sinusoidal (top left), conventional chirp (top right) and modified chirp (bottom left) excitation for focusing at 70 mm from the source on axis. (Color on web only)
Figure 7.

Comparison of simulated fields and sidelobe levels for sinusoidal (top left), conventional chirp (top right) and modified chirp (bottom left) excitation for focusing at 70 mm from the source and −5 mm laterally from the axis. (Color on web only)
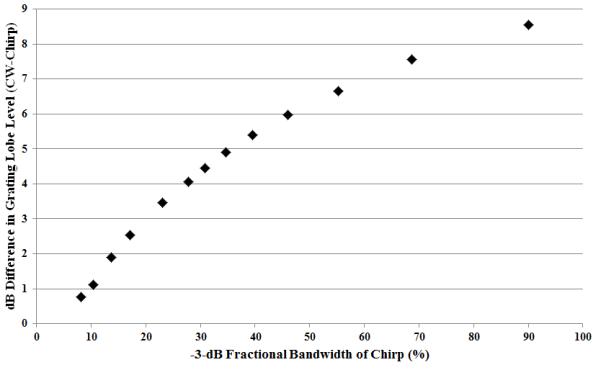
Figures 8 and 9 show the effect of varying the excitation bandwidth and array pitch on reduction in grating lobe levels for the linear chirp excitations, respectively. The different bandwidths and pitch values were simulated in Field II as already described in section 2.1. For Figure 8, while varying the bandwidth, the pitch was kept constant at 2.25 mm. As expected, as the bandwidth was increased because of chirp excitation the amount of grating lobe level reduction compared to the CW excitation increased. At 100% −3-dB fractional bandwidth, the grating lobe level reduction is predicted to be almost 9 dB. To understand the effects of transmitting with a modified chirp excitation, if a doubling of the bandwidth is achieved from the modified chirp then the amount of grating lobe reduction will depend on the original bandwidth. For example, going from 10% bandwidth to 20% bandwidth results in a predicted improvement of 1.8 dB, while going from 50% bandwidth to 100% bandwidth results in a predicted improvement of ~2.7 dB. In terms of ITA, a decrease of 1.8 dB in the grating lobe level represents ~34% decrease in the ITA while 2.7 dB represents ~46% decrease in the ITA.
Figure 8.
Improvement in grating lobe reduction for conventional chirp. The values refer to differences in dB of levels calculated from the intensities.
Figure 9.

Improvement in grating lobe reduction for conventional chirp and modified chirp excitation for range of array pitch values compared to sinusoid excitation. The values refer to differences in dB of levels calculated from the intensities.
While varying the pitch from 1.1 mm to 2.5 mm, the bandwidth was maintained at 5 MHz (30% −3-dB fractional BW). From Figure 9, it can be observed that larger pitch values resulted in larger reductions in the grating lobe levels when using the modified chirp compared to the conventional chirp excitation. For example, when increasing the pitch from 1.1 mm to 1.8 mm, the modified chirp provided reductions from −4 dB to −5.25 dB compared to continuous wave excitation whereas the conventional chirp provided reduction from −3.25 dB to 4 dB. As the pitch increases relative to the wavelength the grating lobes shift closer to the main lobe, which results in larger grating lobes. For example, with a pitch of 2.25 mm and operating frequencies of 2.5, 5, and 10 MHz (corresponding to wavelengths of 594, 297, and 149 μm in water) the first grating lobes are located at angles of 15.5, 7.6, and 3.8 degrees, respectively. When the pitch was increased to above 2.2 mm, the grating lobe level reductions for the conventional and modified chirps remained constant for increasing pitch size.
3.2 Measurements results
Figures 10 and 11 show the delay-summed beam patterns for the nine-element array based on measurements of the field pattern from the transducer when focused (70,0 mm) and steered & focused (70,-5), respectively. The plot comparing the grating levels shows a nominal 4 dB decrease in grating lobe levels for the conventional chirp excitations in comparison to sinusoidal excitation. Use of modified chirp excitation further reduced the grating lobes by approximately 1 dB or more in comparison to the conventional chirp excitation. Overall, the use of conventional chirp and modified chirp reduced the grating lobe levels by up to 10 dB in comparison to main lobe.
Figure 10.

Comparison of beamformed fields and sidelobe levels for sinusoidal (top left), conventional chirp (top right) and modified chirp (bottom left) excitation for focusing at 70 mm from the source on axis. (Color on web only)
Figure 11.

Comparison of beamformed fields and sidelobe levels for sinusoidal (top left), conventional chirp (top right) and modified chirp (bottom left) excitation for focusing at 70 mm from the source and −5 mm laterally from the axis. (Color on web only)
Table 1 lists the measured reduction in grating lobe levels (dB) in comparison to main lobe, for focusing and steering conditions from simulations and measurements. The results from measurements are in agreement with the simulated results, hence confirming the validity of our methods. For example, conventional chirp decreased grating lobe levels by 4 dB for both simulations and experiments in the unsteered case and modified chirp decreased grating lobe levels by 5.1 dB for both simulations and experiments in the unsteered case. When steering the array, the experimental results provided larger decreases in the grating lobe levels using chirp and modified chirp than what was observed for the simulations. In summary, use of conventional chirp excitation produced incremental 4-5 dB reduction in grating lobe in comparison to the sinusoidal excitation. Use of a modified chirp produced a 5-7 dB reduction in grating lobe levels when compared to sinusoidal excitation. The results suggest a marginal but additive reduction of between 1.1 to 1.6 dB in grating lobe levels for modified chirp excitation as opposed to the conventional chirp excitation. This would correspond to a reduction in the ITA in the grating lobe of 22% to 31%.
Table 1.
Simulated and measured decrease in grating lobe levels in dB (with respect to mainlobe levels) for sinusoidal, conventional chirp and modified chirp excitations.
| Simulations | Measurements | |||
|---|---|---|---|---|
| Focusing | steering | focusing | steering | |
| Sinusoidal | −2.7 | −0.1 | −5 | 0 |
| chirp | −6.6 | −4.4 | −9 | −5.8 |
| Modulated chirp |
−7.8 | −5.5 | −10.1 | −7.4 |
4 Discussion
In this study, fields from an ultrasound array were visualized by simulation and by delay-sum beamforming signals measured from a physical single-element transducer. The best way to compare effects of excitation signals on grating lobe levels of a therapy array would have been to excite an actual ultrasound therapy array with the three excitation signals and measure the field using a hydrophone. However, because of a lack of availability of an ultrasound therapy array, the delay-sum beamforming method from measured fields from a single-element transducer was adopted here.
In the cases examined in this study, the grating lobe levels were higher, compared to the main lobe, for the steering cases as opposed to the focusing only case. The reason for the increase in the relative grating lobe levels is that the individual element factors of the array sources provide directivity to the overall array. This element factor does not change direction when the array beam is steered. The element factor produces a directivity that is maximum at broadside and falls off versus angle from broadside. Therefore, when steering the beam, the main lobe can be located at an angle that has a reduced magnitude due to the element factor while the grating lobe can move closer to broadside causing an increase in the grating lobe magnitude relative to the main lobe.
The signals measured from the single-element transducer were convolved with the calculated transfer function h(t) to reduce the bandwidth to more closely mimic bandwidths associated with therapy arrays and to provide more symmetry to the bandwidth about the center frequency. The 5 MHz transducer used here is a broadband transducer with a −3-dB bandwidth of 3.4 MHz (68% fractional bandwidth). Clinical HIFU therapy transducers often have lower bandwidth (<40% fractional bandwidth) [19]. Simulation studies demonstrated that grating lobe levels were reduced using chirp excitation and that greater reduction occurred as the bandwidth of the chirp increased. Previous studies have demonstrated that the bandwidth of an imaging system can be doubled using modified chirps [14, 15]. In these studies, modified chirps were used with a pulse compression scheme based on a mismatched filter to shape the bandwidth for improved axial resolution in imaging while maintaining low range sidelobes. If the bandwidth of the system is doubled, simulation results suggest that decreases in the grating lobe levels of up to 2.5 dB are possible, which would result in a decrease in ITA at the grating lobe location of ~44%. These reductions are substantial in terms of reducing the likelihood of unwanted temperature elevations at the grating lobe locations.
Transducer heating due to the increased energy input at frequencies away from the center frequency of the transducer may be an issue in clinical settings and should be properly evaluated while designing the array. Sanchez [20] has demonstrated that exciting the transducer with modified chirp signals actually produced less heating at the transducer surface than from sinusoidal excitation and that transducer heating may not be as much of an issue with modified chirp excitation. Briefly, in that work a noncontact infrared thermometer (Fluke 61, Everitt, WA) was used to measure the temperature at the surface of a single-element transducer operating in air during excitation. Excitations consisted of sinusoidal excitation and modified chirp excitation. The sinusoidal excitation produced the most heating with surface temperatures of the transducer up to 66 °C whereas the modified chirp excitation did not produce any measureable surface heating with pulse repetition frequencies of 1 kHz and below.
In addition to reduction in grating lobe levels, use of broadband excitation has been found to increase the cavitation threshold in media, i.e., decreasing bubble formation and stable cavitation activity as measured by photoluminescence from a solution of luminol [21]. Decreasing the bubble formation and increasing the cavitation threshold (stable and inertial) may produce benefits when trying to prevent cavitation in order to better control a HIFU exposure. On the other hand, if it is desired to utilize bubbles and cavitation for enhanced heating, the use of broadband signals for HIFU may hinder the generation of bubbles for enhanced heating. The role of cavitation in HIFU is still under debate [22].
The field plots (Figs. 6, 7, 10, and 11) show the spatial widening of the grating lobes during chirp and modified chirp excitation. Less spatial broadening of the grating lobes was observed in the simulation studies compared to the experiments, e.g., for the unsteered case, the modified chirp grating lobes had a width of approximately 5 mm in simulation whereas the grating lobes had a width of more than 10 mm in the experiments. For the sinusoidal excitation case, the ultrasound energy was confined to a small area (i.e., approximately 2 mm wide) centered at the grating lobe location, whereas for the conventional chirp and modified chirp excitation cases, ultrasound energy was spread out spatially (4 to 5 mm or more) and reduced gradually outside of the grating lobe location. Although the reduction in grating lobe levels can mean a decreased possibility of unwanted tissue heating, the spread in grating lobe width also means that there exists a possibility that larger sections of tissue can exceed cavitation or heating thresholds. The spatial broadening of grating lobes widths can also translate to minimal heating of tissue at the grating lobe locations. However, the temperature rise due to the spatially spread grating lobes should be less due to the −10-dB reduction in the ITA at the grating lobes in comparison to the main lobe for the conventional chirp and modified chirp excitations.
The current study only examined linear acoustic propagation in the production of grating lobe levels. The high pressure levels associated with HIFU excitation will generate a nonlinear response. One question regarding this study is the validity of these simulation results using Field II, which did not account for nonlinear distortion of the propagating waves. One of the effects of nonlinear distortion on the propagating waves is the production of higher harmonics in the propagating wave. At the grating lobe locations corresponding to the fundamental, it is expected that significant harmonic content will be generated. These grating lobes associated with the harmonics will be lower than the grating lobes associated with the fundamental. However, the absorption of higher harmonics may result in higher temperature increases even though the grating lobe levels associated with the higher harmonics may be lower than the grating lobes associated with the fundamental frequency. Future studies will more closely examine the role of nonlinear distortion of signals and the role of nonlinear distortion in producing grating lobes.
Highlights.
Narrow band excitation of ultrasonic arrays provides sufficient energy for therapy but can result in unwanted gating lobes.
Chirps were used to excite a therapy array providing long signals with broader bandwidth compared to continuous wave.
The chirp waveforms resulted in significant reductions in grating lobes levels compared to continuous wave excitation.
Amplitude weighting the chirp waveforms resulted in additional reductions in grating lobe levels.
Acknowledgements
The work was supported by NIH Grant R01 EB008992 (National Institutes of Health, Bethesda, MD).
Footnotes
Publisher's Disclaimer: This is a PDF file of an unedited manuscript that has been accepted for publication. As a service to our customers we are providing this early version of the manuscript. The manuscript will undergo copyediting, typesetting, and review of the resulting proof before it is published in its final citable form. Please note that during the production process errors may be discovered which could affect the content, and all legal disclaimers that apply to the journal pertain.
References
- [1].Tan JS, Frizzell LA, Sanghvi N, Wu S, Seip R, Kouzmanoff JT. Ultrasound phased arrays for prostrate treatment. J. Acoust. Soc. Am. 2001;109:3055–3064. doi: 10.1121/1.1373444. [DOI] [PubMed] [Google Scholar]
- [2].Buchanan MT, Hynnnyen K. Design and experimental evaluation of intracavitary ultrasound phased array system for hyperthermia. IEEE Trans. Biomed. Eng. 1994;41:1178–1187. doi: 10.1109/10.335866. [DOI] [PubMed] [Google Scholar]
- [3].Makin IRS, Mast TD, Faidi W, Runk MM, Barthe PG, Slayton MH. Miniaturized ultrasound arrays for interstitial ablation and imaging. Ultras. Med. Biol. 2005;31:1539–1550. doi: 10.1016/j.ultrasmedbio.2005.07.008. [DOI] [PubMed] [Google Scholar]
- [4].Hutchinson EB, Hynynen K. Intracavitary ultrasound phased arrays for prostrate thermal therapies: MRI compatibility and in vivo testing. Med. Phys. 1998;25:2392–2399. doi: 10.1118/1.598450. [DOI] [PubMed] [Google Scholar]
- [5].Chapelon JY, Faure P, Plantier M, Cathignol D, Souchon R, Gorry F, Gelet A. The feasibility of tissue ablation using high intensity electronically focused ultrasound. Proc IEEE Ultrasonics Symp. 1993:1211–1214. [Google Scholar]
- [6].Steinberg BD. Principles of aperture and array system design. Wiley; New York: 1976. p. 74. [Google Scholar]
- [7].Hutchinson EB, Buchanan MT, Hynynen K. Design and optimization of an aperiodic ultrasound phased array for intracavitary prostrate thermal therapies. Med. Phys. 1996;23:767–776. doi: 10.1118/1.597741. [DOI] [PubMed] [Google Scholar]
- [8].Gavrilov LR, Hand JW, Abel P, Cain CA. A method of reducing grating lobes associated with an ultrasound phased linear array intended for transrectal thermotherapy. IEEE Trans. Ultrason. Ferroelectr. Freq. Contr. 1997;44:1010–1017. [Google Scholar]
- [9].Goss SA, Frizell LA, Kouzmanoff JT, Barich JM, Yang JM. Sparse random ultrasound phased array for focal surgery. IEEE Trans. Ultrason. Ferroelectr. Freq. Contr. 1996;43:1111–1121. [Google Scholar]
- [10].Raju BI, Christopher SH, Seip R. Ultrasound therapy transducers with space filling non-periodic arrays. IEEE Trans. Ultras., Ferroelect. and Freq. Contr. 2011;58:944–954. doi: 10.1109/TUFFC.2011.1895. [DOI] [PubMed] [Google Scholar]
- [11].Dupenloup F, Chapelon JY, Cathignol D, Sapozhnikov O. The use of broadband signals to reduce grating lobe effects in HIFU tissue ablation. Proc IEEE Ultrasonics Symp. 1994:1865–1868. [Google Scholar]
- [12].Dupenloup F, Chapelon JY, Cathignol J, Sapozhnikov O. Reduction of grating lobes of annular arrays used in focused ultrasound surgery. IEEE Trans. Ultrason. Ferroelectr. Freq. Contr. 1996;43:991–998. [Google Scholar]
- [13].Heider B, Lewin PA, Thomenius KE. Pulse elongation and deconvolution filtering for medical ultrasonic imaging. IEEE Trans. Ultrason. Ferroelectr. Freq. Contr. 1998;45:98–113. doi: 10.1109/58.646915. [DOI] [PubMed] [Google Scholar]
- [14].Oelze ML. Improved axial resolution using pre-enhanced chirps and pulse compression. Proc.IEEE Ultrasonics Symp. 2006;1085:1088. [Google Scholar]
- [15].Oelze ML. Bandwidth and resolution enhancement through pulse compression. IEEE Trans Ultrason. Ferroelectr. Freq. Contr. 2007;54:768–781. doi: 10.1109/tuffc.2007.310. [DOI] [PubMed] [Google Scholar]
- [16].Jensen J, Svendsen NB. Calculation of pressure fields from arbitrarily shaped, apodized and, excited ultrasound transducers. IEEE Trans. Ultrason. Ferroelectr. Freq. Contr. 1992;39:262–267. doi: 10.1109/58.139123. [DOI] [PubMed] [Google Scholar]
- [17].Jensen JA. Field: A program for simulating ultrasound system. Med. Biol. Eng. Comp. 1996;34:351–353. [Google Scholar]
- [18].Cobbold RSC. Foundations of biomedical ultrasound. Oxford University Press; 2007. pp. 413–492. Chapter 6. [Google Scholar]
- [19].Ebbini E, Yao H, Shrestha A. Dual-mode ultrasound phased arrays for image-guided surgery. Ultrasonic Imaging. 2006;28:65–82. doi: 10.1177/016173460602800201. [DOI] [PubMed] [Google Scholar]
- [20].Sanchez JR, University of Illinois . Dissertation. Urbana-Champaign: 2010. Improving ultrasonic imaging using novel coded excitation techniques; pp. 21–22. http://www.brl.uiuc.edu/Downloads/ (Last accessed on 3/19/13) [Google Scholar]
- [21].Chapelon JY, Dupeloup F, Cohen H, Lenz P. Reduction of cavitation using pseudorandom signals. IEE Trans. Ultras. Ferroelect. Freq. Contr. 1996;43:623–625. [Google Scholar]
- [22].Coussios CC, Farny CH, Ter Haar G, Roy RA. Role of acoustic cavitation in the delivery and monitoring of cancer treatment by high-intensity focused ultrasound (HIFU) Int J Hyperthermia. 2007;23:105–120. doi: 10.1080/02656730701194131. [DOI] [PubMed] [Google Scholar]