

Abstract
Measuring diagnostic panels of multiple proteins promises a new, personalized approach to early detection and therapy of diseases like cancer. Levels of biomarker proteins in patient serum can provide a continually updated record of disease status. Research in electrochemical detection of proteins has produced exquisitely sensitive approaches. Most utilize ELISA-like sandwich immunoassays incorporating various aspects of nanotechnology. Several of these ultrasensitive methodologies have been extended to microfluidic multiplexed protein detection, but engineered solutions are needed to measure more proteins in a single device from a small patient sample such as a drop of blood or tissue lysate. To achieve clinical or point-of-care (POC) use, simplicity and low cost are essential. In multiplexed microfluidic immunoassays, required reagent additions and washing steps pose a significant problem calling for creative engineering. A grand challenge is to develop a general cancer screening device to accurately measure 50–100 proteins in a simple, cost effective fashion. This will require creative solutions to simplified reagent addition and multiplexing.
Introduction
This perspective article addresses advanced electrochemical methods of detecting multiple proteins from human samples like serum, saliva, tissue, and urine, and their applications to the diagnosis and therapy of cancer. It focuses somewhat on technical details of these rather demanding measurements, and also considers critical advances needed to bring them into the clinic. The National Institutes of Health (NIH) defines biomarkers as “molecules that can be reliably and accurately measured and are indicators of normal or disease biological processes and responses to therapeutic interventions”.1 According to this definition, molecular biomarkers for cancer may include nucleic acids, secreted proteins, and small molecule metabolites in biological fluids like blood and saliva. Nucleic acids like DNA and RNA can be used to predict risk of cancer, but secreted proteins and metabolites can deliver a “snapshot” of disease status in patients.2–4Biomarker protein measurements promise early detection and the ability to monitor therapy and surgery. For this reason, considerable effort in cancer biomarker research has focused on proteins and the ability to detect them in the clinic for diagnostic purposes.5–8 Cancer biomarker proteins have been identified for every major type of cancer. While metabolites are also promising targets, research into their relation to disease diagnostics is in the early stages.
Many biomarker proteins are secreted into the blood at higher than normal levels when cancers begin to develop, and are useful for diagnosis even before the onset of tumors. The protein prostate specific antigen (PSA) is clinically used as a serum biomarker for prostate cancer, and has been recommended by the American Cancer Society as an early screening tool.9 However, the serum PSA test has insufficient predictive value,10 since nearly 1/3 of men with prostate cancer have normal PSA levels.11 Also, PSA levels do not distinguish between aggressive forms of the disease that require immediate treatment and indolent forms, which may not need treatment. Biomarker proteins, including PSA, are often specific to several different types of cancer and to inflammation. These reasons coupled with human biological diversity often render single biomarker tests unreliable, and measuring panels of proteins is expected to be a much more accurate diagnostic than single biomarkers.3,5,6,12,13 Determinations of 4 to 10 proteins in a panel for a given cancer can help average out biological variability, improve upon the moderate specificity of individual biomarkers, and greatly enhance diagnostic reliability. The goal is to develop a protein panel for a given cancer that provides normalized mean values of all the protein levels and affords high clinical specificity and selectivity for diagnostics.14
Defining the Problem
The analytical problem involves measuring very low levels of multiple proteins in a complex biological matrix containing many non-analyte proteins. For reliable clinical predictions, both normal and cancer-indicating levels of biomarkers need to be measured with good accuracy. However, different target analyte proteins in serum may be present at very different levels. A PSA serum concentration of 4 to 10 ng mL−1 suggests the possibility of early stage prostate cancer,5,10 while normal levels are typically 0.5 to 2 ng mL−1, and late stage prostate cancer is characterized by values above 100 ng mL−1. On the other hand, consider interleukin 6 (IL-6), which is secreted into blood at elevated levels in prostate, oral, lung, multiple myeloma and renal cell cancers.15 Patients with cancer have serum IL-6 ranging from ≥20 up to thousands of pg mL−1 compared to <6 pg mL−1 in cancer-free individuals.15 Thus, serum concentrations of IL-6 need to be measured at levels 1000-fold smaller than those of PSA, in the same assay if they are to be used in prostate cancer diagnostics. To further complicate the analytical determinations, serum albumin is present in human blood at levels of 34–54 mg mL−1, 50 million-fold larger than normal IL-6 levels.16 In general, diagnostic panels of cancer biomarkers in serum will have some members at very low concentrations, and other members at much higher concentrations. Also, there are thousands of nonanalyte proteins in serum at higher than ng mL−1 levels.6
Thus, the task is to accurately measure both high and low concentrations of different proteins without interference from non-analyte serum proteins. This requires very high selectivity, as afforded by antibodies and traditionally embodied by enzyme-linked immunosorbent assays (ELISA), which have long been methods-of-choice for clinical protein measurements.17 ELISA employs absorbance of a colored enzyme reaction product to achieve detection limits (DL) for many proteins that approach 1 pg mL−1 and dynamic ranges that are often appropriate for clinical levels. However, ELISA in its classic format has limitations in analysis time, sample size, equipment cost, and multiplexing. Nevertheless, these limitations may be overcome by integrated microfluidic systems.18 For example, an ELISA-based microfluidic device using gold nanoparticle labeling and amplification of optical readout by silver deposition has been developed for automated detection of antibodies against HIV and syphilis causative agent in blood.19
Two major developments need to take place to translate biomarker protein panels into the clinic for cancer diagnostics. First, measurement devices for clinical or point-of-care (POC) detection of panels of proteins need to be developed that are sensitive, multiplexed, accurate, and reasonably priced. Devices for POC must also be fast, and feature full automation, low cost, and technical simplicity.20 Ultrasensitivity and very low detection limits are also desirable because they offer the opportunity to dilute out interferences or to trade sensitivity for assay speed. They may detect new biomarkers at ultralow levels that are not viable with current commercial measurements, and can be applied to cancer recurrence where biomarker proteins levels rise from ultralow levels (e.g. PSA). Measurement devices that feature automated reagent delivery, reagent stability, and simplified reports to medical caregivers will also be important achievements.19.21 At present, these requirements have not been fully met by any commercial protein detection device. Second, diagnostic biomarker protein panels for specific cancers need to be evaluated and validated. Newly discovered biomarkers that are specific for cancer type subgroups may be important members of these panels. This might allow panels to inform more than just cancer detection, and for this purpose they would need members related to specific conditions, e.g. aggressive vs. indolent prostate cancer.22,23 This approach could provide high diagnostic value for directing personalized therapy. Validation needs to be done with large sample cohorts from several sources, and preferably from different parts of the world representing diverse patient compositions. Both of these tasks need to be accomplished almost simultaneously, since clinical validation of diagnostic protein panels without advanced measurement devices or development of the ultimate multiplexed device without validation of diagnostic panels will cause a significant lag in translation to the clinic.
Multiplexed electrochemical detection of proteins
While much innovative research has been directed towards new methods of single protein measurement,3,7,17,24,25 for reasons discussed above, multiplexed protein detection will be necessary to make diagnostic and therapeutic advances in the clinic. Nanomaterials have been used to great advantage in labeling and signal amplification strategies, mostly based on ELISA-like sandwich assays.3,7,21,26–28While a variety of detection methods can be used,3,7,17 electrochemical approaches to POC devices are attractive because of their ability to achieve high sensitivity with relatively simple measurement systems and electronics. Multiplexed electrochemical protein detection has taken advantage of nanoparticles and nanostructures to achieve unprecedented sensitivity and ultralow detection limits. Nanoparticle labels and label carriers, nanostructured electrodes, and magnetic particles have featured heavily in strategies for high sensitivity, and multiplexed protein detection.3,7,29–32 However, many of these studies have focused on single protein detection in buffer, which has uncertain relevance for multiplexed protein detection in serum, urine or saliva.3,27 Clearly, simultaneous measurement of multiple biomarkers in these biological fluids with little or no pre-treatment will be most relevant to cancer diagnosis.
Most electrochemical immunoassays have adapted the features of ELISA (Figure 1). In this sandwich assay approach, primary capture antibodies (Ab1) are attached to sensor elements. Use of nanostructured sensors can increase antibody coverage 10-fold or more compared to flat surfaces, and improves sensitivity and detection limits.3,27,28 In most approaches, sample is introduced to the sensor, and the antibodies selectively capture the analyte protein from the sample. After washing, a labeled secondary antibody (Ab2) is added, which binds selectively to the protein on the sensor. The label, shown in Figure 1 as an enzyme, is then detected electrochemically by using a reactant with an electroactive enzyme product or by activating an enzyme like horseradish peroxidase (HRP) for reduction.27,29–31 To achieve ultrasensitivity (Figure 1) nanoparticles or magnetic beads with hundreds of thousands of antibodies and labels can be used to greatly amplify detection signals. Variations in amplification strategies include nanoparticle labels on secondary antibodies that can be dissolved to yield detectable electroactive ions, nanoparticle labels that are used to later catalyze metal deposition, and substrates for enzyme labels that give a polymer deposit on the sensor.3,29–36 Most electrochemical detection methods utilize amperometry or voltammetry, but some approaches have employed impedance.37
Figure 1.

Illustration of enzyme-linked electrochemical immunosensors using a sandwich assay format showing a nanostructured sensor element using a single enzyme label (path A) or a multi-labeled particle (path B). Primary antibodies (Ab1) on the sensor capture analyte protein from the sample. In the conventional approach (path A), an enzyme-labeled secondary antibody (Ab2) is added to bind to the analyte protein on the sensor. In an ultrasensitive approach (path B), a magnetic bead with hundreds of thousands of antibodies and enzyme labels is added to bind to the analyte protein for signal amplification Addition of an enzyme substrate and electrochemical detection provides signals proportional to the amount of protein in the sample.
Again, accurate, sensitive multiplexed protein measurements are key to widespread clinical applications, and can be achieved now with electrochemical immunosensors. A relatively early example utilized arrays of iridium oxide electrodes separated by 2.5 mm to eliminate cross-talk. These arrays enabled simultaneous electrochemical immunoassays using alkaline phosphatase-labeled Ab2 and detecting an electroactive enzyme reaction product for DLs ~1 ng mL−1 for two IgGs, and cancer biomarkers carcinoembryonic antigen (CEA) and α-fetoprotein (AFP).38 A later 8-electrode array39 built on similar principles simultaneously detected 3 different IgGs and IgY with DLs ~3 ng mL−1. These 8-electrode iridium oxide arrays were fabricated in a 12-well plate40 that simultaneously measured seven cancer biomarkers with DLs of ~2 ng mL−1. The method showed good correlation with ELISA for proteins in serum. However, these detection limits are not good enough to detect normal levels of many biomarker proteins in serum. Reliable diagnostics requires DLs for biomarker protein below normal patient levels and good sensitivity in this range and at elevated levels characteristic of cancer. DLs below pg mL−1 levels and good sensitivity up to hundreds of ng mL−1 will be necessary for most currently known biomarker proteins.
Very high sensitivity and DLs down into the fg mL−1 (attomolar) range have been achieved by multiple label approaches. Ab2-nanoparticle bioconjugates in sandwich immunosensors have included nanoparticle labels that give many electroactive ions to measure when dissolved, Ab2-nanoparticles or magnetic beads with up to a half-million enzyme labels, and Ab2-nanoparticles with multiple small electroactive molecules attached.3,27–34,41–44 Nanostructured sensor surfaces provide an additional sensitivity advantage by enabling immobilization of a large number of capture antibodies,3,45 and by facilitating access of proteins to the antibodies.46 High specific area surfaces for immunoarrays have included carbon nanotube forests,32,34,47–49 gold nanoparticle films,2,50 and electrodeposited nanostructured gold.46,51
Bar code labeling of secondary antibodies can achieve multiplexing without arrays, and has been achieved using a series of nanoparticles or quantum dots (Qdots) yielding different dissolvable metals with different electrodic reduction potentials. For example, cadmium sulfide, copper sulfide, zinc sulfide, and lead sulfide Qdots linked to respective secondary antibodies were used to measure four different proteins.52 The Qdots yield Cd2+, Cu2+, Zn2+ and Pb2+ ions with different redox potentials when dissolved. Each ion codes for a different protein, and were measured at high sensitivity with stripping voltammetry. Multiple metal striped rods, spheres or alloy rods have also been used as labels for multiplexing. When dissolved after the Ab2 binding step, these materials give a series of metal ion stripping peaks, with peak potentials and intensity ratios coding for targeted proteins.41 However, the number of proteins that can be detected by this method is limited by the number of different materials available, and by the resolution of the metal oxidations on the electrochemical potential scale.
Minimization of non-specific binding (NSB) is a critical issue in multiplexed protein immunoassays. NSB includes binding to sensors of any molecule in the sample that interferes with the assay, and labeled-Ab2 or label particles bound to non-antigen sites on the array. NSB is more troublesome in label-free methods such as electrochemical impedance, since any biomolecule that binds to the sensor will influence the signal. However, a recent approach used in an insulin sensor featuring a zwitterionic polymer interface to retard NSB and a novel impedance phase response shows great promise for solving the NSB problem of label-free methods.53
In labeled immunoassays, it is essential to avoid NSB of the labeled-Ab2. NSB can degrade detection limits (DL) and sensitivities, but can be minimized by washing with blocking solutions of bovine serum albumin or casein containing nonionic detergents. Clearly, blocking agents necessitate additional steps, requiring additional complexity in automated microfluidic systems. Covalently attached polyethylene glycol (PEG) or other NSB inhibiting layers on sensor surfaces may also decrease NSB,42,54 but blocking agents may still be required for ultralow DLs.
Research in our laboratory has taken an array approach to multiplexed protein determinations, targeting patient serum and tissue lysates as samples.14,27,28,55 We developed an ultrasensitive electrochemical microfluidic sandwich immunoarray, capturing proteins off-line with 1 μm magnetic beads carrying 400,000 enzyme labels and 120,000 antibodies.55 After the beads capture proteins from the sample, they are magnetically separated, then injected into a microfluidic device featuring 8 nanostructured sensors decorated with a second set of antibodies. In our most ambitious application, we measured a four-protein panel of biomarker proteins, and validated the protein panel for accurate oral cancer diagnostics. By virtue of the massive number of labels associated with each captured protein, ultralow detection limits of 5–50 fg mL−1 were realized for simultaneous detection of IL-6, IL-8, VEGF and VEGF-C in dilute serum in 50 min assays.14 The high sensitivity of the assay allowed for very high dilution of the sample to help minimize NSB, but can also be traded off for shorter assay times.56 Accuracy was confirmed by good correlations with ELISA for the target proteins in a series of conditioned growth media for various cancer cells. Normalized means were calculated from the 4-protein assay levels in 78 oral cancer patient serum samples and 49 controls, and this parameter was analyzed statistically to establish clinical sensitivity of 89% (cancer patients correctly identified) and specificity of 98% (2% false positives) for oral cancer detection. This was significantly better than predictions derived from the single biomarkers. This low cost microfluidic immunoarray is easily fabricated with PDMS molded on conventionally machined molds so that no lithography is required. When combined with commercial pumps and valves, this approach provides a rapid test for diagnosis and personalized therapy. However, it is still too complicated for POC, and requires moderately skilled technical expertise for reliable operation. We will return to the device complexity issue later in this perspective.
Confirming the accuracy of multiplexed protein assays needs to be done for real samples by comparison to a referee method such as ELISA, or some other well-established method.3 A more difficult task is validation of the clinical diagnostic value of the protein panel. This is illustrated by an example: determining IL-6, IL-8, VEGF and VEGF-C by the microfluidic immunoarray described above. We measured these 4 proteins in clinical serum samples from 78 patients with various grades of oral cancer and 49 cancer-free controls. Receiver Operating Characteristic (ROC) plots,57 a standard statistical analysis to assess diagnostic performance, were constructed using MedCalc software (http://www.medcalc.org/index.php). The software generates a series of decision thresholds of the measured parameter (e.g. protein concentration) above which cancer is positive, and below which cancer is negative. For each of these thresholds, the computed sensitivity or true positive rate is plotted against 1-specificity which is the false positive rate. These rates are easily evaluated since the patients have been clinically diagnosed as positive or negative for cancer. Overall diagnostic accuracy of the test is assessed by how close the ROC curve comes to the upper left corner of the plot (Figure 2A). More specifically, diagnostic value is related to the area under the ROC curve (AUC), and the software computes this and other parameters to monitor clinical efficacy. An AUC of 1.0 represents perfect clinical prediction. Figure 2A shows ROC curves for the four individual proteins in our patient samples. We then used a single parameter characteristic of the normalized average of all 4 protein levels. These were obtained by dividing each protein concentration by the standard deviation of levels of that protein in all samples, and averaging. Using this normalized 4-protein mean and the optimized threshold, the ROC plot gave an AUC of 0.96 (Figure 2B), sensitivity 89% and specificity 98%, significantly better than for the single proteins.14 Results demonstrated the ability of the biomarker panel to diagnose both early and late stage oral cancers.
Figure 2.
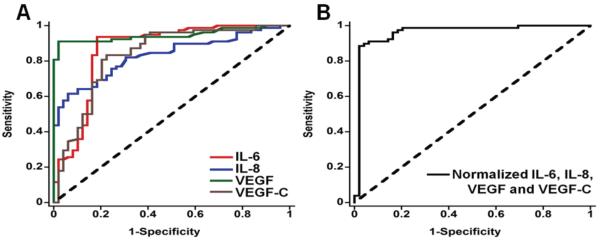
Receiver operating characteristic (ROC) curves for serum assays for (A) IL-6, AUC 0.86 (red line), IL-8 with AUC 0.83 (blue line), VEGF with AUC 0.95 (green line), VEGF-C with AUC 0.83 (brown line), and (B) mean normalized value for all 4 proteins, with AUC 0.96. Reprinted with permission from ref. 14. Copyright 2012 American Chemical Society.
Managing complexity
Clearly, to translate multiple biomarker protein measurements into routine clinical diagnostics for cancer, cost and simplicity of operation are major issues. Here, two systems will be described, analyzed and discussed in light of these issues. The first is the simple modular microfluidic device developed in our laboratory,14,55,56 and second is the integrated mChip for HIV and syphilis testing developed for use in underdeveloped parts of the world.19,21 These devices illustrate two different approaches to clinical testing, and both approaches will benefit to some extent by increased simplicity.
Our multiplexed microfluidic protein detection system in present format is a modular device for ultrasensitive magnetic bead-assisted measurements of up to eight proteins.14,55,56 Inexpensive commercial components are used, in part because they enable the device to be set up in virtually any laboratory. Components currently include a syringe pump, an injector valve, a magnetically stirred and controlled protein capture chamber with switch valves, and a 60 μL microfluidic detection cell housing 8 antibody-decorated electrochemical sensors (Figure 3). The microfluidic detection system is washed with blocking agents, typically detergent and bovine serum albumin (BSA) to inhibit NSB. Sample is injected first into the oval shaped 100 μL protein capture chamber preloaded with multilabeled, antibody-decorated magnetic beads, typically using a single type of bead for each analyte protein. The analyte proteins are captured while flow is stopped for a short incubation period in the stirred capture chamber equipped with a tiny stir bar. An external magnet is used to hold the magnetic beads in the chamber during washing with blocking agents and buffer, and the effluent is sent to waste. When washing is completed, the magnet is removed and a valve is switched to direct the beads to the detection chamber. Flow is stopped when the beads reach that chamber, as indicated by their red-brown color, and another short incubation period is allowed for the antibodies on the sensors to capture beads bearing their respective binding partner proteins. In this approach the sensors are never exposed to the sample, since all sample components except the analyte proteins are washed away before the capture beads are sent to the detection chamber. Thus, possibilities for sample matrix interferences and NSB are minimized. Our label is usually horseradish peroxidase (HPR), and a mixture of H2O2 to activate HRP and hydroquinone as an electron mediator is then injected. The activated HRP labels are reduced by application of a slightly negative potential on the sensors, and current peaks result that are proportional to the concentration of the analyte proteins.14,58 The advantage of this system is low cost, ease of fabrication, relatively short assay times, samples of a few μL of serum, sensitivity down into the low fg mL−1 range, good dynamic range, and low NSB. Highest sensitivity is achieved in 50 min. assays, but sensitivity can be traded for time, so that assays can be done in <10 min. by shortening antibody-antigen incubation times to detect biomarker proteins in clinical ranges. Further, multiple 8-electrode detectors can be arranged in a parallel multiplexed system59 to increase the number of proteins that can be detected. This system is appropriate for research, and can be applied for laboratory-based clinical applications on validated protein panels as well. It has a significant advantage over standard ELISA, which measures one protein at a time and requires ~100 mL serum per protein, and assay times of several hours. However, a stumbling block to POC or on-site clinical use is that some degree of technical expertise is needed to operate and trouble-shoot the system. In addition, washing steps pose a practical problem since washing and detection solutions need to be prepared and introduced into the device by the operator. In addition, blood needs to be converted to serum and proteins in tissue must be released into buffer before analysis.
Figure 3.

Modular microfluidic immunoarray featuring on-line protein capture on magnetic beads. Upper left picture (B) shows stirred, magnetically controlled, reaction chamber where target proteins are captured on-line from samples by heavily-labeled HRP-antibody-magnetic beads to form antigen-bead bioconjugates, which are washed with magnet in place, then transferred by flow after magnet removal into detection chamber in assembled system at the bottom (A). Upper right (C) shows the microfluidic detection chamber featuring eight-sensor immunoarray in a 63 μL channel where bead flow can be controlled by a magnet (D).
The mChip uses an alternative approach that integrates recent advances in microfluidic technology to offer POC applications. The focus here is on the mChip designed for detecting HIV and syphilis via measuring levels of antibodies characteristic of exposure to the disease causative agents.19 The approach is based on an ELISA-like sandwich assay, and uses catalytic deposition of a silver precipitate on gold nanoparticle labeled Ab2 for optical detection. On-line blood sample separation and reagent delivery render the mChip appropriate for POC use in underdeveloped countries, and this method can be envisioned for cancer biomarker protein detection with some modifications. The device was manufactured by injection molding at a cost of about $0.10 per unit. Essential features of the mChip are illustrated in Figure 4. In addition to low fabrication cost, ability to analyze whole blood is a big asset for POC.
Figure 4.

Integrated mChip microfluidic device made by injection molding, including data on fluid handling of a POC ELISA-like assay for two antibodies: (a) Picture of microfluidic chip. Each chip can accommodate seven samples (one per channel), with molded holes for coupling of reagent-loaded tubes. (b) Scanning electron microscope image of a cross-section of microchannels, made of injection-molded plastic. Scale bar, 500 μm. (c) Transmitted light micrograph of channel meanders. Scale bar, 1 mm. (d) Schematic diagram of passive delivery of multiple reagents, which requires no moving parts on-chip. A preloaded sequence of reagents passes over a series of four detection zones, each characterized by dense meanders coated with capture proteins, before exiting the chip to a disposable syringe used to generate a vacuum for fluid actuation. (e) Illustration of biochemical reactions in detection zones at different immunoassay steps. The reduction of silver ions on gold nanoparticle–conjugated antibodies yields signals that can be read with low-cost optics (for quantification) or examined by eye. (f) Absorbance traces of a complete HIV-syphilis duplex test as reagent plugs pass through detection zones. High optical density (OD) is observed when air spacers pass through the detection zones, owing to increased refraction of light compared to in the liquid-filled channels. The train of reagents mimics the pipetting of reagents in and out of multiwell plates. This sample was evaluated (correctly against a reference standard) as HIV negative and syphilis positive. Ag = antigen. Reproduced with permission from ref. 19; Copyright © 2011, Nature Publishing Group.
A second important feature is automated reagent addition. Here the authors use a method reported in 2006,60 but implemented for the first time into the fully integrated mChip device. The required reagents and wash solutions are pre-loaded into mChip with air spaces between each solution (Figure 4d). Passive delivery is achieved by a downstream disposable syringe, which creates a vacuum to draw reagents into device. The secondary antibodies in the sandwich assays are labeled with gold nanoparticles that catalyze reduction of silver ions in meandering channels, allowing inexpensive photodiodes and photodetector to be used for optical detection. Results for the HIV and syphilis detection performed in a clinic in rural Rwanda compared well to laboratory based assays.19 Advantages of the mChip are low cost, relatively short assays (~20 min), and nearly operator free performance. However, the device must be manufactured by injection molding, so for universal access it needs to be commercialized. Detection limits are considerably larger than those of the system in Figure 3, while remaining in the clinical range for the application considered. Expandability to a larger number of proteins will require changes in design of the mChip cassette. Reagent addition still presents problems since the air-separated reagent column will not have an extended lifetime after loading into the chip. In the HIV/syphilis mChip, reagents were loaded by local workers close to the time of assay, or can be loaded with robots.19 Neither is ideal for truly inexpensive, technically simple POC assays.
Moving on to the clinic
As discussed above, a number of approaches for multiple protein analyses have been developed that can achieve both clinical range and ultrasensitive assays in times appropriate for POC. Clearly, detection limits below 1 fg mL−1 may be important for future applications. However, adequate sensitivity at or below levels of clinically relevant detection is available now for biomarker proteins of currently known value. Multiplexing beyond 2–4 proteins for biomedical samples remains problematic, but is not insurmountable to good engineering solutions. One approach related to the example in Figure 3 is to use multiple parallel detection devices,59 but a drawback is additional complexity and the necessity to partition patient samples. Clearly a system with all sensors on the same chip is preferable.
Two examples were discussed above to illustrate problems in moving POC devices for protein detection into the cancer clinic. From these case studies, major issues emerge that include multiplexing, reagent addition, availability (i.e. commercialization), and sensitivity to a lesser extent. Imaginative system designs are needed to overcome these issues.
Reagent addition and washing seems to be a larger stumbling block. While an air-separated reagent cascade approach is viable in mChip (Figure 4) for dual antibody detection,19 and can be adapted to other systems, loading reagents is labor intensive or requires a robot, both of which defeat considerations of cost and automation. Some bioanalytical devices aimed at commercial applications utilize dry reagents,21 but this can add complexity in terms of valves and stirrers, and may introduce quality control and reproducibility issues. Clearly, minimizing reagent use and washing steps is a usable strategy, but may compromise sensitivity and reproducibility. Are there other, better ways to proceed? Perhaps time will tell. While several microfluidic approaches for protein detection are clearly approaching suitability for protein-based diagnostics at POC, significant engineering advances, particularly in reagent addition and multiplexing, are likely to speed translation to the cancer clinic. While electrochemical methods were emphasized here, other detection approaches compatible with simplicity, adequate sensitivity, low cost, and the required multiplexing may prove to be competitive.
How will these yet to be perfected (or commercialized) protein detection devices be used in the future? If a specific cancer is suspected, a physician might order a test using a protein panel that has been validated for that cancer. If the test is positive, subsequent therapy can be monitored with the test panel. However, for general screening for a range of cancers, devices that monitor 50 to 100 proteins might be required. These proteins could, for example, encompass validated protein panels for the 10 most frequently encountered cancers. On board data analysis is needed to interpret results and deliver test-based diagnoses to the clinician. The cost per assay must remain low, or the device will not be widely used. This represents a future grand challenge integrating bioanalytical chemistry, engineering, and information technology.
Acknowledgment
The author's research describe herein, and preparation of this article, are supported by Grant No. EB014586 from the National Institute of Biomedical Imaging and Bioengineering (NIBIB), NIH. The author is grateful to coauthors of joint publications whose excellent contributions have helped drive our progress in biomarker protein detection.
References
- 1.Atkinson AJ, Colburn WA, DeGruttola VG, et al. Clin. Pharmacol. Ther. 2001;69:89–95. [Google Scholar]
- 2.Manne U, Srivastava RG, Srivastava S. Drug. Discov. Today. 2005;10:965–976. doi: 10.1016/S1359-6446(05)03487-2. [DOI] [PubMed] [Google Scholar]
- 3.Rusling JF, Kumar CV, Gutkind JS, Patel V. Analyst. 2010;135:2496–2511. doi: 10.1039/c0an00204f. [DOI] [PMC free article] [PubMed] [Google Scholar]
- 4.Ludwig JA, Weinstein JN. Nature Rev. Cancer. 2005;5:845–856. doi: 10.1038/nrc1739. [DOI] [PubMed] [Google Scholar]
- 5.Kulasingam V, Diamandis EP. Nature Clin. Pract. Oncol. 2008;5:588–599. doi: 10.1038/ncponc1187. [DOI] [PubMed] [Google Scholar]
- 6.Hanash SM, Pitteri SJ, Faca VM. Nature. 2008;452:571–579. doi: 10.1038/nature06916. [DOI] [PubMed] [Google Scholar]
- 7.Giljohan DA, Mirkin CA. Nature. 2009;462:461–464. doi: 10.1038/nature08605. [DOI] [PMC free article] [PubMed] [Google Scholar]
- 8.Hanash SM, Baik CS, Kallioniemi O. Nature Rev. Clin. Oncol. 2011;8:142–150. doi: 10.1038/nrclinonc.2010.220. [DOI] [PubMed] [Google Scholar]
- 9.Smith RA, Cokkinides V, Brawley OW. CA: Cancer J. Clin. 2008;58:161–179. doi: 10.3322/CA.2007.0017. [DOI] [PubMed] [Google Scholar]
- 10.Ward MA, Catto JWF, Hamdy FC. Ann. Clin. Biochem. 2001;38:633–651. doi: 10.1258/0004563011901055. [DOI] [PubMed] [Google Scholar]
- 11.Kattan MW. J. Natl. Cancer Inst. 2003;95:634–635. doi: 10.1093/jnci/95.9.634. [DOI] [PubMed] [Google Scholar]
- 12.Wagner PD, Verma M, Srivastava S. Ann. N. Y. Acad. Sci. 2004;1022:9–16. doi: 10.1196/annals.1318.003. [DOI] [PubMed] [Google Scholar]
- 13.Li J, Zhang Z, Rosenzweig J, et al. Clin. Chem. 2002;48:1296–1304. [PubMed] [Google Scholar]
- 14.Malhotra R, Patel V, Chikkaveeraiah BV, Munge BS, Cheong SC, Zain RB, Abraham MT, Dey DK, Gutkind JS, Rusling JF. Anal. Chem. 2012;84:6249–6255. doi: 10.1021/ac301392g. [DOI] [PMC free article] [PubMed] [Google Scholar]
- 15.Riedel F, Zaiss I, Herzog D, Götte K, Naim R, Hörman K. Anticancer Res. 2005;25:2761–2766. [PubMed] [Google Scholar]
- 16.Albumin - serum: MedlinePlus Medical Encyclopedia. Nlm.nih.gov. Retrieved 2010-05-12.
- 17.Kingsmore SF. Nature Rev. Drug Discov. 2006;5:310–320. doi: 10.1038/nrd2006. [DOI] [PMC free article] [PubMed] [Google Scholar]
- 18.Lin C-C, Wang J-H, Wu H-W, Lee G-B. J. Lab. Automat. 2010;15:253–274. [Google Scholar]
- 19.Chin CD, Laksanasopin T, Cheung YK, Steinmiller D, Linder V, et al. Nature Med. 2011;17:1015–1019. doi: 10.1038/nm.2408. [DOI] [PubMed] [Google Scholar]
- 20.Gubala V, Harris LF, Ricco AJ, Tan MX, Williams DE. Anal. Chem. 2012;84:487–515. doi: 10.1021/ac2030199. [DOI] [PubMed] [Google Scholar]
- 21.Chin CD, Linder V, Sia SK. Lab Chip. 2012;12:2118–2134. doi: 10.1039/c2lc21204h. [DOI] [PubMed] [Google Scholar]
- 22.Kumar-Sinha C, Tomlins SA, Chinnaiyan AM. Nature Rev.: Cancer. 2008;8:497–511. doi: 10.1038/nrc2402. [DOI] [PMC free article] [PubMed] [Google Scholar]
- 23.Xu J, Zheng SL, Isaacs SD, et al. Proc. Nat. Acad. Sci. 2010;107:2136–2140. doi: 10.1073/pnas.0914061107. [DOI] [PMC free article] [PubMed] [Google Scholar]
- 24.Rasooly A, Jacobson J. Biosens. Bioelectron. 2006;21:1851–1858. doi: 10.1016/j.bios.2006.01.003. [DOI] [PubMed] [Google Scholar]
- 25.Tothill IE. Seminars Cell Dev. Biol. 2009;20:55–62. doi: 10.1016/j.semcdb.2009.01.015. [DOI] [PubMed] [Google Scholar]
- 26.Choi Y-E, Kwak J-W, Park JW. Sensors. 2010;10:428–455. doi: 10.3390/s100100428. [DOI] [PMC free article] [PubMed] [Google Scholar]
- 27.Rusling JF, Munge BS, Sardesai NP, Malhotra R, Chikkaveeraiah BV. In: Nanobioelectrochemistry. Crespilho Frank., editor. Springer; Berlin- Heidelberg: 2012. pp. 1–26. [Google Scholar]
- 28.Rusling JF. Chem. Record. 2012;12:164–176. doi: 10.1002/tcr.201100034. [DOI] [PMC free article] [PubMed] [Google Scholar]
- 29.Wang J. Analyst. 2005;130:421–426. doi: 10.1039/b414248a. [DOI] [PubMed] [Google Scholar]
- 30.Wang J, Katz E, Willner I. In: Bioelectronics. Katz E, Willner I, editors. Wiley-VCH; 2005. pp. 231–264. [Google Scholar]
- 31.Wang J. Biosens. Bioelectron. 2006;21:1887–1892. doi: 10.1016/j.bios.2005.10.027. [DOI] [PubMed] [Google Scholar]
- 32.Chikkaveeraiah BV, Bhirde AA, Morgan NY, Eden HS, Chen X. ACS Nano. 2012;6:6546–6561. doi: 10.1021/nn3023969. [DOI] [PMC free article] [PubMed] [Google Scholar]
- 33.Wang J. Small. 2005;1:1036–1043. doi: 10.1002/smll.200500214. [DOI] [PubMed] [Google Scholar]
- 34.Rusling JF, Yu X, Munge BS, Kim SN, Papadimitrakopoulos F. Engineering the Bioelectronic Interface. In: Davis J, editor. Royal Soc. Chem. UK. 2009. pp. 94–118. [Google Scholar]
- 35.Yánez-Sedeno P, Riu J, Pingarrón JM, Rius FX. Trends Anal. Chem. 2010;29:939–953. [Google Scholar]
- 36.Willner I, Willner B. NanoLett. 2010;10:3805–3815. doi: 10.1021/nl102083j. [DOI] [PubMed] [Google Scholar]
- 37.Tkac J, Davis JJ. Engineering the Bioelectronic Interface. In: Davis JJ, editor. Royal Soc. Chem. UK. 2009. pp. 193–224. [Google Scholar]
- 38.Wilson MS. Anal. Chem. 2005;77:1496–1502. doi: 10.1021/ac0485278. [DOI] [PubMed] [Google Scholar]
- 39.Wilson MS, Nie W. Anal. Chem. 2006;78:2507–2513. doi: 10.1021/ac0518452. [DOI] [PubMed] [Google Scholar]
- 40.Wilson MS, Nie W. Anal. Chem. 2006;78:6476–6483. doi: 10.1021/ac060843u. [DOI] [PubMed] [Google Scholar]
- 41.Wang J. Electroanalysis. 2007;19:769–776. [Google Scholar]
- 42.Veetil JV, Ye K. Biotechnol. Prog. 2007;23:517–531. doi: 10.1021/bp0602395. [DOI] [PubMed] [Google Scholar]
- 43.Luo X, Morrin A, Killard AJ, Smyth MR. Electroanalysis. 2006;18:319–326. [Google Scholar]
- 44.Zhang H, Zhao Q, Li X-F, Le XC. Analyst. 2007;132:724–737. doi: 10.1039/b704256f. [DOI] [PubMed] [Google Scholar]
- 45.Malhotra R, Papadimitrakopoulos F, Rusling JF. Langmuir. 2010;26:15050–15056. doi: 10.1021/la102306z. [DOI] [PMC free article] [PubMed] [Google Scholar]
- 46.Das J, Kelley SO. Anal. Chem. 2011;83:1167–1172. doi: 10.1021/ac102917f. [DOI] [PubMed] [Google Scholar]
- 47.Kim SN, Rusling JF, Papadimitrakopoulos F. Adv. Materials. 2007;19:3214–3228. doi: 10.1002/adma.200700665. [DOI] [PMC free article] [PubMed] [Google Scholar]
- 48.Zhao YL, Stoddart JF. Acc. Chem. Res. 2009;42:1161–1171. doi: 10.1021/ar900056z. [DOI] [PubMed] [Google Scholar]
- 49.Jacobs CB, Peairs MJ, Venton BJ. Anal. Chim. Acta. 2010;662:105–127. doi: 10.1016/j.aca.2010.01.009. [DOI] [PubMed] [Google Scholar]
- 50.Mani V, Chikkaveeraiah BV, Patel V, Gutkind JS, Rusling JF. ACSNano. 2009;3:585–594. doi: 10.1021/nn800863w. [DOI] [PMC free article] [PubMed] [Google Scholar]
- 51.Soleymani L, Fang Z, Sargent EH, Kelley SO. Nature Nanotech. 2009;4:844–848. doi: 10.1038/nnano.2009.276. [DOI] [PubMed] [Google Scholar]
- 52.Liu G, Wang J, Kim J, Jan M, Collins G. Anal. Chem. 2004;76:7126–7130. doi: 10.1021/ac049107l. [DOI] [PubMed] [Google Scholar]
- 53.Luo X, Xu M, Freeman C, James T, Davis JJ. Anal. Chem. 2013;85:4129–4134. doi: 10.1021/ac4002657. [DOI] [PubMed] [Google Scholar]
- 54.Yakovleva J, Emneus J. In: Handbook of Bioelectrochemistry. Bartlett PN, editor. John Wiley; N. Y.: 2008. pp. 377–410. [Google Scholar]
- 55.Chikkaveeraiah BV, Mani V, Patel V, Gutkind JS, Rusling JF, Bhaskara V. Biosens. & Bioelectron. 2011;26:4477–4483. doi: 10.1016/j.bios.2011.05.005. [DOI] [PMC free article] [PubMed] [Google Scholar]
- 56.Krause CE, Otieno BA, Latus A, Faria RC, Patel V, Gutkind JS, Rusling JF. ChemistryOpen. 2013 doi: 10.1002/open.201300018. submitted. [DOI] [PMC free article] [PubMed] [Google Scholar]
- 57.Zweig MH, Campbell G. Clin. Chem. 1993;39:561–577. [PubMed] [Google Scholar]
- 58.Otieno BA, Krause CE, Latus A, Chikkaveeraiah BV, Faria RC, Rusling JF. Biosens. & Bioelectron. 2013 doi: 10.1016/j.bios.2013.09.054. work in progress. [DOI] [PMC free article] [PubMed] [Google Scholar]
- 59.Wasalathanthri DP, Faria RC, Malla S, Joshi AA, Schenkman JB, Rusling JF. Analyst. 2013;138:171–178. doi: 10.1039/c2an35993f. [DOI] [PMC free article] [PubMed] [Google Scholar]
- 60.Linder V, Sia SK, Whitesides GM. Anal. Chem. 2005;77:64–71. doi: 10.1021/ac049071x. [DOI] [PubMed] [Google Scholar]