Abstract
The first advanced Bronze Age civilization of Europe was established by the Minoans about 5,000 years before present. Since Sir Arthur Evans exposed the Minoan civic centre of Knossos, archaeologists have speculated on the origin of the founders of the civilization. Evans proposed a North African origin; Cycladic, Balkan, Anatolian and Middle Eastern origins have also been proposed. Here we address the question of the origin of the Minoans by analysing mitochondrial DNA from Minoan osseous remains from a cave ossuary in the Lassithi plateau of Crete dated 4,400–3,700 years before present. Shared haplotypes, principal component and pairwise distance analyses refute the Evans North African hypothesis. Minoans show the strongest relationships with Neolithic and modern European populations and with the modern inhabitants of the Lassithi plateau. Our data are compatible with the hypothesis of an autochthonous development of the Minoan civilization by the descendants of the Neolithic settlers of the island.
 5,000 years ago, the Minoans established the first advanced civilization of Europe, but their origin remains unclear. Here the authors show that the Minoans were a European population, genetically similar to other ancient European populations and to the present inhabitants of the island of Crete.
The first Neolithic humans reached Crete about 9,000 years before present (YBP)1,2, coinciding with the development and adoption of the agricultural practices in the Near East and the extensive Neolithic population diffusion (8,000–9,500 YBP) that brought farming to Europe3. The most likely origins of these Neolithic settlers were the nearest coasts, either the Peloponnese or south-western Anatolia4,5,6. These humans established the first major European civilization on the island of Crete at the beginning of the Early Bronze Age7. Sir Arthur Evans, named the people who built this civilization ‘Minoans’ after the legendary Minos, the King of Knossos. Evans also suggested that the founders of the Minoan civilization were refugees from the Delta region of Egypt when North Egypt was conquered by the Southern king Narmer (Menes of ancient historians) at about 5,000 YBP7,8; his evidence were the similarities between Minoan and Egyptian art and elements he was considering Libyan in origin, such as the cod piece worn by Bronze Age Cretans and the circular tombs of the early inhabitants of Southern Crete that were similar to tombs built by the Libyans7,8. Based on a variety of archaeological finds, other archaeologists have argued for Cycladic9, Anatolian9,10, Syrian or Palestinian11,12 migrations or for an autochthonous development of the Minoan civilization from the initial inhabitants of Crete13. Attempts to infer ancient ancestry of the Bronze Age Cretans using Y-chromosomal or mitochondrial DNA (mtDNA) studies of the modern Cretan populations have yielded conflicting results, supporting Balkan14, Anatolian15, or Middle Eastern and Balkan16 origins.
In this study, we address the question of the origin of the Minoans by comparing Minoan mtDNA polymorphisms with those of 135 modern and ancient populations. We study skeletal remains from two Minoan populations, one in central Crete, the other in southern Crete. Following the application of a series of strict authentication criteria, we use for our comparisons the DNAs of only 37 Minoans whose remains were well preserved in a cave ossuary located in the Lassithi plateau of east-central Crete. We determine mtDNA polymorphisms using two different methods applied in two different laboratories. Our calculations of genetic distances, haplotype sharing and principal component analysis (PCA) exclude a North African origin of the Minoans. Instead, we find that the highest genetic affinity of the Minoans is with Neolithic and modern European populations. We conclude that the most likely origin of the Minoans is the Neolithic population that migrated to Europe about 9,000 YBP. We propose that the Minoan civilization most likely was developed by the autochthonous population of the Bronze Age Crete.
Results
The Minoan populations
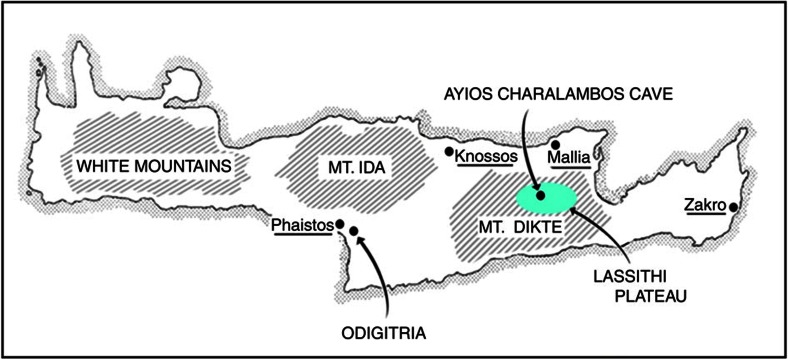
To address the question of the origin of the Minoans, we analysed mtDNA polymorphisms in skeletal materials from two Minoan populations. The first population consisted of osseous remains of 39 individuals from an excavation of pre-palatial tholos tombs near the Odigitria monastery in southern Crete (Fig. 1); Odigitria is located close to the Minoan palace of Phaistos near the coast of south-central Crete. There was continuous use of these tholos tombs from the Early Minoan period I (~4900 YBP) to the Middle Minoan period IB (~3900 YBP)17. The second population consisted of the osseous remains of 69 individuals from a cave in the Lassithi plateau in east-central Crete near the village of Ayios Charalambos18. Lassithi plateau is located in the Diktaian mountain range south-east of the major Minoan civic centre of Knossos (Fig. 1). The plateau has been inhabited continuously since the Late Neolithic and its population reached an apex in Middle Minoan period II (~3800 YBP)19; because of its geography, the plateau likely served as a refugium14. The Ayios Charalambos cave was used as an ossuary from the late neolithic to the Middle Minoan IIB with a most likely period of the majority of the deposits during the Middle Minoan IIB (~3700 YBP). The cave was sealed for several centuries and it was accidentally discovered during road construction in 1976. Because of the low temperatures inside the cave, the osseous remains were preserved in excellent condition18.
Figure 1. Locations of the Ayios Charalambos cave and of the Odigitria Tholos tombs.
The Odigitria tombs are located in the broader area of the Minoan palace of Phaistos in southern Crete. The Ayios Charalambos cave is located in the Lassithi plateau in central Crete south of the major Minoan civic centre of Knossos and the palace of Mallia.
Authentication of ancient DNA samples
Authentication of molecular archaeological results necessitates compliance with ancient DNA criteria20. Strict authentication criteria were used in our study. DNA extracts from all 39 individuals from the Odigitria tholos tombs failed authentication tests, including racemization results, which suggested poor preservational history. Of the 69 Minoans from the Lassithi cave, 32 were excluded for various technical reasons, including the absence of HVS-1 sequences in the DNA fragments submitted to next-generation sequencing (Supplementary Table S1). The authenticated sequences from 37 individuals (Supplementary Tables S2 and S3) determined independently by two methodologies in two different laboratories were used for the analyses described below.
Comparisons of Minoans with North African populations
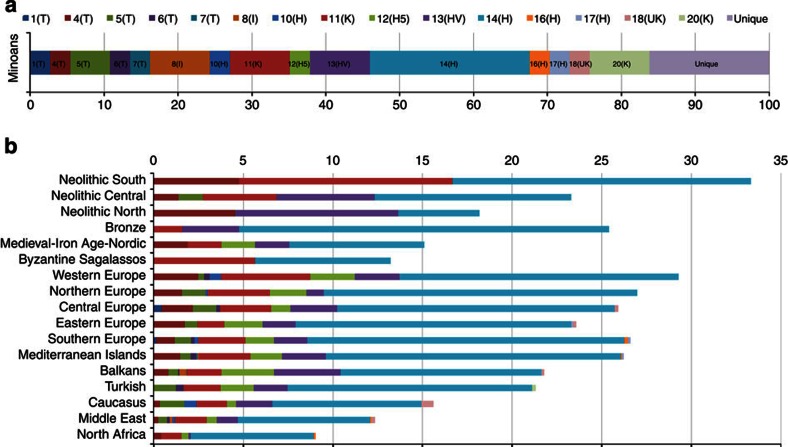
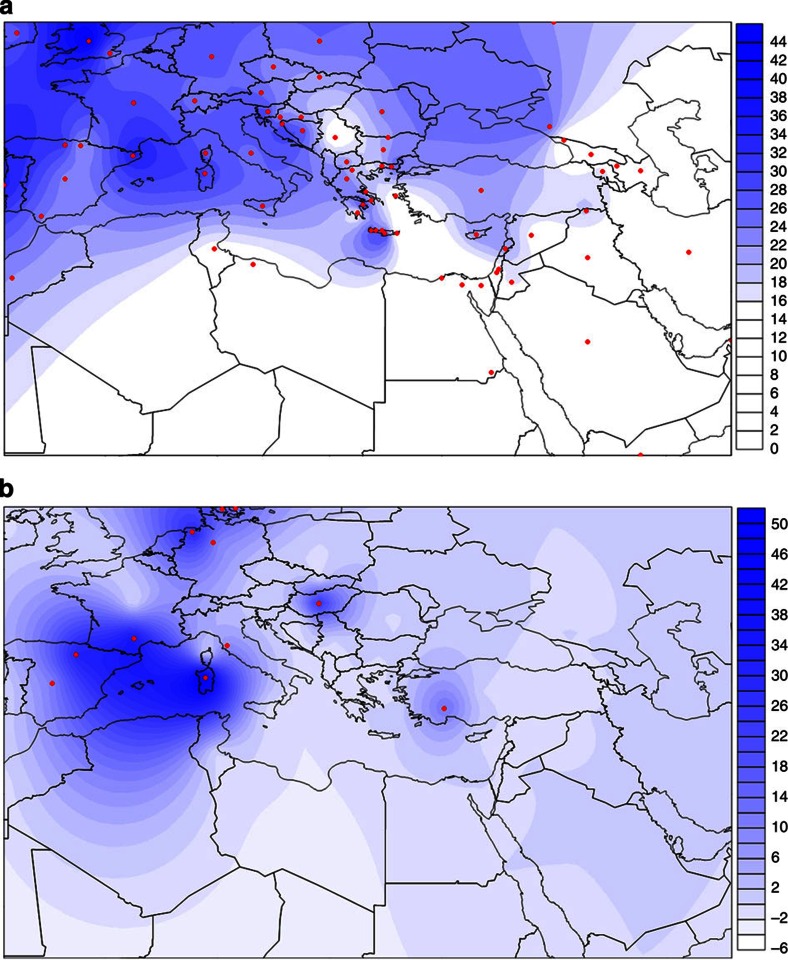
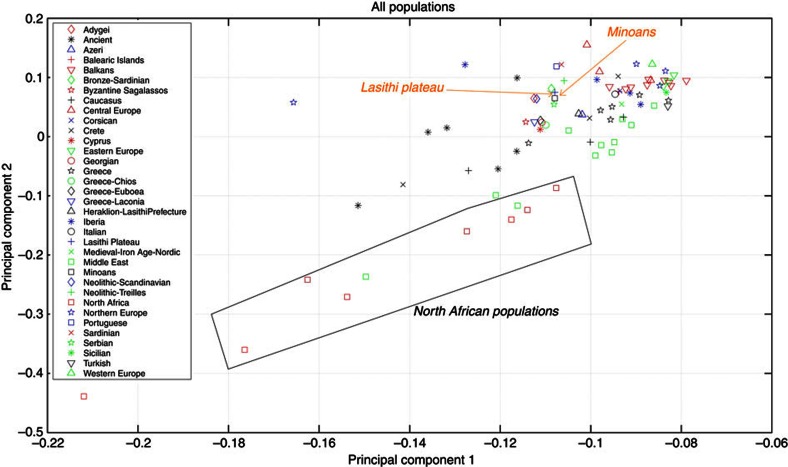
A data set containing HVS-1 sequences of 135 modern and ancient populations was used for comparisons with the sequences of the Minoans (Supplementary Table S4). For several statistical analyses, the modern populations were grouped to 71 geographic or ethnic groups (Supplementary Table S4). Twenty-one distinct Minoan mtDNA haplotypes were observed, six were unique to the Minoans and fifteen were shared with modern and ancient populations (Fig. 2). None of the Minoans carried the characteristic African mtDNA haplotypes of the L haplogroup (Supplementary Table S2). Furthermore, calculations of the average pairwise genetic distances (Supplementary Table S5) illustrate the great genetic distance between the Minoans and the Egyptian, the Libyan and the other North African populations (Table 1). Figure 3a shows graphically in the form of geographic density maps the shared mtDNA lineages between the Minoans and 71 extant population groups. Notice that the Minoans displayed the least sharing of haplotypes with North Africans. Figures 2b and 4 present the percentages of sharing between the Minoan mtDNA haplotypes with various population groups; notice again that the least frequencies of sharing are with North African populations. PCA also demonstrates that the Minoans are clearly distanced from the Egyptian, Libyan and North African populations (Fig. 5, Supplementary Table S6). These data strongly argue against the Evans hypothesis of Egyptian or Libyan origin of the founders of the Minoan civilization. The North African influence on the Minoan civilization was most likely accomplished through cultural exchange.
Figure 2. Minoan mtDNA haplotypes in extant and ancient populations.
(a) Minoan mtDNA HVS-1 haplotypes shared with the modern or ancient populations. (b) Frequency distribution of the 15 shared Minoan haplotypes among the various modern and ancient population groups.
Table 1. The top 10 and bottom 10 nearest neighbours to the Minoans.
| Top 10 nearest neighbours to Minoans | Pairwise differences | Bottom 10 nearest neighbours to the Minoans | Pairwise differences |
|---|---|---|---|
| Sardinians-Bronze | 2.89 | Iranian | 5.46 |
| Iberians-Bronze | 3.29 | Libyan | 5.50 |
| Portuguese | 3.85 | Tunisia Coast | 5.70 |
| Neolithic-Scand | 3.90 | Egypt-Alexandria | 5.73 |
| German | 3.97 | Dubai | 5.76 |
| Corsican | 3.98 | Saudi | 5.92 |
| Neolithic-Treilles | 4.00 | Yemenite | 6.21 |
| Irish | 4.05 | Egypt | 7.04 |
| Catalan | 4.06 | Nubia | 7.09 |
| French | 4.12 | South Sudanese | 7.82 |
Pairwise genetic distances between Minoans and modern or ancient populations calculated using Arlequin v3.5.1.2.
Figure 3. Geographic density maps of shared mtDNA lineages.
The blue gradient represents the percentage of shared lineages, with the higher percentages represented in blue and the lower in white. The red dots indicate the origin of each of the 71 modern population groups and the 11 ancient populations that were included in our analysis. (a) mtDNA HVS-1 lineages shared between Minoans and 71 extant population groups; (b) lineages shared with 11 Bronze Age, Iron Age and Neolithic populations.
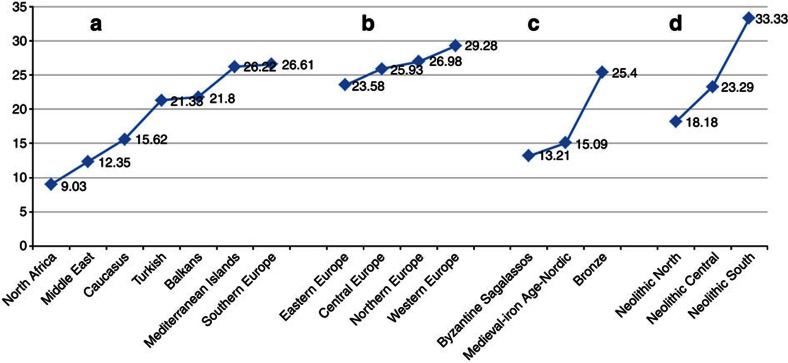
Figure 4. Sharing of Minoan haplotypes with modern and ancient populations.
The y axis represents per cent sharing. Notice, in (a) the low frequency of sharing with the North African population (9%) and in (b) the gradual increase of sharing from the Middle East to Southern and Western Europe. c shows sharing with Iron Age and Bronze Age European populations and d shows sharing with Neolithic European populations. Notice that the highest frequency of sharing (33%) is with the Neolithic populations of Southern Europe.
Figure 5. Principal component analysis.
Projection on top two principal components of 71 extant population groups in comparison to the Minoans. The top 15 nearest neighbours to the Minoans are shown in the figure and legend with individual symbols. The remaining populations are marked using broad geographic labels; for example, all North African populations are marked with the same red square symbol. Notice the genetic distance between the Minoans and the North African populations and the similarity between the Minoans and the population of Lassithi plateau.
Genetic affinity with Neolithic and modern European populations
The Minoan mtDNA haplotypes resembled those of the European populations (Figs 2b, 3a and 4; Supplementary Figs S1–S3). The majority of Minoans were classified in haplogroups H (43.2%), T (18.9%), K (16.2%) and I (8.1%). Haplogroups U5A, W, J2, U, X and J were each identified in a single individual. The greatest percentage of shared Minoan haplotypes was observed with European populations, particularly with individuals from Northern and Western Europe (26.98% and 29.28%, respectively) (Figs 2, 3, 4; Supplementary Table S7). Notably, in Fig. 4, a gradient can be observed, with the lowest affinity for Minoans found with Northern African populations and the percentage of haplotype sharing increasing as we move through the Middle East, Caucasus and the Mediterranean islands, southern Europe and mainland Europe (Fig. 4a). Of notice also is the high percentage of haplotype sharing with Bronze Age (Fig. 4c) and Neolithic (Fig. 4d) European populations.
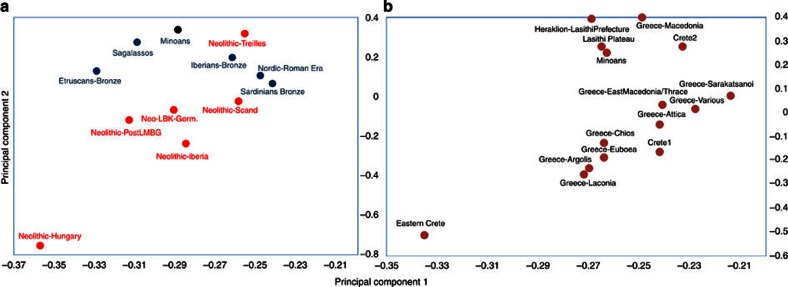
To apply PCA, each population was summarized by a frequency vector, depicting the frequency of each allele at each of the studied loci of the HVS-1 sequence. Pairwise distances between studied populations were computed based on the frequency vectors (using the standard L1 metric to measure distances between distributions), and the singular value decomposition of the resulting distance matrix was computed. The first two principal components capture >98% of the variation in the data and were deemed significant. Figure 5 illustrates the close relationship between the Minoans and the modern European populations. Importantly, three of the top ten nearest neighbours to the Minoans are ancient (two Neolithic and one Bronze Age) populations (Figs 5 and 6a, Table 1 and Supplementary Table S6). In fact, the highest percentage of Minoan haplotype sharing (33.33%) is observed with Neolithic populations from Southern Europe (including samples from Neolithic sites of Treilles and Iberia) (Fig. 4d).
Figure 6. Relationships between the Minoans and other European populations.
(a) The ancient European populations and (b) the modern Greek populations. Notice in b the close relationship to the inhabitants of the Lassithi plateau.
Discussion
Our results strongly suggest that the principal matrilineal genetic relationships of the Minoans are with Neolithic, ancient and modern European populations. Such findings are in support of the hypothesis of an autochthonous origin of the Minoan civilization by the descendants of the Neolithic settlers of the island4,13. As it has been proposed for the other Neolithic European populations21,22,23, the most likely origin of the Cretan Neolithic settlers was Anatolia and the Middle East4,7,9,10,11. Given that the timing of the first Neolithic inhabitants to reach Crete 9,000 YBP coincides with the migration of Neolithic farmers out of Anatolia3, it is highly probable that the same ancestral population that spread to Europe, also spread to Crete and contributed to the founding of the early Minoan civilization. It has been suggested24 that in addition to agricultural methods, the Anatolian farmers also brought with them the Indo-European language25,26. The current prevailing hypothesis is that the Minoan language was unrelated to the Indo-European family. Alternatively, as suggested by Renfrew5, Proto-Minoan was one of the branches derived from the Proto-Indo-European language about 9,000 YBP.
The PCA analysis also highlights the high affinity of the Minoans to the current inhabitants of the Lassithi plateau as well as Greece. Among the top 10 nearest neighbours to our Minoan population sample, four are Greek populations and two of these from Lassithi prefecture (Fig. 5). The close relationship of the Minoans to modern Cretans is also apparent, when analysis is restricted to populations originating from Greece (Fig. 6b). Particularly in respect to the first PCA (capturing 92% of the variance of this particular subset of the data), the Minoans are extremely close to the modern Lassithi population, the populations from the islands of Chios and Euboea, as well as the populations of Argolis and Lakonia (Southern Greece ) (Fig. 6b). Thus, the modern inhabitants of the Lassithi plateau still carry the maternal genetic signatures of their ancient predecessors of the Minoan population.
Methods
Authentication
This study validated its results through the application of fifteen criteria. The DNA was extracted from tooth powders and DNA libraries were prepared in two independent laboratories in different locations at the University of Washington by different personnel. All DNA extractions and amplification preparations were carried out in physically isolated work areas in flow hoods exclusively dedicated to the study of ancient DNA. The extraction of DNA from teeth for next-generation genome sequencing was performed at the University of Washington in a separate building and by different personnel from the HVS-1 analysis. The samples were processed in a newly built laboratory facility that was restricted for use solely for the Minoan tooth materials. The DNA extracts were maintained in a dedicated, bleach-treated freezer in a separate wing of the building from the PCR or the Illumina machines. Multiple blank extractions were processed in parallel and negative controls were included in all reactions. Positive controls were excluded from extractions and amplifications to avoid the introduction of modern competitor DNA. The DNA samples were tested for appropriate molecular behaviour27. HVS-1 results were confirmed on a second tooth from the same individual. Small overlapping targets were amplified. PCR products were cloned to determine the ratio of endogenous-to-exogenous sequences. Amino-acid racemization28 and concentration ratios29 were determined in duplicate on a large subset of the samples. PCR copy number was estimated using real-time PCR methods. Protective surgical clothing and mask were worn during the handling and extraction of materials. Equipment, sand paper and tubes were illuminated with UV for 3 hours before each use. All commercial reagents (Taq Polymerase, primers, water and buffers) were screened for modern DNA before use.
DNA extracts were screened with primers L16055-H16379, using the parameters outlined above to assess appropriate molecular behaviour. None of the ancient DNA samples reported here amplified when screened with the L16055-H16379 primer pair, indicating the absence of intact modern competitor DNA20,27. Biochemical preservation of teeth was determined using amino-acid analysis by MicroAnalytica LLC on 15 of the original 52 samples from Ayios Charalambos that amplified through HVS-1 primers and 39 of 39 samples from Odigitria. Racemization results for aspartic acid ranged from 0.057 to 0.103 (average=0.08) and for alanine from 0.004 to 0.011 (average=0.0076) for individuals from Ayios Charalambos. Concentration ratios were proportional to published and modern reference standards. For Asp/Glu, they ranged from 0.65 to 0.79 (average=0.71), Ser/Glu 0.44–0.47 (average=0.45) and Ala/Glu 1.56–1.71 (average=1.63). Racemic results were consistent with specimens from which ancient DNA has been successfully recovered and indicate that the cave of Ayios Charalambos contains skeletal remains with excellent biomolecular preservation. In comparison, racemization results obtained from specimens from Odigitria suggested poor preservational history. Aspartic acid ratios for Odigitria ranged from 0.092 to 0.226 (average=0.135) and for alanine from 0.007 to 0.043 (average=0.015). Concentration ratios from Odigitria materials were proportional to published and modern reference standards, but showed a greater range compared with the samples from Ayios Charalambos. For Asp/Glu, they ranged from 0.66 to 1.12 (average=0.75), Ser/Glu 0.38–0.48 (average=0.42) and Ala/Glu 1.31–1.86 (average=1.59) Quantification of target molecules was performed on specimens from Ayios Charalambos using primers L16055-H16155 and SYBR Green (Qiagen) dye on a DNA Engine Opticon 2 Real-Time PCR Detection System (MJ Research). All DNA extracts were shown to contain high copy numbers, ranging from 6,250–13,125 copies (average=10,500) per PCR reaction30.
DNA extraction, PCR cloning and sequencing
Teeth were decontaminated by removing the outer layer with sand paper, soaking in 100% bleach for 15 s, rinsing 8 times with DNA-free water and UV treating on all sides for 3 h. They were then pulverized with a Spex CertiPrep 6750 Freezer/Mill for 2 min at a setting of 4. Four-hundred milligram of the resulting powder was decalcified and digested following Krings et al.31, using Ultra reagents (Fluka BioChemika). For the HVS-1 analysis, samples were centrifuged for 1 min at 4,000g and the supernatant removed and extracted with an equal volume of UltraPure phenol, chloroform, isoamyl alcohol (25:24:1) (Invitrogen). Supernatant was concentrated to 100 μl using Microcon MW-30 columns (Millipore). DNA from concentrate was isolated using the MinElute Qiagen PCR Purification Kit32 and eluted with 70 μl of DNA-Free Elution Solution (QBIOgene). Six microlitres of the DNA extract was added to each 25 μl reaction containing HotStart Taq DNA Polymerase (Qiagen) following the manufacturers protocol. Four or five overlapping primer pairs were used to amplify 16055–16379 of the mitochondrial HVS-1 region. Primers followed previous publications31,33 with these noted modifications L16022-H16155 (5′-ATGTGGATTGGGTTTTTATG-3′) or L16055-H16155, L16122-H16223 (5′-CAGTTGATGTGTGATAGTTGAG-3′), L16209 (5′-CCCCATGCTTACAAGCAAG-3′)-H16331, and L16271-H16379. Reactions were cycled in a PTC-150HB PCR MiniCycler (MJ Research) using the parameters: 95 °C for 15 min, 42 cycles of 94 °C for 30 s, 55 °C for 60 s, 72 °C for 60 s and 72 °C for 7 min. PCR products were cloned using the 2.1-TOPO TA Cloning Kit (Invitrogen). Eight to twelve clones per amplicon were sequenced, representing ~80 clones per individual. For sequencing by next-generation Illumina GAII analyzer, DNA was extracted according to the protocol of Rohland and Hofreiter34, and processed for sequencing according to the specifications of the manufacturer. The DNA ends were repaired by a Taq polymerase-based protocol and TruSeq adaptors or bar-coded adaptors (single-end) ligated to synthesize the DNA-sequencing libraries. The Truseq adapter libraries were loaded in a single flowcell, while the bar-coded libraries were pooled in sets of six libraries and loaded in a single flowcell.
Sequence analysis and statistics
Consensus sequences were determined from manually aligned amplicons. Sequences were typed following Richards et al.35, where motifs containing 16304 were typed as haplogroup H rather than F. All analyses were performed treating cytosine deamination-induced artifacts as ambiguous characters (N). The Surfer 9.0 application (Golden Software Inc., Golden, Colorado) applying the Kriging method was used to graphically represent shared lineages on geographic maps.
Comparison data set of extant and ancient populations
For comparison to the Minoan haplotypes, we mined the GenBank sequence database, and compiled a data set of previously published HVS-1 haplotypes from 135 different population samples (total of 14,267 individuals) (Supplementary Table S4). For our analysis, samples were grouped into 71 population groups from modern populations and 11 ancient populations (Supplementary Table S4).
Population distance matrix based on allele frequencies
For each population, we computed the frequencies of the four different possible nucleotides (A,C,G,T) and missing entries for each of the 413 genotyped mtDNA loci of the HVS-1 region. Thus, each population was summarized by a vector of frequencies. To compute the distance between two populations, we ignored loci with >10% missing entries in either population. Then, for each locus, we computed the city-block (L1) distance between the frequency vectors at that locus. (Recall that the L1 distance between two probability distributions is simply the sum of the absolute values of the element-wise differences.) The distance between the two populations is equal to the average of all L1 distances in all retained loci. This distance definition is symmetric, and for populations that have similar allele frequencies in all genotyped loci, this distance will be small. The above computation was run for all pairs of available populations, thus forming a pairwise distance matrix for all populations.
Principal component analysis
PCA was performed on a pairwise population distance matrix, which was computed using the allele frequencies at each genotyped locus. PCA was evaluated on various subsets of the available populations. Towards that end, we applied the singular value decomposition on the aforementioned pairwise distance matrix, to compute its singular vectors and values. The singular values were used to measure the significance of the top two principal components, and nearest neighbours to the Minoan population were computed by projecting each population on the top two singular vectors and then scaling by the corresponding singular values.
Author contributions
G.S. designed and coordinated the study. J.R.H. and D.M. performed the initial experiments and analysed the data. D.M.L., P.A.N. and J.A.S. repeated the experiments and performed the second-generation sequencing. P.P. and P.D. performed the statistical analysis. G.S. and J.R.H. wrote the paper. All authors discussed the results and commented on the manuscript.
Additional Information
GenBank accession number: DNA sequences from Minoan teeth were deposited in GenBank nucleotide database under accession numbers: HM022270-HM022272, HM022275, HM022276, HM022278 HM022281, HM022284-HM022288, HM022295-HM022295, HM022299, HM022302-HM022305, HM022308, HM022310-HM022312, HM022314-HM022319, HM022321-HM022323.
How to cite this article: Hughey, J. R. et al. A European population in Minoan Bronze Age Crete. Nat. Commun. 4:1861 doi: 10.1038/ncomms2871 (2013).
Supplementary Material
Supplementary Figures S1-S3 and Supplementary Tables S1-S7
Acknowledgments
We thankfully acknowledge the support and encouragement of the former director of the Ayios Nikolaos archaeological service and museum, the late Nikos Papadakis. We thank F. McGeorge and A. Vasilakis for providing the Minoan osseous remains used in our study. I. Nasidze graciously supplied DNA sequences from his previous studies. This work was supported by National Institutes of Health Grants to G.S.
References
- Broodbank C. & Strasser T. Migrant farmers and the Neolithic colonization of Crete. Antiquity 65, 233–245 (1991). [Google Scholar]
- Cherry J. F. The colonization of the Mediterranean islands: a review of recent research. J. Medit. Archaeol. 3, 145–221 (1990). [Google Scholar]
- Ammerman A. J. & Cavalli-Sforza L. L. The Neolithic Transition and the Genetics of Populations in Europe Princeton University Press: Princeton, (1984). [Google Scholar]
- Renfrew C. Who were the Minoans? Towards a population history of Crete. Cretan Studies 5, 1–27 (1996). [Google Scholar]
- Renfrew C. Word of Minos: the Minoan Contribution to Mycenaean Greek and the Linguistic Geography of the Bronze Age Aegean. Camb. Archaeol. J. 8, 239–264 (1998). [Google Scholar]
- Watrous L. V. Crete from earliest prehistory through the Protopalatial period. Am. J. Archaeol. 98, 695–753 (1994). [Google Scholar]
- Evans A. The Palace of Minos; a Comparative Account of the Successive Stages of the Early Cretan Civilization as Illustrated by the Discoveries at Knossos Macmillan: London, (1921). [Google Scholar]
- Evans A. The early Nilotic, Libyan and Egyptian relations with Minoan Crete. The Huxley Memorial lecture for 1925. J. Royal Anthr. Inst. 55, 199–228 (1925). [Google Scholar]
- Hutchinson R. W. Prehistoric Crete Penguin Books: Baltimore, (1962). [Google Scholar]
- Caskey J. Greece, Crete and the Aegean islands in the Early Bronze Age Cambridge University Press: Cambridge, (1964). [Google Scholar]
- Hood S. The Minoans: Crete in the Bronze Age Thames and Hudson: New York, (1971). [Google Scholar]
- Weinberg S. S. In Relative Chronologies in Old World Archeology The University of Chicago Press: Chicago, (1954). [Google Scholar]
- Branigan K. The Foundations of Palatial Crete Praeger Publishers: New York, (1970). [Google Scholar]
- Martinez L. et al. Paleolithic Y-haplogroup heritage predominates in a Cretan highland plateau. Eur. J. Hum. Genet. 15, 485–493 (2007). [DOI] [PubMed] [Google Scholar]
- King R. J. et al. Differential Y-chromosome Anatolian Influences on the Greek and Cretan Neolithic. Ann. Hum. Genet. 72, 205–214 (2008). [DOI] [PubMed] [Google Scholar]
- Martinez L., Mirabal S. & Herrera R. J. Middle Eastern and European mtDNA lineages characterize populations from Eastern Crete. Am. J. Phys. Anthropol. 137, 213–223 (2008). [DOI] [PubMed] [Google Scholar]
- Vassilakis A. & Branigan K. in Moni Odigitria: A Prepalatial Cemetery and Its Environs in the Asterousia, Southern Crete Academic Press: Philadelphia, (2010). [Google Scholar]
- Betancourt P. P. et al. Excavations in the Hagios Charalambos cave: a preliminary report. Hesperia 77, 539–605 (2008). [Google Scholar]
- Watrous L. V. Lassithi: A history of settlement on a highland plain in Crete. Hesperia Suppl XVIII, 1–89 (1982). [Google Scholar]
- Cooper A. & Poinar H. N. Ancient DNA: do it right or not at all. Science 289, 1139 (2000). [DOI] [PubMed] [Google Scholar]
- Haak W. et al. Ancient DNA from European early Neolithic farmers reveals their near eastern affinities. PLoS Biol. 8, e1000536 (2010). [DOI] [PMC free article] [PubMed] [Google Scholar]
- Tambets K. et al. in Archaeogenetics eds Renfrew C., Boyle K. 219–235 ((2000). [Google Scholar]
- Chikhi L., Nichols R. A., Barbujani G. & Beaumont M. A. Υ genetic data support the Neolithic demic diffusion model. PNAS 99, 11008–11013 (2002). [DOI] [PMC free article] [PubMed] [Google Scholar]
- Renfrew C. Archaeology and Language. The puzzle of Indo-European origins Jonathan Cape: London, (1987). [Google Scholar]
- Gray R. D. & Atkinson Q. D. Language-tree divergence times support the Anatolian theory of Indo-European origin. Nature 426, 435–439 (2003). [DOI] [PubMed] [Google Scholar]
- Bouckaert R. Mapping the origins and expansion of the Indo-European language family. Science 337, 957–960 (2012). [DOI] [PMC free article] [PubMed] [Google Scholar]
- Malmstrom H. et al. More on contamination: the use of asymmetric molecular behavior to identify authentic ancient human DNA. Mol. Biol. Evol. 24, 998–1004 (2007). [DOI] [PubMed] [Google Scholar]
- Poinar H. N., Hoss M., Bada J. L. & Paabo S. Amino acid racemization and the preservation of ancient DNA. Science 272, 864–866 (1996). [DOI] [PubMed] [Google Scholar]
- Klinken G. L. & Mook W. G. Preparative high-performance liquid chromatographic separation of individual amino acids derived from fossil bone collagen. Radiocarbon 3, 2155–2164 (1990). [Google Scholar]
- Hughey J. R., Du M., Li Q., Michalodimitrakis M. & Stamatoyannopoulos G. A search for β thalassemia mutations in 4000 year old ancient DNAs of Minoan Cretans. Blood Cell Mol. Dis. 48, 7–10 (2012). [DOI] [PMC free article] [PubMed] [Google Scholar]
- Krings M. et al. Neandertal DNA sequences and the origin of modern humans. Cell 90, 19–30 (1997). [DOI] [PubMed] [Google Scholar]
- Yang D. Y., Eng B., Waye J. S., Dudar J. C. & Saunders S. R. Technical note: improved DNA extraction from ancient bones using silica-based spin columns. Am. J. Phys. Anthropol. 105, 539–543 (1998). [DOI] [PubMed] [Google Scholar]
- Vernesi C. et al. Genetic characterization of the body attributed to the evangelist Luke. Proc. Natl Acad. Sci. 98, 13460–13463 (2001). [DOI] [PMC free article] [PubMed] [Google Scholar]
- Rohland N. & Hofreiter M. Comparison and optimization of ancient DNA extraction. BioTechniques 42, 343–352 (2007). [DOI] [PubMed] [Google Scholar]
- Richards M. et al. Tracing European founder lineages in the Near Eastern mtDNA pool. Am. J. Hum. Genet. 67, 1251–1276 (2000). [PMC free article] [PubMed] [Google Scholar]
Associated Data
This section collects any data citations, data availability statements, or supplementary materials included in this article.
Supplementary Materials
Supplementary Figures S1-S3 and Supplementary Tables S1-S7


