Abstract
The search for new superconducting materials has been spurred on by the discovery of iron-based superconductors whose structure and composition is qualitatively different from the cuprates. The study of one such material, KxFe2−ySe2 with a critical temperature of 32 K, is made more difficult by the fact that it separates into two phases—a dominant antiferromagnetic insulating phase K2Fe4Se5, and a minority superconducting phase whose precise structure is as yet unclear. Here we perform electrical and magnetization measurements, scanning electron microscopy and microanalysis, X-ray diffraction and scanning tunnelling microscopy on KxFe2−ySe2 crystals prepared under different quenching processes to better understand the relationship between its microstructure and its superconducting phase. We identify a three-dimensional network of superconducting filaments within this material and present evidence to suggest that the superconducting phase consists of a single Fe vacancy for every eight Fe-sites arranged in a √8 x √10 parallelogram structure.
 The structure of the superconducting phase of iron-based superconductor KxFe2−ySe2 is difficult to determine because it coexists with an predominant insulating phase. Ding et al. identify the superconducting filaments that provide clues to the structure of the parent phase of superconductivity.
Since the discovery of high temperature superconductivity in F-doped LaFeAsO1, many new iron-based superconductors with different structures have been fabricated2. A new superconducting system, namely the KxFe2−ySe2, was discovered by the end of 2010 (3,4). This material has the iso-structure of the FeAs-based 122 superconductors5,6,7 and brings about new interests and curiosity to the community because the preliminary band structure calculation on this system8 has predicted the absence of the hole pocket, which is supposed to be necessary for the theoretical picture of S± pairing9,10. Soon later, it was suggested that the material might be iron deficient and separate into an insulating antiferromagnetic K2Fe4Se5 phase and a superconducting phase11,12,13. Up to now the phase separation in superconducting KxFe2−ySe2 single crystals has been intensively investigated and widely perceived14. However, it remains unclear what is the precise composition and the structure (in terms of the iron vacancies) of the superconducting phase.
From the fact that a robust superconducting magnetic shielding signal appears at low magnetic fields, but it becomes much weaker at high magnetic fields, we point out the percolation of the superconducting state in KxFe2−ySe2 (11). This picture can easily explain the double-magnetic penetrations in the low magnetic field region on the magnetic-hysteresis-loops (MHL) and the very narrow MHL width11, which is proportional to the superconducting critical current density according to the Bean critical state model. Later, nanoscale phase separation was also inferred from the scanning tunnelling microscopy (STM)12 and angle-resolved photoemission spectroscopy13. Earlier measurements on Mössbauer15 effect in the same sample reveal a magnetic phase (later shown to be the antiferromagnetic insulating phase K2Fe4As5)16,17, which occupies about 80–90% of the volume, leaving only 10–20% of the volume as the paramagnetic phase, which becomes superconductive at low temperatures. Phase separation has also been found in KxFe2−ySe2 by many other techniques18,19.
By quenching the original KxFe2−ySe2 single crystals from a high-annealing temperature (for example, 350 °C), we found that the global appearance of superconductivity inferred from the resistive and the magnetic measurements was significantly improved20. It is curious to know why the quenching process affects superconductivity so obviously. One proposal would be that after being quenched, the iron vacancies may be in the disordered state that somehow suppresses the antiferromagnetic state and promotes the superconductivity21. The phase separation was investigated by Liu et al.22 and Speller et al.23 by analysing the correlation between the microstructures and superconductivity. Meanwhile, nanoscale phase separation has also been suggested from the scanning nano-focused X-ray diffraction24. It remains unresolved whether the enhanced superconductivity in the quenched samples is induced by disordering of the iron vacancies, or alternatively the superconductivity appears in an ordered state with an unknown microstructure of the iron vacancies. Furthermore, it is curious to know what is the parent phase from which the superconductivity is derived. Here, we demonstrate that the superconductivity has a close relationship with the microstructure due to the phase separation, and for the first time, we propose that the superconducting filamentary paths are derived from a possible parent phase with one vacancy in every eight Fe sites, forming a unique √8 x √10 parallelogram structure.
Results
Sample preparation and characterizations
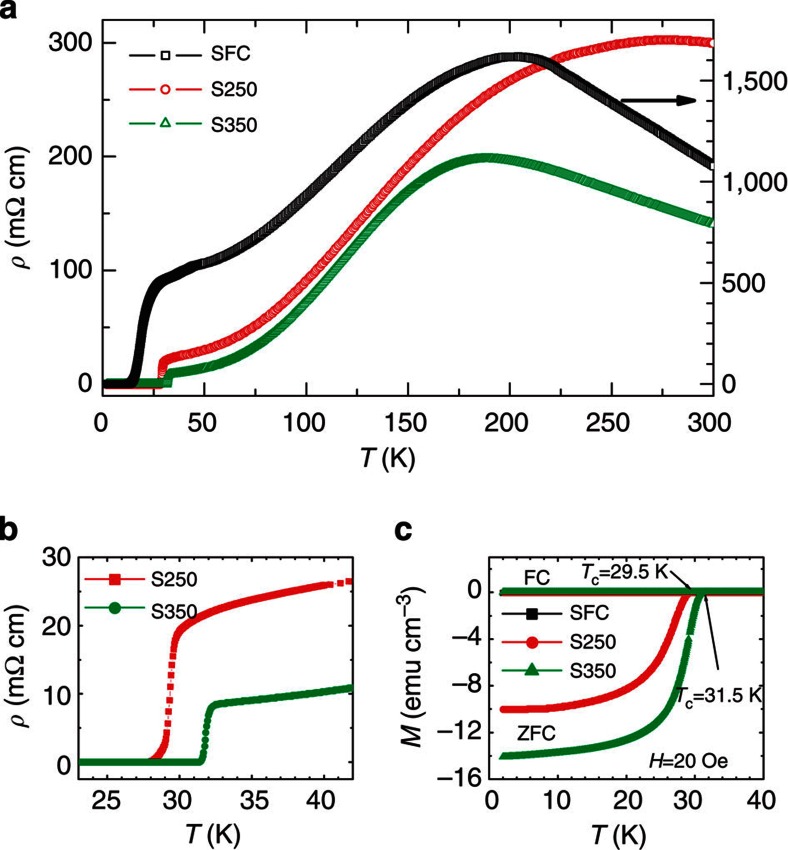
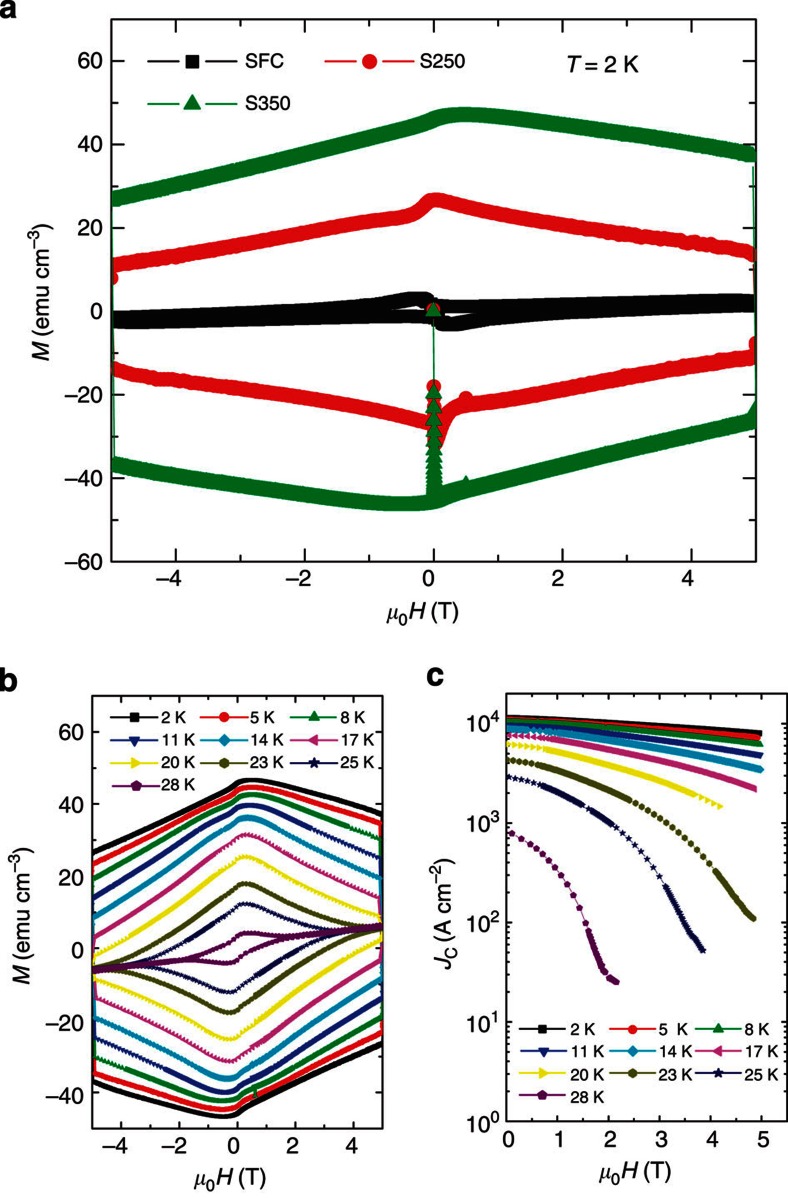
The original KxFe2−ySe2 single crystals were fabricated by using the self-flux method. Details for growing the samples are presented in Methods. We prepare the target samples with different microstructures by following the quenching technique established early in our group20. The original single crystals have been thermally treated in three different ways: slow furnace cooled (samples named as SFC) from the high sintering temperature (1,030 °C), retreated for 2 h at 250 °C (samples named as S250) and 350 °C (samples named as S350) and followed by quenching in liquid nitrogen. In Fig. 1a, we show the temperature dependence of resistivity of the three typical samples. It is clear that the SFC sample exhibits a broad superconducting transition, which starts at about 25 K, and is accompanied by a large residual resistivity (~ 450 mΩ cm). For the quenched sample S350, as shown in Fig. 1a, sharp superconducting transition occurs at about 32 K with a quite small residual resistivity (8.4 mΩ cm), indicating a much better connectivity of the superconducting phases. This evolution of superconductivity with quenching is consistent with the magnetization data. As shown in Fig. 1c, the magnetization measured at 20 Oe using the zero-field-cooled mode on the sample SFC is very small, indicating a poor connectivity of superconducting phases. This is in sharp contrast with the sample of S350. A simple estimate on the magnetization of S350 measured in the zero-field-cooled mode at H=20 Oe gives a magnetic shielding volume of about 80%. However, as we addressed previously11, for a superconductor constructed by filamentary networks, it is not valid to calculate the superconducting volume using the magnetic shielding signal measured at a low magnetic field. In Fig. 2a, the MHLs of the three typical samples are presented. The SFC sample exhibits a very tiny irreversible magnetization, indicating a rapid flux motion. For the sample S350, the MHL becomes much wider, indicating a certain strength of flux pinning. In Fig. 2b, the MHLs measured at different temperatures from 2 to 28 K are presented. It is interesting to see that, even up to 28 K (close to Tc), the MHL is still open showing a capability of carrying superconducting current up to about 2 T. This suggests that the superconducting area, although being small in volume fraction, has robust superconductivity as in the FeAs-based 122 samples. The behaviour of magnetization in KxFe2−ySe2 samples after different thermal treatments was also observed by other groups22,25. Here, we use the Bean critical state model, although it may be inappropriate for an inhomogeneous superconductor, to calculate the superconducting critical current density (Jc) and present the data in Fig. 2c. At 2 K and near zero field, we find a value of Jc=1.4 × 10⁴ A/cm2, which is about 1 to 2 orders of magnitude lower than that of the FeAs-based 122 samples26. The much suppressed Jc and the easy magnetic flux penetration in KxFe2−ySe2 are consistent with the picture of percolative superconductivity. Comparing the transport and the magnetic properties among the three typical samples, we conclude that the connectivity of the superconducting paths should be worse in SFC than in S350.
Figure 1. Resistive and magnetic properties of the samples after three typical thermal treatments.
(a) Temperature dependence of resistivity of the three typical samples SFC, S250 and S350 experiencing different thermal treatments. The SFC sample has a rather broad transition width and a large residual resistivity. (b) The resistive data shown in an enlarged view in low temperature region. In contrast, the sample S350 has a rather sharp superconducting transition at about 32 K with a small residual resistivity. (c) Temperature dependence of DC magnetization of the three samples measured with the zero-field-cooling (ZFC) and field-cooling (FC) modes at H=20 Oe. As the ZFC signal of the SFC sample is very small, it overlaps with the FC curves of the three samples.
Figure 2. Magnetizations of the three typical samples.
(a) The magnetic field dependence of the magnetization of the three samples SFC (square symbols), S250 (filled circles) and S350 (triangle symbols). (b) The magnetization-hysteresis-loops of the sample S350 measured at temperatures from 2 to 28 K. A magnetization hysteresis can be observed up to 2 T even at 28 K, being close to Tc. (c) The magnetic field dependence of the critical current density calculated based on the Bean critical state model, although it may be invalid for this sample with phase separation. The purpose is to give a rough comparison between the present sample S350 and that of the FeAs-based 122 samples.
Scanning electron microscope measurements
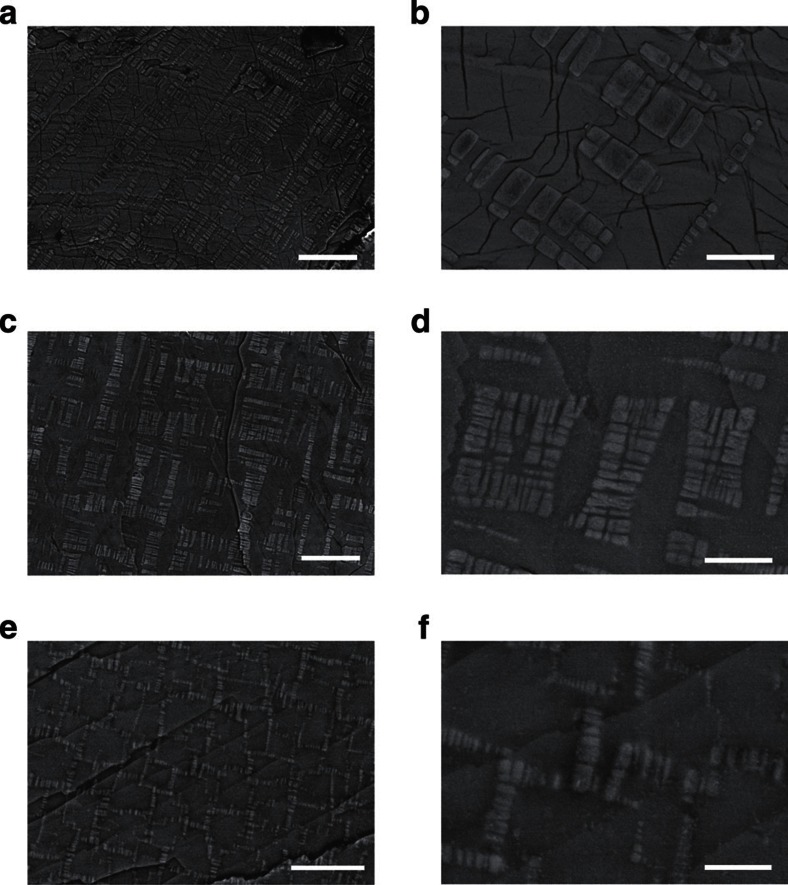
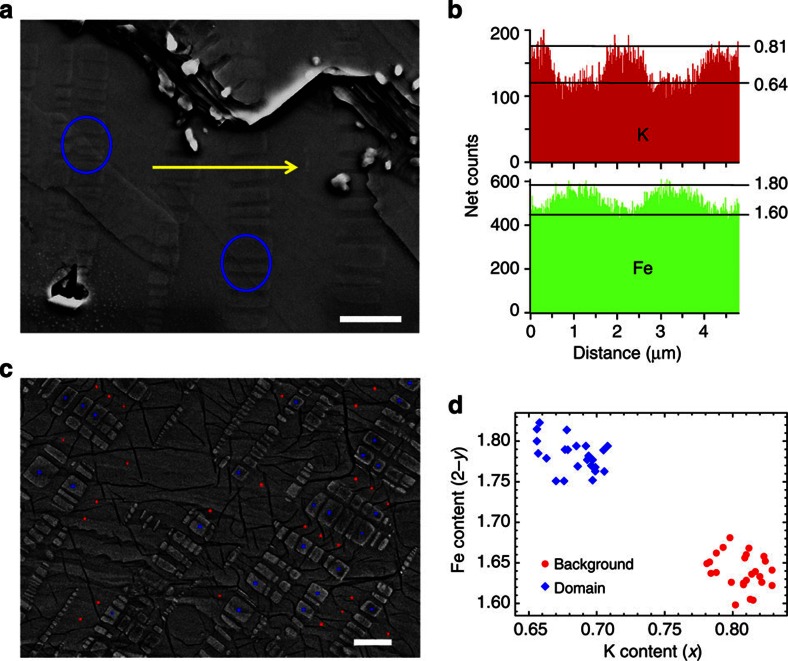
In order to illustrate the relationship between the microstructure and superconductivity in three different samples, we measured the morphology on the surface of newly cleaved samples using an advanced field-emission scanning electron microscope (SEM). The details for the SEM measurements are given in Methods. For three typical samples, as shown in Fig. 3, they all separate into two major regions, which are characterized by the domain-like brighter area and a background with darker colour. A close scrutiny finds that there are some differences among the microstructures of the three typical samples. For the sample SFC (shown in Fig. 3a), the brighter domains with roughly rectangular shapes, have a larger size and are well separated from each other. For the sample S250 (shown in Fig. 3c), the large domains in SFC further crack but are still well separated. As shown in Fig. 3e, for the sample S350, however, the brighter area split into many tiny domains, which uniformly spread out and closely connect into a spider-web-like network. Similar features were observed by other groups22,23. In order to get a deeper insight on the two different areas exposed by our SEM, we did the measurements of local composition across certain areas in the samples. As shown in Fig. 4a, for the sample of SFC, we cleaved the sample and randomly select an area with these two typical kinds of regions and some naturally formed terraces. Then we randomly select two brighter domains and collect the data of local compositions of K, Fe and Se by scanning along the trace highlighted by the yellow arrowed line. It is clear that the Fe (K) concentration is higher (lower) on the domains than in the background. As presented in Fig. 4a, close correlation between the local compositions of K and Fe is observed. By figuring out the local compositions, we find that the brighter domains have a composition of about K0.64Fe1.78Se2, while the background area has a composition of about K0.81Fe1.60Se2, the latter is very close to the standard K2Fe4Se5 phase16,17. To strengthen these conclusions, we did the local analysis on 50 randomly selected specific points, marked by the red spots (on background) and blue spots (on the domains) in Fig. 4c. The statistics on these data are given in Fig. 4d. Interestingly, the data are rather converged and fall into mainly two groups, one with the composition of about K0.68Fe1.78Se2 and another one around K0.8Fe1.63Se2. In combination with the transport and magnetic properties mentioned above, and taking the composition analysis into account, the brighter areas are naturally attributed to the superconducting filamentary paths, while the background corresponds to the well understood antiferromagnetic 245 phase. Further analysis on the sample S350 gives the similar compositions in two different regions as the SFC.
Figure 3. Back-scattered electron images of SEM measurements on the cleaved surface of three typical samples.
(a,b) The topography of the cleaved surface of the sample SFC. It is clear that the sample separates into two kinds of regions: the domains with brighter colour and rectangular shape, which are buried in the background of a darker region. Some cracks can be found in the background of the sample. The domains are widely separated. (a) Scale bar, 10 μm, (b) scale bar, 2 μm. (c,d) The topography of the cleaved surface of the sample S250. The domains with brighter colour in the sample of SFC further crack into many smaller domains, but are still far apart from each other. (c) Scale bar, 10 μm, (d) scale bar, 2 μm. (e,f) The SEM image of the sample S350. One can see that the domains become very small and well connected and form some networks which look like the spider-web. (e) Scale bar, 5 μm, (f) scale bar, 1 μm. The measurements were done with the voltage of 10 kV.
Figure 4. Correlations between the microstructure and the analysis on the compositions.
(a) The topography of one cleaved surface of a sample SFC. Scale bar, 2 μm. One can clearly see the rectangular domains that are buried in the background. The yellow arrowed line highlights the trace along which the spatial distribution of compositions of K and Fe are measured and presented in (b). The large blue circles here mark the positions where the rectangular domains go through several layers along c axis. The outline and shade of the domains can be seen on the layers with different height. (c) The SEM image of the sample SFC in another region. The red spots and blue spots mark the positions where the local compositions are analysed. Scale bar, 2 μm. (d) The compositions of K and Fe measured on the rectangular domains (blue diamond) and the background (red circles). One can clearly see that the data fall into two groups: the formula K0.68Fe1.78Se2 on the domain, and K0.81Fe1.6Se2 on the background. The measurements are done with the voltage of 20 kV.
To know whether the fractional area occupied by the domains will change after different thermal treatments, we estimate the fractional ratio of the domains (suppose to be the superconducting areas) of the three typical samples. As the SEM images are all grey-scale digitalized, we set a critical value for the grey level, and convert the colour of the domains to white and the colour of the background to black. Then we let the program to calculate the fractional ratio of white areas over the total. It is interesting to note that the fractional ratio of the area occupied by the brighter domains in all three kinds of samples are close to each other: SFC (20.51%), S250 (18.23%), S350 (16.97%). Clearly the fractional ratio occupied by the superconducting areas is quite stable, although a trend of slight decreasing after the quenching has been observed. Based on above phase separation scenario, we conclude that the quenching procedure itself doesn’t create superconducting area, however, it changes the arrangement and the connectivity of the superconducting areas.
Another interesting observation here is that these superconducting domains exist actually as three dimensional pillars buried in the 245 background. This can be evidenced at several places marked by the circles in Fig. 4a, where the terraces exist due to the cleaving, but the superconducting domains extend in many layers along the c axis. In this sense, the superconducting filamentary paths form a three dimensional network, which we call as the three-dimensional (3D) spider-web-like network. Similar behaviour of the composition distribution is observed in the sample S350, which presents better global appearance of superconductivity, although now the domains become much smaller. Therefore, our data clearly illustrate the 3D spider-web-like superconducting filamentary paths.
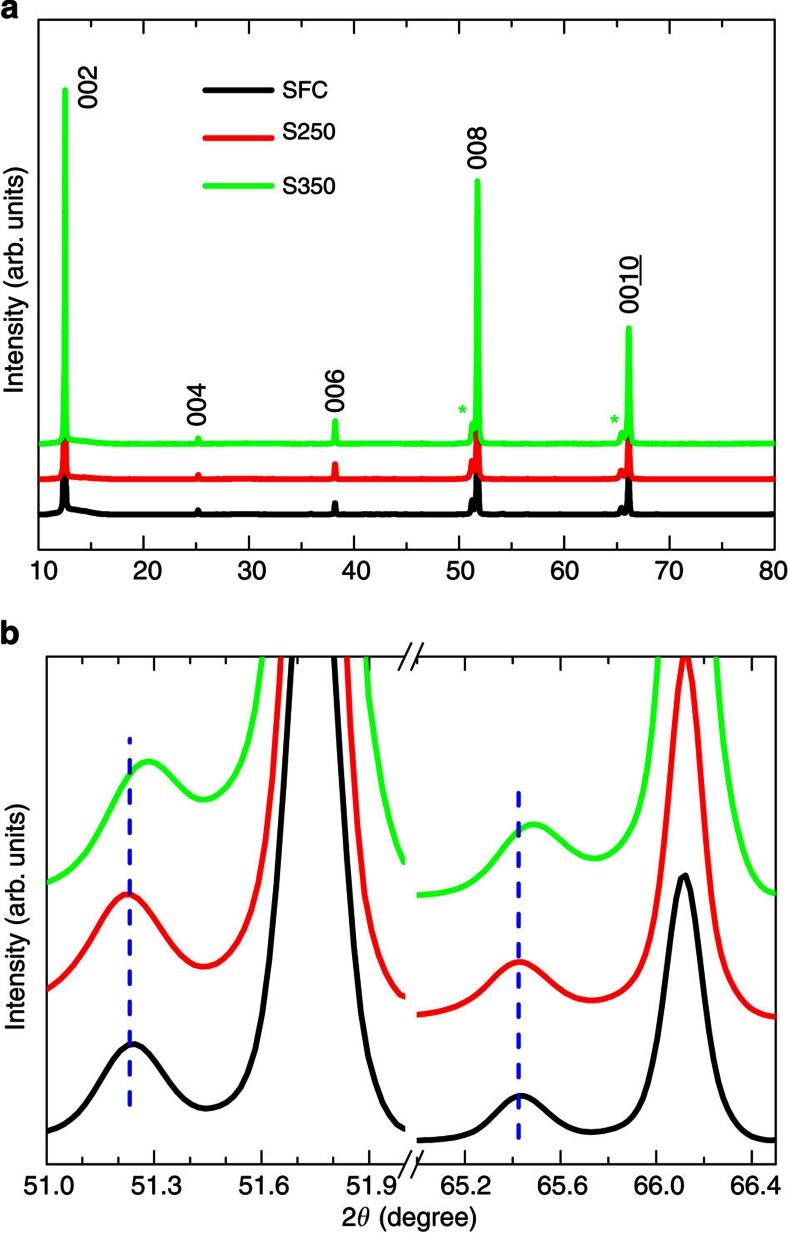
The phase separation can also be concluded from the X-ray diffraction pattern measurements performed on a series of single-crystal samples. Figure 5a shows the X-ray diffraction pattern data of the SFC and quenched crystals. The sharp diffraction peaks indicate excellent crystalline quality of all crystals, and the peak splitting of the (00l) reflections evidences the coexistence of two spatially separated phases in the crystals. As one can see, there is hardly any obvious shifting among the peaks of the majority phase, which corresponds to the antiferromagnetic ordered 245 structure. The peaks from the minority phase that corresponds to the domains in the SEM image are marked by the asterisks. From the enlarged view of (008) and ( ) reflections (Fig. 5b), we can see that the peaks indicated by the asterisks of S250 stand at the same positions of the SFC. In contrast to S250, the peaks from the minority phase of S350 seem to shift slightly and become closer to the majority phase. Taking a comparison with the SEM images, the results suggest that the chemical phase of the superconducting areas doesn’t change and the ‘islands’ just crack into smaller pieces when quenched at 250 °C. Instead, the ‘domains’ change into many thin but well connected networks and the c axis shrinks slightly in the S350 samples.
Figure 5. X-ray diffraction patterns of the KxFe2−ySe2 single crystals.
(a) The (00l) reflections from the basal plane of the samples SFC, S250 and S350, respectively. The asterisks indicate the peaks of the superconducting phase. (b) An enlarged view of the (008) and ( ) reflections.
Discussion
In our local analysis presented above, it is found that the composition of the superconducting domains are converged at about K0.68Fe1.78Se2. Assuming that the Fe and Se atoms on the domains have a basic valence state of Fe2+ and Se2−, respectively, the average doping level is found to be around 0.12 e/Fe. This value is actually very close to that determined by the Fermi surface area in angle-resolved photoemission spectroscopy which gives 0.11 e/Fe (27) in the same sample. Concerning the uncertainties in these totally distinct techniques, the consistency between the two techniques are remarkable, which also validates the argument that the domains are superconducting and have a composition of about K0.68Fe1.78Se2. In the background phase, the analysis shows a composition of K0.8Fe1.63Se2, which is naturally attributed to the well-known 245 phase. This further validates the composition analysis on the superconducting domains. Concerning what is the real superconducting phase and/or the parent phase for superconductivity, it remains to be highly controversial. The local STM measurements of topography and tunnelling spectrum on KFe2Se2 thin films suggest that the superconductivity may arise from the phase with the standard formula KFe2Se2 or slightly Se-deficient KFe2Se2−x (12). Recently the same group has concluded that the Fe-vacancy free FeSe planes are superconductive when they are in proximity to the 245 phase28. In sharp contrast, Texier et al.29 recently concluded indirectly from the NMR measurements that the superconducting phase might have the formula Rb0.3Fe2Se2. From the point of view of the local stress induced by the electrostatic field, the formula of KFe2Se2 is actually in an extreme case where the system needs to overcome a huge electric potential, which may be only realized in thin films. Meanwhile, the structure with the formula of Rb0.3Fe2Se2 may be also in the verge of instability because the K content is too little to sustain the 122 structure. Therefore, the two confronting issues in the system of KxFe2−ySe2 are that on one hand one needs to lower down the electrostatic force by reducing both the Fe concentration from 2 and the K concentration from 1, and on the other hand it is necessary to maintain the 122 structure. The 245 phase is a naturally balanced state between these two limits: the charges are well balanced by having the ionic states of K+, Fe2+ and Se2−, and the Fe and K contents are high enough to maintain the 122 structure. The formation of the long-range antiferromagnetic order can further lower down the energy of the system. This is also the reason that the 245 phase is very easy to be formed in the fabrication. A glance at our formula K0.68Fe1.78Se2 of the superconducting domains would suggest that a possible phase with the formula of K0.5Fe1.75Se2 (or called as 278 phase) is next to the K0.8Fe1.6Se2 (or the 245) phase and may act as the parent phase for superconductivity. This parent phase has one vacancy in every eight Fe-sites. A slight adding of K atoms and Fe atoms in K0.5Fe1.75Se2, as usually happening in the synthesizing process, will lead to the electron doping and induce superconductivity. As far as we know, no any theoretical or experimental results about this 278 phase have been reported.
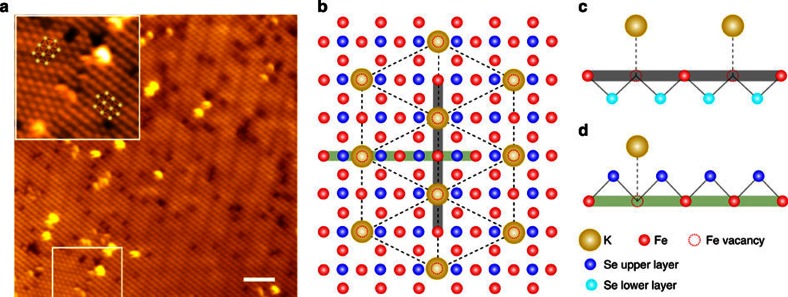
In order to check the proposed formula or lattice structure of the Fe vacancies, that is, one Fe vacancy in every eight Fe-sites (or named as 1/8 Fe-vacancy state), we have tried to use STM to search for the possible evidence. After cleaving the single crystals of KxFe2−ySe2, the most possible top layers exposed for the STM measurements are constructed by K or Se atoms. Thus, it is very difficult to resolve the structure of the Fe-layer in the cleaved single crystals. However, when the K-atom layer is exposed as the top layer, according to the basic understanding of local charge balance, a possible case is that on top of each Fe-vacancy there exists one K atom. This, as explained schematically in Fig. 6c, can significantly release the local stress induced by the electrostatic force. Thus, it is quite possible to observe a layer of K atoms, which has a lattice with the same structure of the Fe-vacancy in the beneath layer. Actually, for the case of one Fe-vacancy out of eight Fe-sites, there are at least five kinds of spatial arrangement for the Fe vacancies, for example,  ,
,  ,
,  ,
,  and
and  (in units of Fe–Fe bonds) with different block shapes. By doing the STM measurement on the domains, we sometimes observe a lattice with the structure shown in Fig. 6a. After mapping out the atoms carefully, we figure out that it is corresponding to one of the structures with 1/8 Fe-vacancy state, that is, the
  parallelogram block (in units of the Fe–Fe bonds). In Fig. 6b, we plot the K atoms on top of the Fe vacancies, together with the Se atoms between the K and the Fe layers. As shown in Fig. 6a, although there are some domain walls in the field of view, this kind of structure has been actually observed in most places of this region. Although our STM data here cannot give a direct evidence for the 1/8 Fe-vacancy
  state, the expectation of the composition of this state is very consistent with the chemical composition obtained from the superconducting domains, that is, K0.68Fe1.78Se2. Therefore, we would conclude that there is a strong indication that the superconducting phase is derived from the parent phase K0.5Fe1.75Se2 by partially filling K and Fe to the unoccupied sites, which induces doping of electrons into the system. The parent state K0.5Fe1.75Se2 is naturally charge balanced and the K concentration here may be just high enough to maintain the 122 structure. Any extra but slight doping to the K-sites and the Fe-sites in K0.5Fe1.75Se2 will induce electron doping, strengthen the stability of the 122 structure but with the tolerance of the charge imbalance to a certain extent. Superconductivity is achieved by the electron doping under such a subtle balance. We must emphasize that although we have observed a unique 1/8 Fe-vacancy
  state with the parallelogram structure, however, we cannot rule out the existence of other possible structures completely. The observation of this very unique pattern in such a large area strongly suggests that this structure should be a very competent one with lower energy, which may be resolved by the future theoretical calculations. Furthermore, we need to clarify that the pattern of K atoms on the surface have here only as the indicators of the Fe vacancies in the beneath layer of Fe, one should not extend this structure for the K atoms in the body of the sample.
Figure 6. Atomically resolved topography and the sketch of the 1/8 Fe-vacancy  structure.
(a) The measured STM image on the [001] surface of the sample SFC with the proposed 1/8 Fe-vacancy  structure. The bias voltage and tunnelling current during the measurements are fixed at 4.2 V and 50 pA, respectively. The image on the upper-left corner is an enlarged view of the region enclosed by the frame on the bottom. In the inset, we use the white circles to represent the atoms of K. On the surface there are mainly two domains with different orientations, but they have the same structure, that is the
  parallelogram block. Scale bar, 5 nm. (b) Sketch of the K, Fe and Se atoms with the Fe vacancies in the beneath layer. The big yellow circles and hollow red circles with dashed-outlines represent the K atoms and the Fe vacancies, respectively. In our proposal they have the same
  parallelogram structure. (c,d) The partial structure constructed by the K, Fe and Se atoms when K resides just above the Fe vacancy, by crossing the two cuts along the traces highlighted by the thick grey and light-green lines in (b).
Concerning the electronic properties of the K0.5Fe1.75Se2 state (or called as the 278 phase), at this moment, we can only have limited speculations. First of all, this phase may not have an antiferromagnetic transition at temperatures below 300 K, as we have not found any such transitions from our measurements. This is qualitatively consistent with the recent calculations on the 278 phase30. In addition, in this phase, compared with the 245 state, the Fe vacancies are much diluted, therefore one can expect that it may be more ‘metallic’ and gapless, or may have a much smaller gap, but should still be a bad metal. Recently, it is shown that by intercalating the so-called neutral layers, like molecules Lix(NH2)y(NH3)1–y, between the FeSe layers one can produce the 122 structure with much higher Fe concentration without inducing large electrostatic force and thus lead to the superconducting samples with larger superconducting shielding volume31,32,33. This development is certainly consistent with our general arguments. It remains to know what basic properties should exhibit by the proposed 1/8 Fe-vacancy  state. Our discovery here should stimulate further theoretical and experimental investigations.
Methods
Sample synthesis
The original KxFe2−ySe2 single crystals were fabricated by using the self-flux method. Firstly, FeSe was prepared as the precursor by reacting Fe powders (purity 99.99%) and Se grains (purity 99.99%) in the ratio of 1:1 at 700 °C for 24 h. Then the starting materials with an atomic ratio of K:FeSe=0.8:2 were loaded into an alumina crucible and sealed in a quartz tube under vacuum. Sometimes a second bigger quartz tube is used in case the inner quartz tube cracks during the sintering. All the weighing, mixing, grinding and pressing procedures were finished in a glove box under argon atmosphere with the oxygen and moisture below 0.1 p.p.m. The mixture were subsequently heated up to 1,030 °C and held for 3 h. The sample was cooled down to 800 °C at a rate of 4 °C/h, and then it was cooled to room temperature by switching off the power of the furnace.
Structure characterization
A Zeiss Ultra-55 field-emission SEM (FE-SEM) was employed to measure the microstructures of the samples. With the 10 kV accelerating voltage and an AsB detector working in the topographic mode, domain structures with high contrast were observed. An Oxford Instruments Inca X-Max 50 energy-dispersive X-ray spectroscope (EDS) installed on the SEM was used to evaluate lateral distributions of the elements in the samples. The EDS measurements were performed with the spot and linear modes, respectively. In the spot mode, 50 spots were randomly selected on and off the domains of each sample to obtain high resolution spectra with a measurement time of 1 min for one point, with the voltage of 20 kV. In the line mode, the scanning was performed on lines across randomly selected domains with a dwell time of 10 s per step.
STM measurements
The STM experiments were carried out with an ultrahigh vacuum, low temperature- and high magnetic field-scanning probe microscope USM-1300 (Unisoku Co., Ltd). All processes before transferring the sample into the load-lock of the STM for cleaving were carried out in a glove box with Ar gas for protection. Then the samples were loaded to the STM system and cleaved at room temperature in an ultrahigh vacuum with a base pressure of about 1 × 10⁻¹⁰ torr. After cleaving, the sample was immediately transferred to the STM measuring stage at the bottom of the cryostat. In the STM measurements, Pt/Ir tips were used.
Author contributions
The sample preparation and the follow-up thermal treatment were done by X.D. The transport, magnetic measurements were done by X.D. The SEM measurements and analysis were carried out by X.D., G.M., C.M. and Y.H. The low-temperature STS measurements were finished by D.F., Z.W. and H.Y., H.H.W. designed and partially joined the experimental procedures, coordinated the whole work, wrote the manuscript. All authors have discussed the results and the interpretation.
Additional information
How to cite this article: Ding, X. et al. Influence of microstructure on superconductivity in KxFe2−ySe2 and evidence for a new parent phase K2Fe7Se8. Nat. Commun. 4:1897 doi: 10.1038/ncomms2913 (2013).
Acknowledgments
We acknowledge the useful discussions with Igor Mazin, Fuchun Zhang, Zhongyi Lu, Tao Xiang, Hong Ding and Jiangping Hu. We appreciate the kind help from Mu Wang for the help in using the FE-SEM, This work is supported by NSF of China (A0402/11034011, A0402/11190023), the Ministry of Science and Technology of China (973 projects: 2011CBA00100, 2012CB821403, 2012CB21400) and PAPD.
References
- Kamihara Y., Watanabe T., Hirano M. & Hosono H.. Iron-based layered superconductor La[O1-xFx]FeAs (x=0.05−0.12) with Tc=26 K. J. Am. Chem. Soc. 130, 3296–3297 (2008). [DOI] [PubMed] [Google Scholar]
- Fujitsu S., Matsuishi S. & Hosono H.. Iron based superconductors processing and properties. Int. Mat. Rev 57, 311–327 (2012). [Google Scholar]
- Guo J. et al. Superconductivity in the iron selenide KxFe2Se2 (0≤x≤1.0). Phys. Rev. B 82, 180520 (2010). [Google Scholar]
- Fang M. H. et al. Fe-based superconductivity with Tc=31 K bordering an antiferromagnetic insulator in (Tl,K) FexSe2. Europhys. Lett. 94, 27009 (2011). [Google Scholar]
- Rotter M., Tegel M. & Johrendt D.. Superconductivity at 38 K in the iron arsenide Ba1−xKxFe2As2. Phys. Rev. Lett. 101, 107006 (2008). [DOI] [PubMed] [Google Scholar]
- Sefat A. S. et al. Superconductivity at 22 K in Co-doped BaFe2As2 crystals. Phys. Rev. Lett. 101, 117004 (2008). [DOI] [PubMed] [Google Scholar]
- Ni N. et al. Effects of Co substitution on thermodynamic and transport properties and anisotropic Hc2 in Ba(Fe1−xCox)2As2 single crystals. Phys. Rev. B 78, 214515 (2008). [Google Scholar]
- Shein I. R. & Ivanovskii A. L.. Electronic structure and Fermi surface of new K intercalated iron selenide superconductor KxFe2Se2. Phys. Lett. A 375, 1028–1031 (2011). [Google Scholar]
- Mazin I. I., Singh D. J., Johannes M. D. & Du. M. H.. Unconventional superconductivity with a sign reversal in the order parameter of LaFeAsO1−xFx. Phys. Rev. Lett. 101, 057003 (2008). [DOI] [PubMed] [Google Scholar]
- Kuroki K. et al. Unconventional pairing originating from the disconnected Fermi surfaces of superconducting LaFeAsO1-xFx. Phys. Rev. Lett. 101, 087004 (2008). [DOI] [PubMed] [Google Scholar]
- Shen B. et al. Intrinsic percolative superconductivity in KxFe2−ySe2 single crystals. Europhys. Lett. 96, 37010 (2011). [Google Scholar]
- Li W. et al. Phase separation and magnetic order in K-doped iron selenide superconductor. Nat. Phys. 8, 126–130 (2011). [Google Scholar]
- Zhang Y. et al. Nodeless superconducting gap in AxFe2Se2 (A=K, Cs) revealed by angle-resolved photoemission spectroscopy. Nat. Mater 10, 273–277 (2011). [DOI] [PubMed] [Google Scholar]
- Wen H. H.. Overview on the physics and materials of the new superconductor KxFe2−ySe2. Rep. Prog. Phys. 75, 112501 (2012). [DOI] [PubMed] [Google Scholar]
- Ryan D. H. et al. 57Fe Mössbauer study of magnetic ordering in superconducting K0.80Fe1.76Se2.00 single crystals. Phys. Rev. B 83, 104526 (2011). [Google Scholar]
- Bao W. et al. A novel large moment antiferromagnetic order in K0.8Fe1.6Se2 superconductor. Chin. Phys. Lett. 28, 086104 (2011). [Google Scholar]
- Ye F. et al. Common crystalline and magnetic structure of superconducting A2Fe4Se5 (A=K, Rb, Cs, Tl) single crystals measured using neutron diffraction. Phys. Rev. Lett. 107, 137003 (2011). [DOI] [PubMed] [Google Scholar]
- Wang Z. et al. Microstructure and ordering of iron vacancies in the superconductor system KyFexSe2 as seen via transmission electron microscopy. Phys. Rev. B 83, 140505 (2011). [Google Scholar]
- Wang C. N. et al. Macroscopic phase segregation in superconducting K0.73Fe1.67Se2 as seen by muon spin rotation and infrared spectroscopy. Phys. Rev. B 85, 214503 (2012). [Google Scholar]
- Han F. et al. Metastable superconducting state in quenched KxFe2−ySe2. Phil. Mag. 92, 2553–2562 (2012). [Google Scholar]
- Berlijn T., Hirschfeld P. J. & Ku W.. Effective doping and suppression of Fermi surface reconstruction via Fe vacancy disorder in KxFe2−ySe2. Phys. Rev. Lett. 109, 147003 (2013). [DOI] [PubMed] [Google Scholar]
- Liu Y., Xing Q., Dennis K. W., McCallum R. W. & Lograsso T. A.. Evolution of precipitate morphology during heat treatment and its implications for the superconductivity in KxFe1.6+ySe2 single crystals. Phys. Rev. B 86, 144507 (2012). [Google Scholar]
- Speller S. C. et al. Microstructural analysis of phase separation in iron chalcogenide superconductors. Supercond. Sci. Technol. 25, 084023 (2012). [Google Scholar]
- Ricci A. et al. Nanoscale phase separation in the iron chalcogenide superconductor K0.8Fe1.6Se2 as seen via scanning nano-focused X-ray diffraction. Phys. Rev. B 84, 060511(R) (2011). [Google Scholar]
- Weyeneth S. et al. Superconductivity and magnetism in RbxFe2-ySe2: impact of thermal treatment on mesoscopic phase separation. Phys. Rev. B 86, 134530 (2012). [Google Scholar]
- Yang H., Luo H. Q., Wang Z. S. & Wen H. H.. Fishtail effect and the vortex phase diagram of single crystal Ba0.6K0.4Fe2As2. APL 93, 142506 (2008). [Google Scholar]
- Qian T. et al. Absence of a hole like fermi surface for the iron-based K0.8Fe1.7Se2 superconductor revealed by angle-resolved photoemission spectroscopy. Phys. Rev. Lett. 106, 187001 (2011). [DOI] [PubMed] [Google Scholar]
- Li W. et al. KFe2Se2 is the parent compound of K-doped iron selenide superconductors. Phys. Rev. Lett. 109, 057003 (2012). [DOI] [PubMed] [Google Scholar]
- Texier Y. et al. NMR in the 245 iron-selenide Rb0.74Fe1.6Se2: determination of the superconducting phase as iron vacancy-free Rb0.3Fe2Se2. Phys. Rev. Lett. 108, 237002 (2012). [DOI] [PubMed] [Google Scholar]
- Cao C. & Zhang F.. Electronic structure of vacancy-ordered iron-selenide K0.5Fe1.75Se2. Phys. Rev. B 87, 161105 (2013). [Google Scholar]
- Burrard-Lucas M. et al. Enhancement of the superconducting transition temperature of FeSe by intercalation of a molecular spacer layer. Nat. Mater. 12, 15–19 (2012). [DOI] [PubMed] [Google Scholar]
- Ying T. P. et al. Observation of superconductivity at 30~ 46 K in AxFe2Se2 (A=Li, Na, Ba, Sr, Ca, Yb, and Eu). Sci. Rep. 2, 426 (2012). [DOI] [PMC free article] [PubMed] [Google Scholar]
- Scheidt E.-W. et al. Superconductivity at Tc=44 K in LixFe2Se2(NH3)y. Eur. Phys. J. B 85, 279 (2012). [Google Scholar]


