

Abstract
Context:
PTH therapy improves bone mineral density (BMD) and decreases fractures in postmenopausal osteoporosis, but cost and the burden of daily injections limit its use.
Objective:
We evaluated two novel approaches to the use of 6 months of PTH therapy over 2 yr.
Design, Setting, Participants, and Interventions:
We conducted a randomized, double-blinded trial of two combinations of daily PTH(1–84) and monthly ibandronate in 44 postmenopausal women with low bone mass. Participants received either 6 months of concurrent PTH and ibandronate, followed by 18 months of ibandronate (concurrent) or two sequential courses of 3 months of PTH followed by 9 months of ibandronate (sequential) over 2 yr.
Main Outcome Measures:
Bone turnover markers were measured. Areal and volumetric BMD were assessed by dual-energy x-ray absorptiometry and quantitative computed tomography, respectively.
Results:
Over 2 yr, areal BMD at the spine and hip increased similarly in both groups, with 7.5 and 8.2% increases in spine BMD in the concurrent and sequential arms, respectively (difference −0.6%, 95% confidence interval = −3.4–2.1%). Volumetric BMD also increased similarly between groups. With concurrent therapy, mean N-propeptide of type I collagen increased 75% between baseline and month 1 and then declined. With sequential therapy, the second 3-month PTH course increased N-propeptide of type I collagen markedly (209%), although to a lesser absolute degree than the first.
Conclusions:
Six months of PTH(1–84), used over 2 yr with a bisphosphonate in either of our dosing regimens increased BMD substantially. Short PTH courses may provide the benefits of anabolic osteoporosis therapy with reduced burden for patients.
Parathyroid hormone (PTH), administered as PTH(1–34) (teriparatide) or the full-length molecule, increases bone mass and decreases fracture incidence in postmenopausal osteoporosis (1, 2). On a microstructural level, PTH improves trabecular connectivity and increases cortical thickness (3), correcting in part the microarchitectural defects that contribute to skeletal fragility. However, despite its efficacy, use of PTH in clinical practice has been limited by factors including cost and the burden of daily sc injections. As recommended by the U.S. Food and Drug Administration, it is generally reserved for patients with severe osteoporosis or inadequate responses to other agents and used for up to 24 months (4). There is great interest in exploring alternative dosing strategies, with the goals of increasing flexibility for patients, lowering the burden of injections, and containing overall costs.
Alternative dosing strategies may involve concurrent therapy with PTH and an antiresorptive agent, with the theoretical potential to increase bone formation while also decreasing resorption. Previous trials have shown that daily alendronate blunts PTH's anabolic effects (5, 6), and as a result, PTH and antiresorptive medications are generally used one at a time. However, evolving evidence suggests that the frequency of bisphosphonate dosing may be an important factor affecting the bone density response to concurrent therapy and that less frequently dosed bisphosphonates may have different effects (7, 8).
Other proposed dosing strategies involve sequential therapy with PTH and a bisphosphonate. PTH's greatest effects on bone formation happen early, in the first 3–6 months of treatment (9). In addition, it has been shown that a course of PTH should be followed by a bisphosphonate to maintain or enhance the PTH-induced benefits (10). This suggests that short courses of PTH, separated by bisphosphonate administration, may be effective. Others have explored alternative dosing with short cycles of PTH with continuous bisphosphonate therapy (11), but the effects of switching back to PTH alone, after initial sequential therapy, are unknown.
We conducted a 2-yr pilot randomized trial of two novel combinations of PTH(1–84) and monthly ibandronate, each involving just 6 months of PTH(1–84), in postmenopausal women with low bone mass. With the first treatment arm, we asked whether concurrent monthly ibandronate can optimize PTH's anabolic effects. We hypothesized that bone formation markers would increase during concurrent therapy, similarly to that seen with PTH(1–84) alone, in contrast to the blunting of formation markers reported previously with concurrent PTH and daily alendronate. With the second treatment arm, we hypothesized that after an initial short course of PTH(1–84) and subsequent ibandronate, a second short course of PTH(1–84) would increase bone formation markers robustly. Finally, we examined the effects of the two regimens on bone mass, hypothesizing that both of our innovative treatment approaches would increase bone mineral density (BMD) substantially and would represent effective options for clinical practice.
Subjects and Methods
Study participants
We recruited postmenopausal women age 55–85 yr using population-based mailing lists. Women were eligible if they had BMD T-scores less than or equal to −1.5 at the femoral neck, total hip, or lumbar spine, or less than or equal to −1.0 at one of these sites and at least one of the following risk factors: age at least 65 yr, a personal history of postmenopausal fracture, or a maternal history of hip fracture. We excluded women who had been treated with either an oral bisphosphonate or PTH for more than 12 months or for more than 4 wk during the previous 12 months, those with a history of any iv bisphosphonate use, and those who had diseases or took medications known to affect bone metabolism. Other exclusion criteria included serum calcium level higher than 10.2 mg/dl, urinary calcium higher than 300 mg/24 h, 25-hydroxyvitamin D below 15 ng/ml, and calculated creatinine clearance below 40 ml/min. The institutional review board approved the study protocol, and participants provided written informed consent.
Treatments
The study treatments were PTH(1–84) (100 μg daily; NPS Pharmaceuticals, Bedminster, NJ) and ibandronate (150 mg monthly; Genentech, South San Francisco, CA). Women injected PTH(1–84) or matching placebo sc in the abdomen in the morning using a cartridge-loaded pen. Ibandronate or matching placebo was swallowed in the morning with a full glass of water after an overnight fast. All participants took calcium citrate with vitamin D and a multivitamin, totaling 600–625 mg calcium and 500–900 IU vitamin D daily and were asked not to take other calcium- or vitamin D-containing supplements.
Study design
After a 2-wk run-in period of placebo injections and calcium and vitamin D supplementation, women were randomly assigned to one of two treatment regimens to be followed for 2 yr (Fig. 1). Half the participants were assigned to 6 months of concurrent daily PTH(1–84) plus monthly ibandronate, followed by ibandronate alone for 18 months (referred to as concurrent). The other half were assigned to two sequential courses of 3 months of PTH(1–84) followed by 9 months of ibandronate (referred to as sequential), totaling 24 months of therapy (6 months of PTH) in both groups.
Fig. 1.
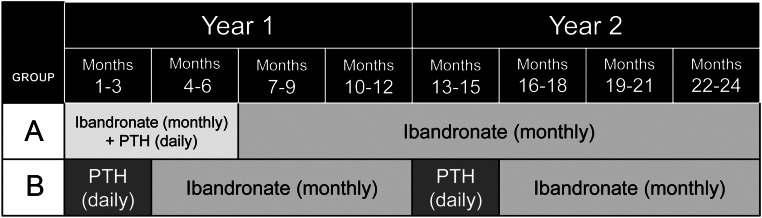
PTH and Ibandronate Combination Study (PICS) treatment groups. Participants, clinicians, and investigators were blinded to treatment group assignment through the use of placebo injections and tablets.
A blocked randomization scheme was used, with randomization numbers created in blocks of four. Participants, clinicians, and investigators were blinded to treatment group assignment through the use of placebo injections and tablets. An unblinded safety officer reviewed data midway through the trial.
The study was sponsored by Genentech through an investigator-initiated grant. The sponsor was involved in study design but not in data analysis or interpretation or in manuscript writing. Other pharmaceutical companies provided other study products but had no role in trial conduct.
Efficacy outcome variables
Areal BMD (aBMD) (grams per square centimeter) at the lumbar spine, hip, and distal one third radius was assessed by dual-energy x-ray absorptiometry (DXA) (Hologic Discovery W densitometer, Bedford, MA) at baseline and 6, 12, 18, and 24 months. The precision for aBMD is 1.0%. Volumetric BMD (vBMD) (grams per cubic centimeter), and bone geometry in trabecular and cortical compartments were assessed by quantitative computed tomography (QCT) at the spine and hip. Findings on QCT, performed at baseline and 12 and 24 months, were evaluated according to methods described previously (Mindways Software, Austin, TX) (12–14). The left hip was used for analysis. The precision for trabecular spine vBMD measurement is 1.0%.
After an overnight fast, serum was drawn at baseline and 1, 3, 6, 12, 15, 18, and 24 months. Samples were stored at −70 C until batch assayed in a central laboratory (University of Sheffield, Sheffield, UK). Serum N-propeptide of type I collagen (PINP) and C-terminal telopeptide of type I collagen (CTX) were measured by electrochemiluminescent immunoassay (Roche Cobas e411 Analyzer; Roche Diagnostics, Basel, Switzerland) with interassay coefficients of variation (CV) of 2.9 and 3.4%, respectively. Bone-specific alkaline phosphatase (BAP) was measured by paramagnetic particle immunoassay (Access 2; Beckman Coulter, Brea, CA) with interassay coefficient of variation of 5.2%.
Adherence, safety assessment, and adverse events
Treatment adherence was assessed by written diary. Clinical staff also monitored return of unused cartridges and tablets.
Serum calcium concentration was measured at each blood draw. Blood was drawn approximately 24 h after the last injection, and participants were instructed not to inject on mornings blood was drawn. Twenty-four-hour urinary calcium and creatinine excretion were measured at baseline and after 3 and 15 months. Specific ordered algorithms were employed for hypercalcemia (defined as serum calcium >10.4 mg/dl) and hypercalciuria (urinary calcium >400 mg/24 h or urinary calcium/creatinine ratio >0.4). These algorithms, used in a previous trial of PTH(1–84) (15), included repeat assessment, discontinuation of calcium supplementation, reduction of PTH(1–84) dose, and discontinuation of PTH(1–84) if necessary.
Participants were questioned at each visit about adverse events, which were classified by investigators blinded to treatment.
Statistical analysis
Analyses were performed according to the intention-to-treat principle. The primary study objective was to compare the change in bone formation markers over 3 months of treatment with concurrent PTH(1–84) and monthly ibandronate to the change in bone formation markers with PTH(1–84) alone. A sample size of 20 participants per group was estimated to provide 80% power to detect a change of 25 ng/ml in PINP, assuming the sd of 40 ng/ml observed previously with concurrent PTH(1–84) and daily alendronate (5). One secondary study objective was to examine whether, after an initial 3-month course of PTH(1–84) and subsequent ibandronate, a second 3-month course of PTH(1–84) increases bone formation markers as robustly as the first. Another secondary objective was to compare 2-yr changes in spinal aBMD by DXA and trabecular spine vBMD by QCT between treatment groups. A sample size of 20 per group was estimated to provide 80% power to detect differences of 2.5 and 6% between changes in those DXA and QCT measures, respectively. To account for potential dropout, 22 participants were randomized into each group.
Means within treatment groups, 95% confidence intervals (CI), and t tests for percent change from baseline were used to assess the significance of changes within each group. Because bone turnover markers and changes in markers were not normally distributed, we analyzed changes in log-transformed levels and report geometric means, back-transformed log ratios, and 95% CI or median absolute changes and interquartile ranges (IQR). Changes in outcome variables were compared between treatment groups using χ2, Mann-Whitney U, and Student's t tests. For all comparisons, a significance level of 0.05 was used, without adjustment for multiple comparisons. Statistical analyses were performed using SAS software (SAS Institute, Cary, NC).
Results
Enrollment, baseline participant characteristics, and adherence to treatment
We mailed approximately 33,000 recruitment letters to women in the San Francisco Bay Area. We fielded approximately 1100 phone calls, and 226 women were interested and eligible for additional screening. Of 164 who attended screening visits, 44 enrolled (Fig. 2).
Fig. 2.

Enrollment and outcomes.
At baseline, mean age was 62 yr (Table 1). Participants were predominantly Caucasian. Mean spinal T-score was −1.5 ± 1.1. Fifty-nine percent had a personal history of fracture.
Table 1.
Baseline characteristics of study participants
| Concurrent (n = 22) | Sequential (n = 22) | P value (between groups) | |
|---|---|---|---|
| Age (yr) | 62.7 ± 4.1 | 61.2 ± 4.1 | 0.23 |
| Race [n (%)] | 0.11 | ||
| Native American | 1 (5) | 0 (0) | |
| Asian | 5 (23) | 1 (5) | |
| White | 16 (73) | 21 (96) | |
| Body mass index (kg/m2) | 23.8 ± 3.8 | 25.3 ± 3.9 | 0.21 |
| History of fracture (self-report) (%) | 12 (55) | 14 (64) | 0.54 |
| BMD T-scores | |||
| Femoral neck | −1.6 ± 0.7 | −1.8 ± 0.5 | 0.44 |
| Total hip | −1.2 ± 0.6 | −1.5 ± 0.7 | 0.27 |
| Total spine | −1.4 ± 1.0 | −1.7 ± 1.2 | 0.33 |
| 25-Hydroxyvitamin D (ng/ml) | 41.1 ± 15.6 | 41.5 ± 14.6 | 0.94 |
| Biochemical markers of bone turnover | |||
| Serum PINP (ng/ml)a | 54.8 ± 20.5 | 55.1 ± 17.8 | 0.96 |
| Serum CTX (ng/ml)a | 0.50 ± 0.28 | 0.48 ± 0.24 | 0.73 |
Values are means ± sd or counts (percentages).
Premenopausal reference range (95% CI) for PINP is 38.7 (16.3–78.2) ng/ml. Premenopausal reference range (95% CI) for CTX is 0.317 (0.114–0.628) ng/ml (20).
One participant withdrew completely from the trial. Six participants (three from each group) discontinued one or both study medications, citing discomfort or inconvenience, but continued to attend study visits (Fig. 2). Of all participants, 93% adhered to at least 80% of their monthly pills, and 82% adhered to at least 80% of their injections. There was no difference in adherence between treatment groups.
BMD and structure
Over the first 6 months of treatment, aBMD measured by DXA increased similarly in the two treatment groups [with 6 months of concurrent therapy or with 3 months of PTH(1–84) alone followed by 3 months of ibandronate alone].
Over 2 yr, aBMD at the lumbar spine measured by DXA increased significantly and similarly in both groups, with increases of 7.5 and 8.2% with concurrent and sequential therapy, respectively (Fig. 3 and Table 2). Total hip and femoral neck aBMD increased similarly in the two groups. The aBMD at the distal one third radius decreased, with the decline statistically significant within the sequential group but with no difference in between-group changes.
Fig. 3.

Mean percent changes over 2 yr in aBMD at the spine (A), total hip (B), and femoral neck (C), assessed by DXA, and in vBMD of the trabecular spine (D), cortical total hip (E), and trabecular total hip (F), assessed by QCT.
Table 2.
Mean 2-yr percent changes in BMD and structural parameters by treatment group
| Concurrent |
Sequential |
Difference (95% CI) | P value (between groups) | |||
|---|---|---|---|---|---|---|
| % | P value | % | P value | |||
| aBMD (DXA) | ||||||
| Total spine | 7.5 ± 4.5 | <0.001 | 8.2 ± 4.6 | <0.001 | −0.6 (−3.4–2.1) | 0.64 |
| Total hip | 3.6 ± 3.0 | <0.001 | 3.0 ± 3.3 | <0.001 | 0.5 (−1.4–2.5) | 0.58 |
| Femoral neck | 2.9 ± 3.7 | <0.01 | 1.7 ± 4.8 | 0.08 | 1.2 (−1.4–3.9) | 0.34 |
| 1/3 distal radius | −0.6 ± 2.6 | 0.33 | −1.6 ± 3.3 | 0.02 | 1.0 (−0.9–2.8) | 0.31 |
| vBMD (QCT) | ||||||
| Trabecular spine | 12.5 ± 11.2 | 0.001 | 13.7 ± 21.1 | <0.001 | −1.2 (−11.5–9.2) | 0.82 |
| Total hip (integral) | 5.7 ± 9.5 | <0.01 | 10.9 ± 9.1 | <0.001 | −5.2 (−11.0–0.5) | 0.07 |
| Total hip (cortical) | 2.1 ± 5.4 | 0.04 | 4.6 ± 3.7 | <0.01 | −2.5 (−5.4–0.3) | 0.08 |
| Total hip (trabecular) | 1.8 ± 3.5 | 0.08 | 2.5 ± 5.8 | 0.02 | −0.7 (−3.6–2.2) | 0.65 |
| Femoral neck (integral) | 4.9 ± 7.0 | <0.01 | 7.5 ± 8.8 | <0.001 | −2.5 (−7.4–2.4) | 0.30 |
| Femoral neck (cortical) | 2.2 ± 7.3 | 0.11 | 1.9 ± 5.2 | 0.17 | 0.3 (−3.6–4.2) | 0.88 |
| Femoral neck (trabecular) | 1.9 ± 5.7 | 0.22 | 5.1 ± 8.3 | <0.01 | −3.2 (−7.5–1.2) | 0.15 |
| Femoral neck structure (QCT) | ||||||
| Cross-sectional area (CSA) | 5.8 ± 19.7 | 0.10 | −4.5 ± 11.6 | 0.22 | 10.3 (0.3–20.3) | 0.04 |
| CSA (cortical) | 16.3 ± 37.8 | 0.01 | 5.2 ± 12.2 | 0.41 | 11.1 (−6.4–28.6) | 0.21 |
| CSA (trabecular) | 3.9 ± 17.3 | 0.24 | −6.1 ± 13.3 | 0.08 | 10.0 (0.4–19.5) | 0.04 |
| Cortical thickness | 12.4 ± 25.2 | <0.01 | 8.7 ± 12.3 | 0.05 | 3.7 (−8.6–16.0) | 0.55 |
| Buckling ratio | −6.3 ± 13.0 | 0.03 | −9.3 ± 12.4 | <0.01 | 3.0 (−4.8–10.9) | 0.44 |
Values for within-group changes are means ± sd.
Spinal trabecular vBMD measured by QCT increased significantly in both treatment groups over 2 yr (Fig. 3 and Table 2). Changes were similar between groups, with increases of 12.5 and 13.7% in the concurrent and sequential groups, respectively. At the total hip, cortical, trabecular, and integral (cortical plus trabecular) vBMD increased in both groups. At the femoral neck, integral vBMD and cortical thickness increased significantly in both groups. There was a suggestion of a differential effect of treatment on femoral neck cross-sectional area, favoring the concurrent group (P = 0.04). Femoral neck buckling ratio, a measure of cortical instability, decreased similarly in the two groups (a favorable change).
Bone turnover markers
In the concurrent group [concurrent PTH(1–84) and monthly ibandronate for 6 months], the geometric mean PINP level increased from 55 to 96 ng/ml over the first month (a 75% increase, 95% CI = 43–113%), and it remained elevated at 78 ng/ml at month 3 (a 42% elevation above baseline, 95% CI = 9–85%) (Fig. 4A). This month-3 mean was lower than that of the sequential group (P < 0.01 for between-group difference). The concurrent group's mean PINP level did not remain elevated with additional concurrent therapy but rather fell back to 62 ng/ml by 6 months. Mean BAP was increased at month 1 with concurrent therapy but had declined by month 3 (Fig. 4B). Mean osteocalcin (OC) was also increased at month 1 with concurrent therapy, continued to rise to month 3, and then declined but remained above baseline at month 6 (Fig. 4C). In contrast to the markers of formation, bone resorption marker CTX did not change during concurrent therapy (Fig. 4D).
Fig. 4.

Mean serum PINP (A), BAP (B), OC (C), and CTX (D) during therapy. Visit means were log-transformed for analysis and then back-transformed for presentation.
In the sequential group [two sequential courses of 3 months of PTH(1–84) alone, each followed by 9 months of ibandronate alone], the geometric mean PINP level increased from 55 ng/ml at baseline to 157 ng/ml during the first 3-month course of PTH(1–84) (Fig. 4A). This represented a mean 186% increase (95% CI = 119–275%) or a median absolute change of 83 ng/ml (IQR = 54–195 ng/ml). During the subsequent 9 months of ibandronate, mean PINP dropped to a level significantly below baseline. With the second 3-month course of PTH(1–84), mean PINP rose from 25 to 77 ng/ml (a mean 209% increase, 95% CI = 138–300%, or a median absolute change of 47 ng/ml, IQR= 21-87 ng/ml). The percent increases seen with the two 3-month courses were not significantly different. Mean BAP increased 57% (by 5 μg/liter) during the first 3-month course of PTH(1–84) and then 49% (by 3 μg/liter) during the second course (Fig. 4B). Mean OC increased 135% (by 30 ng/ml) and 89% (by 16 ng/ml) during the first and second courses, respectively (Fig. 4C). Mean CTX did not change during the first 3-month course of PTH(1–84) but then rose with the second 3-month course (a 69% increase) (Fig. 4D).
Safety and adverse events
Seven women (18% of the concurrent group, 14% of the sequential group) met criteria for hypercalcemia. Only one woman (in the concurrent group) had a serum calcium value above 11.2 mg/dl (2.80 mmol/liter); when hypercalcemia persisted, she required a reduction in the frequency of PTH(1–84). Three women (9% of the concurrent group and 5% of the sequential group) met criteria for hypercalciuria. No between-group differences were statistically significant. Serum and urinary levels returned to normal after either a confirmatory measurement or the discontinuation of calcium supplementation, except in the one woman requiring the PTH(1–84) frequency reduction.
There were no significant between-group differences in adverse events. The most commonly reported adverse events were nausea (reported by 32% of participants in each group) and injection site bruising or soreness (32% of participants). Two participants in each group experienced serious adverse events, but neither were considered related to study treatments.
Discussion
Our pilot randomized trial was designed to explore two novel combinations of PTH(1–84) and monthly ibandronate in postmenopausal women with low bone mass. Each combination involved 6 months total of PTH(1–84) over 24 months of follow-up, considerably less than the 18 or 24 months of PTH injections often used in current clinical practice. Our motivation in designing the trial was to investigate regimens that may take advantage of PTH's anabolic effects while increasing flexibility for patients, minimizing the burden of daily injections, and reducing costs. Although we found little overall difference between regimens with respect to BMD effects, we found that both of our treatment combinations resulted in substantial 2-yr increases in BMD and thus represent potentially promising treatment options.
Six months of PTH(1–84) used over 2 yr
The BMD increases in both of our treatment groups were considerable, even if not meaningfully different between groups. All together, our participants experienced a mean 2-yr increase in spinal aBMD of 7.8% (7.5 and 8.2% in the concurrent and sequential groups, respectively), and a 2-yr increase in total hip aBMD of 3.3%. For comparison, 18 months of continuous PTH(1–84) in the Treatment of Osteoporosis with Parathyroid Hormone (TOP) trial resulted in aBMD increases of 6.5% at the spine and 1.0% at the total hip (2). In the trial of the effects of PTH(1–34) vs. placebo conducted by Neer et al. (1), 18 months of continuous 20 μg daily PTH(1–34) increased aBMD by 9.7 and 2.6% at the spine and total hip, respectively. Of course, differences in the cohorts studied, in study conduct, and in assessment of outcome variables may contribute to differences in responses between trials. With that in mind, however, with only 6 months of PTH, we were able to achieve comparable increases in aBMD compared with much longer treatment. The aBMD increases may not reflect comparable decreases in fracture risk, and furthermore, the spinal vBMD increase observed in our trial was only about half that seen with 12 months of PTH(1–84) alone in the PTH and Alendronate (PaTH) trial (5) and one-third that seen with 18 months of PTH(1–84) in the Treatment of Osteoporosis with Parathyroid Hormone (TOP) trial (2). Nevertheless, our results suggest that a shorter duration of PTH, used strategically with a bisphosphonate, could represent an important alternative approach that warrants further study.
Concurrent PTH(1–84) and ibandronate
Our trial allowed us to test hypotheses within each treatment arm in addition to comparing the 2 arms. Within the concurrent treatment arm, we asked whether bone formation markers would increase with concurrent PTH(1–84) and monthly ibandronate, in contrast to the blunting of formation markers reported previously with concurrent PTH(1–84) and daily alendronate in the PaTH study (5). The hypothesis that a less frequently dosed bisphosphonate would combine more favorably with anabolic therapy originated in preclinical studies. Gasser et al. demonstrated that rats administered PTH and multiple injections of alendronate had blunting of the anabolic response, whereas those administered PTH and a single IV dose of alendronate did not (7).
Our results indicate that concurrent monthly ibandronate may blunt the effects of PTH(1–84) somewhat less than daily alendronate, particularly in the first 3 months of treatment. In our study, PINP rose by 75% between baseline and month 1 with concurrent therapy, compared with only 49% in the PaTH study (a comparison to be made with caution because the regimens were not studied head to head) (5). At month 3, we saw a net increase of 42% above baseline, compared with a nonsignificant 3% in PaTH. However, despite the longer duration of the bone formation marker response in our study, the rise in markers with concurrent therapy was still substantially lower than that seen with PTH(1–84) alone at 3 months in our sequential therapy group. These findings are generally similar to those of a recent 1-yr trial of zoledronic acid (administered as a single iv infusion), daily PTH(1–34) injections, or their combination in postmenopausal women, in which combination therapy did result in some blunting of PINP compared with PTH(1–34) alone (8). Taken all together, our results suggest that although there may be some differences in interaction between PTH and a bisphosphonate when the bisphosphonate is dosed less frequently, monthly ibandronate still blunts the anabolic response to PTH compared with PTH alone.
Repeated courses of PTH(1–84)
Within the sequential treatment arm, we asked whether, after an initial 3-month course of PTH(1–84) alone and subsequent ibandronate, a second 3-month course of PTH would increase bone formation markers as robustly as the first. As expected, bone formation markers increased markedly with the first 3 months of PTH(1–84) alone. After 9 months of ibandronate, bone formation markers were at new and lower levels than their baselines, and from there they rose with the second course of PTH(1–84) alone. The increases with the second PTH(1–84) course were smaller in absolute magnitude than the increases with the first course, but the percent increases were nonetheless very large (e.g. a mean 209% increase in PINP). Ours is the first trial to examine retreatment with PTH alone after a course of a bisphosphonate alone; Cosman et al. (11) evaluated a series of 3-month courses of PTH(1–34), but that was in the setting of ongoing daily alendronate.
It is hard to judge whether the absolute rise or the relative rise in bone formation markers is more reflective of anabolic activity and fracture benefit. It has been shown previously that bone formation marker response to PTH therapy may be attenuated by previous bisphosphonate exposure (16–18), and this attenuation has been examined both in terms of absolute and ratio changes from baseline (16). A study of PTH(1–34) retreatment in the setting of ongoing alendronate therapy identified a smaller absolute increase in mean PINP during retreatment than during the original course but a similar increase in OC (19). Overall, the substantial increases in bone formation markers in our trial suggest that retreatment with a second short course of PTH(1–84) after ibandronate does stimulate osteoblast activity and an anabolic response.
Summary and conclusions
Our study is limited by the absence, for cost and feasibility reasons, of a treatment arm administered PTH(1–84) alone, ibandronate alone, or placebo alone for 2 yr. Our study involved PTH(1–84), and we cannot say definitively that our findings would apply to regimens involving PTH(1–34) (teriparatide). Likewise, we used ibandronate because its once-monthly dosing was central to our hypothesis about concurrent therapy, and we do not know whether our findings in the sequential therapy group would apply to regimens involving short courses of PTH separated by a differently dosed bisphosphonate. We also cannot determine whether our trial's results may reflect inherent characteristics of ibandronate itself and whether bisphosphonates with different remodeling potencies might yield different results. Because our small exploratory study was powered for change in bone turnover markers, there may have been small between-group differences in BMD changes that we were not able to detect. Finally, our participants had low bone mass, but most were not osteoporotic, and this could limit the generalizability of our findings.
Strengths of our study include excellent study medication adherence and follow-up. We ensured rigorous blinding to treatment group assignment through the use of placebo injections and tablets. Additional strengths are our measurement of multiple bone formation markers, and vBMD as well as aBMD.
In conclusion, concurrent use of PTH(1–84) and monthly ibandronate does result in increases in bone formation markers, but those increases are blunted compared with the effects of PTH(1–84) alone. Separately, after an initial 3-month course of PTH(1–84) and subsequent ibandronate therapy, a second course of PTH(1–84) significantly increases bone formation markers. Overall, we found that just 6 months of PTH(1–84), used over 2 yr with a bisphosphonate, increase BMD substantially. One potential implication is that short courses of PTH may provide the benefits of anabolic therapy but with lower overall cost and a lower burden of injections than longer-duration therapy. Our results, together with those of other BMD and bone turnover marker endpoint studies of cyclic PTH therapy, suggest that cyclic PTH therapy should be tested in a longer and larger fracture endpoint trial.
Acknowledgments
We thank Lucy Wu, Laurel Denton, and Michaela Rahorst for their roles in study direction and data coordination; Rayshawnda Davis, Natasha Rathbun, Andrea Hacker, and Makani da Silva for study coordination and DXA scan acquisition at the clinical site; Melissa Guan and Thelma Munoz for their roles in QCT coordination; Aldric Chau for QCT image analysis; and Fatma Gossiel for her analysis of bone turnover markers.
The PICS trial was supported by an investigator-initiated grant (to D.M.B.) from Genentech, Inc., a member of the Roche group. The sponsor was involved in study design and the decision to approve the final article, but it was not involved in the collection, analysis, or interpretation of data or in the writing of the article. Study drugs were supplied by NPS Pharmaceuticals, Inc. [PTH(1–84)], Genentech (ibandronate), and Bayer (calcium citrate and D3). Reagents for bone turnover marker assays were provided by Roche Diagnostics. The authors have full control of all primary data. Additional support was provided by the Department of Veterans Affairs, through the Research Enhancement Award Program (to A.L.S. and D.M.S.) and a Career Development Award (to A.L.S.).
Disclosure Summary: A.L.S. and J.H. have nothing to disclose. D.E.S. has received research support from Amgen and Novartis. L.P. has consulted for NPS and Nycomed. R.E. has received research support from Amgen, Lilly, Warner Chilcott, and AstraZeneca and has consulted for Amgen, AstraZeneca, GSK, Medtronics, Nastech, Nestle, Fonterra Brands, Novartis, Ono Pharma, Osteologix, Pfizer, Lilly, Sanofi Aventis, Tethys, Unilever, Unipath, and Inverness Medical. D.M.S. has received research support from NPS and has consulted for Lilly. D.M.B. has received research support from Amgen, Merck, Novartis, and Roche and has consulted for Nycomed.
Footnotes
- aBMD
- Areal BMD
- BAP
- bone-specific alkaline phosphatase
- BMD
- bone mineral density
- CI
- confidence interval
- CTX
- C-terminal telopeptide of type I collagen
- DXA
- dual-energy x-ray absorptiometry
- IQR
- interquartile ranges
- OC
- osteocalcin
- PaTH
- PTH and Alendronate
- PINP
- N-propeptide of type I collagen
- QCT
- quantitative computed tomography
- vBMD
- volumetric BMD.
References
- 1. Neer RM, Arnaud CD, Zanchetta JR, Prince R, Gaich GA, Reginster JY, Hodsman AB, Eriksen EF, Ish-Shalom S, Genant HK, Wang O, Mitlak BH. 2001. Effect of parathyroid hormone (1–34) on fractures and bone mineral density in postmenopausal women with osteoporosis. N Engl J Med 344:1434–1441 [DOI] [PubMed] [Google Scholar]
- 2. Greenspan SL, Bone HG, Ettinger MP, Hanley DA, Lindsay R, Zanchetta JR, Blosch CM, Mathisen AL, Morris SA, Marriott TB. 2007. Effect of recombinant human parathyroid hormone (1–84) on vertebral fracture and bone mineral density in postmenopausal women with osteoporosis: a randomized trial. Ann Intern Med 146:326–339 [DOI] [PubMed] [Google Scholar]
- 3. Dempster DW, Cosman F, Kurland ES, Zhou H, Nieves J, Woelfert L, Shane E, Plavetiæ K, Müller R, Bilezikian J, Lindsay R. 2001. Effects of daily treatment with parathyroid hormone on bone microarchitecture and turnover in patients with osteoporosis: a paired biopsy study. J Bone Miner Res 16:1846–1853 [DOI] [PubMed] [Google Scholar]
- 4. Hodsman AB, Bauer DC, Dempster DW, Dian L, Hanley DA, Harris ST, Kendler DL, McClung MR, Miller PD, Olszynski WP, Orwoll E, Yuen CK. 2005. Parathyroid hormone and teriparatide for the treatment of osteoporosis: a review of the evidence and suggested guidelines for its use. Endocr Rev 26:688–703 [DOI] [PubMed] [Google Scholar]
- 5. Black DM, Greenspan SL, Ensrud KE, Palermo L, McGowan JA, Lang TF, Garnero P, Bouxsein ML, Bilezikian JP, Rosen CJ. 2003. The effects of parathyroid hormone and alendronate alone or in combination in postmenopausal osteoporosis. N Engl J Med 349:1207–1215 [DOI] [PubMed] [Google Scholar]
- 6. Finkelstein JS, Hayes A, Hunzelman JL, Wyland JJ, Lee H, Neer RM. 2003. The effects of parathyroid hormone, alendronate, or both in men with osteoporosis. N Engl J Med 349:1216–1226 [DOI] [PubMed] [Google Scholar]
- 7. Gasser JA, Ingold P, Venturiere-Rebmann A, Green JR, Chronic subcutaneous, but not single intravenous, dosing of rats with bisphosphonates results in reduced bone anabolic response to PTH. Program of the 28th Annual Meeting of the American Society for Bone and Mineral Research, Philadelphia, PA, 2006, poster FR386 (Abstract SA386) [Google Scholar]
- 8. Cosman F, Eriksen EF, Recknor C, Miller PD, Guañabens N, Kasperk C, Papanastasiou P, Readie A, Rao H, Gasser JA, Bucci-Rechtweg C, Boonen S. 2011. Effects of intravenous zoledronic acid plus subcutaneous teriparatide [rhPTH(1–34)] in postmenopausal osteoporosis. J Bone Miner Res 26:503–511 [DOI] [PubMed] [Google Scholar]
- 9. Kurland ES, Cosman F, McMahon DJ, Rosen CJ, Lindsay R, Bilezikian JP. 2000. Parathyroid hormone as a therapy for idiopathic osteoporosis in men: effects on bone mineral density and bone markers. J Clin Endocrinol Metab 85:3069–3076 [DOI] [PubMed] [Google Scholar]
- 10. Black DM, Bilezikian JP, Ensrud KE, Greenspan SL, Palermo L, Hue T, Lang TF, McGowan JA, Rosen CJ. 2005. One year of alendronate after one year of parathyroid hormone (1–84) for osteoporosis. N Engl J Med 353:555–565 [DOI] [PubMed] [Google Scholar]
- 11. Cosman F, Nieves J, Zion M, Woelfert L, Luckey M, Lindsay R. 2005. Daily and cyclic parathyroid hormone in women receiving alendronate. N Engl J Med 353:566–575 [DOI] [PubMed] [Google Scholar]
- 12. Lang TF, Li J, Harris ST, Genant HK. 1999. Assessment of vertebral bone mineral density using volumetric quantitative CT. J Comput Assist Tomogr 23:130–137 [DOI] [PubMed] [Google Scholar]
- 13. Khoo BC, Brown K, Cann C, Zhu K, Henzell S, Low V, Gustafsson S, Price RI, Prince RL. 2009. Comparison of QCT-derived and DXA-derived areal bone mineral density and T scores. Osteoporos Int 20:1539–1545 [DOI] [PubMed] [Google Scholar]
- 14. Poole KE, Mayhew PM, Rose CM, Brown JK, Bearcroft PJ, Loveridge N, Reeve J. 2010. Changing structure of the femoral neck across the adult female lifespan. J Bone Miner Res 25:482–491 [DOI] [PubMed] [Google Scholar]
- 15. Antoniucci DM, Sellmeyer DE, Bilezikian JP, Palermo L, Ensrud KE, Greenspan SL, Black DM. 2007. Elevations in serum and urinary calcium with parathyroid hormone (1–84) with and without alendronate for osteoporosis. J Clin Endocrinol Metab 92:942–947 [DOI] [PMC free article] [PubMed] [Google Scholar]
- 16. Miller PD, Delmas PD, Lindsay R, Watts NB, Luckey M, Adachi J, Saag K, Greenspan SL, Seeman E, Boonen S, Meeves S, Lang TF, Bilezikian JP. 2008. Early responsiveness of women with osteoporosis to teriparatide after therapy with alendronate or risedronate. J Clin Endocrinol Metab 93:3785–3793 [DOI] [PMC free article] [PubMed] [Google Scholar]
- 17. Boonen S, Marin F, Obermayer-Pietsch B, Simões ME, Barker C, Glass EV, Hadji P, Lyritis G, Oertel H, Nickelsen T, McCloskey EV. 2008. Effects of previous antiresorptive therapy on the bone mineral density response to two years of teriparatide treatment in postmenopausal women with osteoporosis. J Clin Endocrinol Metab 93:852–860 [DOI] [PubMed] [Google Scholar]
- 18. Ettinger B, San Martin J, Crans G, Pavo I. 2004. Differential effects of teriparatide on BMD after treatment with raloxifene or alendronate. J Bone Miner Res 19:745–751 [DOI] [PubMed] [Google Scholar]
- 19. Cosman F, Nieves JW, Zion M, Barbuto N, Lindsay R. 2009. Retreatment with teriparatide one year after the first teriparatide course in patients on continued long-term alendronate. J Bone Miner Res 24:1110–1115 [DOI] [PMC free article] [PubMed] [Google Scholar]
- 20. Glover SJ, Gall M, Schoenborn-Kellenberger O, Wagener M, Garnero P, Boonen S, Cauley JA, Black DM, Delmas PD, Eastell R. 2009. Establishing a reference interval for bone turnover markers in 637 healthy, young, premenopausal women from the United Kingdom, France, Belgium, and the United States. J Bone Miner Res 24:389–397 [DOI] [PubMed] [Google Scholar]