Abstract
Dapagliflozin is a sodium–glucose co-transporter 2 inhibitor in development for the treatment of type 2 diabetes mellitus. A semi-mechanistic population pharmacokinetic (PK) model was developed for dapagliflozin and its inactive metabolite dapagliflozin 3-O-glucuronide (D3OG) with emphasis on renal and hepatic contribution to dapagliflozin metabolism. Renal and hepatic impairment decreased the clearance of dapagliflozin to D3OG and the clearance of D3OG. The fraction of D3OG formed via the renal route decreased from 40–55% in subjects with normal renal function (creatinine clearance (CLcr) > 80 ml/min) to 10% in subjects with severe renal insufficiency (CLcr = 13 ml/min). The model-based simulations suggested that the increase of systemic exposure (AUCss) of dapagliflozin and D3OG was less than twofold in subjects with mild or moderate renal impairment. This population modeling analysis presents a useful approach to evaluate the impact of renal and hepatic function on the PK of dapagliflozin.
Dapagliflozin is a therapy in development for the treatment of type 2 diabetes mellitus (T2DM). Under normal conditions, ~180 g of glucose is filtered through the renal glomerulus per day, and virtually all of this is reabsorbed into blood by the proximal tubules with the major facilitator of reabsorption being the sodium–glucose cotransporter.1 Dapagliflozin acts reversibly and specifically on the sodium–glucose co-transporter 2 in the proximal tubules of the kidney to inhibit the reabsorption of glucose and to promote urinary glucose excretion.2
Dapagliflozin is rapidly absorbed following oral administration with an absolute oral bioavailability of 78%.3 The systemic exposures of dapagliflozin increase in a dose-dependent manner for doses ranging from 0.1 to 500 mg. The half-life of dapagliflozin (12.5 h) and the corresponding sustained inhibition of urinary glucose reabsorption over 24-h after dose at the proposed clinical dose (10 mg) is amenable to once-daily dosing.2 Dapagliflozin is metabolized by uridine diphosphate glucuronosyltransferase (UGT) 1A9 to dapagliflozin 3-O-glucuronide (D3OG identified as M15 in chromatography), which is 2600-fold less potent than the parent drug with regard to sodium–glucose co-transporter 2 inhibition. Following a single 50-mg dose of [14C]-dapagliflozin, D3OG and dapagliflozin represented >95% of the total radioactivity in all plasma samples. In healthy subjects, ~61% of the administered dose of dapagliflozin is recovered in urine as D3OG.4 Less than 2% of the administered dose of dapagliflozin is excreted in urine as unchanged dapagliflozin.2
Approximately 40% of adults with T2DM have comorbid chronic renal disease, and T2DM is widely regarded as the leading cause of end-stage renal disease.5 Individuals with T2DM have a higher incidence of liver function test abnormalities than those without T2DM, and therefore, hepatic impairment (HI) is also an important consideration in this population.6 A pharmacokinetic (PK)/pharmacodynamic (PD) study of dapagliflozin in renal impairment (NCT00554450) and a PK study in HI have been described.7,8,9 In the renal impairment study, systemic exposure of both dapagliflozin and D3OG increased incrementally with decreased renal function. The PK of dapagliflozin in patients with T2DM and normal renal function are comparable to that observed in healthy subjects.2 Compared with healthy subjects and T2DM subjects with normal renal function (creatinine clearance (CLcr) > 80 ml/min), the dapagliflozin exposure (area under the concentration time curve from time zero to infinity (AUC0–∞)) increased by 28% in patients with T2DM and mild renal impairment (CLcr > 50 and CLcr ≤ 80 ml/min), by 52% in patients with T2DM and moderate renal impairment (CLcr ≥ 30 and CLcr ≤ 50 ml/min), and by 75% in patients with T2DM and severe renal impairment not on hemodialysis (CLcr < 30 ml/min). The categorization of various stages of renal impairment was trial defined; however, the Kidney Disease Outcomes Quality Initiative clinical practice guidelines for chronic kidney disease define mild, moderate, and severe renal impairment as glomerular filtration rate of 60–89, 30–59, and 15–29 ml/min, respectively.10
Glucuronide conjugation is usually preserved in patients with hepatic insufficiency until the disease is severe (Child-Pugh Class C). In these cases, increased systemic exposure of dapagliflozin and decreased D3OG would be expected. In the HI study, patients with mild, moderate, and severe HI showed increases in the D3OG AUC0–∞ by 6, 100, and 29%, respectively, compared with age-, weight-, gender-, and smoking status–matched healthy subjects. These values were highly dependent on the calculated CLcr of each group.
Furthermore, as UGT1A9 is expressed in both the kidney and the liver,11 we postulated that the UGT1A9-mediated metabolic clearance of dapagliflozin occurs in both of these organs, and that both hepatic and renal impairment may impact the metabolic clearance of dapagliflozin. Therefore, we developed a semi-mechanistic nonlinear mixed effects model to gain further insights into the effects of renal and HI on the population PK of dapagliflozin and D3OG.
Results
Base model
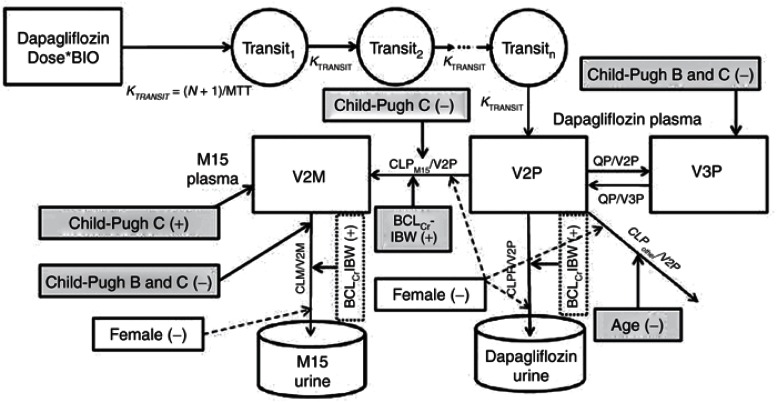
The structural model that best described the plasma and urine data of dapagliflozin and D3OG simultaneously is shown in Figure 1. The parameter estimates of the base model are provided in Table 1.
Figure 1.
The structural and covariate model to describe the renal and nonrenal elimination of dapagliflozin and D3OG in healthy subjects, T2DM subjects with normal or impaired renal function, and patients with hepatic impairment. BCLCrIBW, baseline creatinine clearance calculated using ideal body weight; CLM, renal clearance of D3OG; BIO, bioavailability; CLPM15, metabolic clearance of dapagliflozin to D3OG; CLPother, metabolic clearance of dapagliflozin to unmeasured metabolites; CLPrenal, renal clearance of unchanged dapagliflozin to urine; MTT, mean transit time; N, number of transit compartments; QP, intercompartmental clearance of dapagliflozin; T2DM, type 2 diabetes mellitus; V2P, central volume of distribution of dapagliflozin; V2M, central volume of distribution of D3OG; V3P, peripheral volume of distribution of dapagliflozin. Dashed lines, a priori scaling; shaded areas, covariates selected during stepwise covariate model building; unshaded areas, added based on previous modeling experience. Covariates connected to compartments affect the relevant volume, those connected to pathways affect the relevant clearance.
Table 1. Parameter estimates.
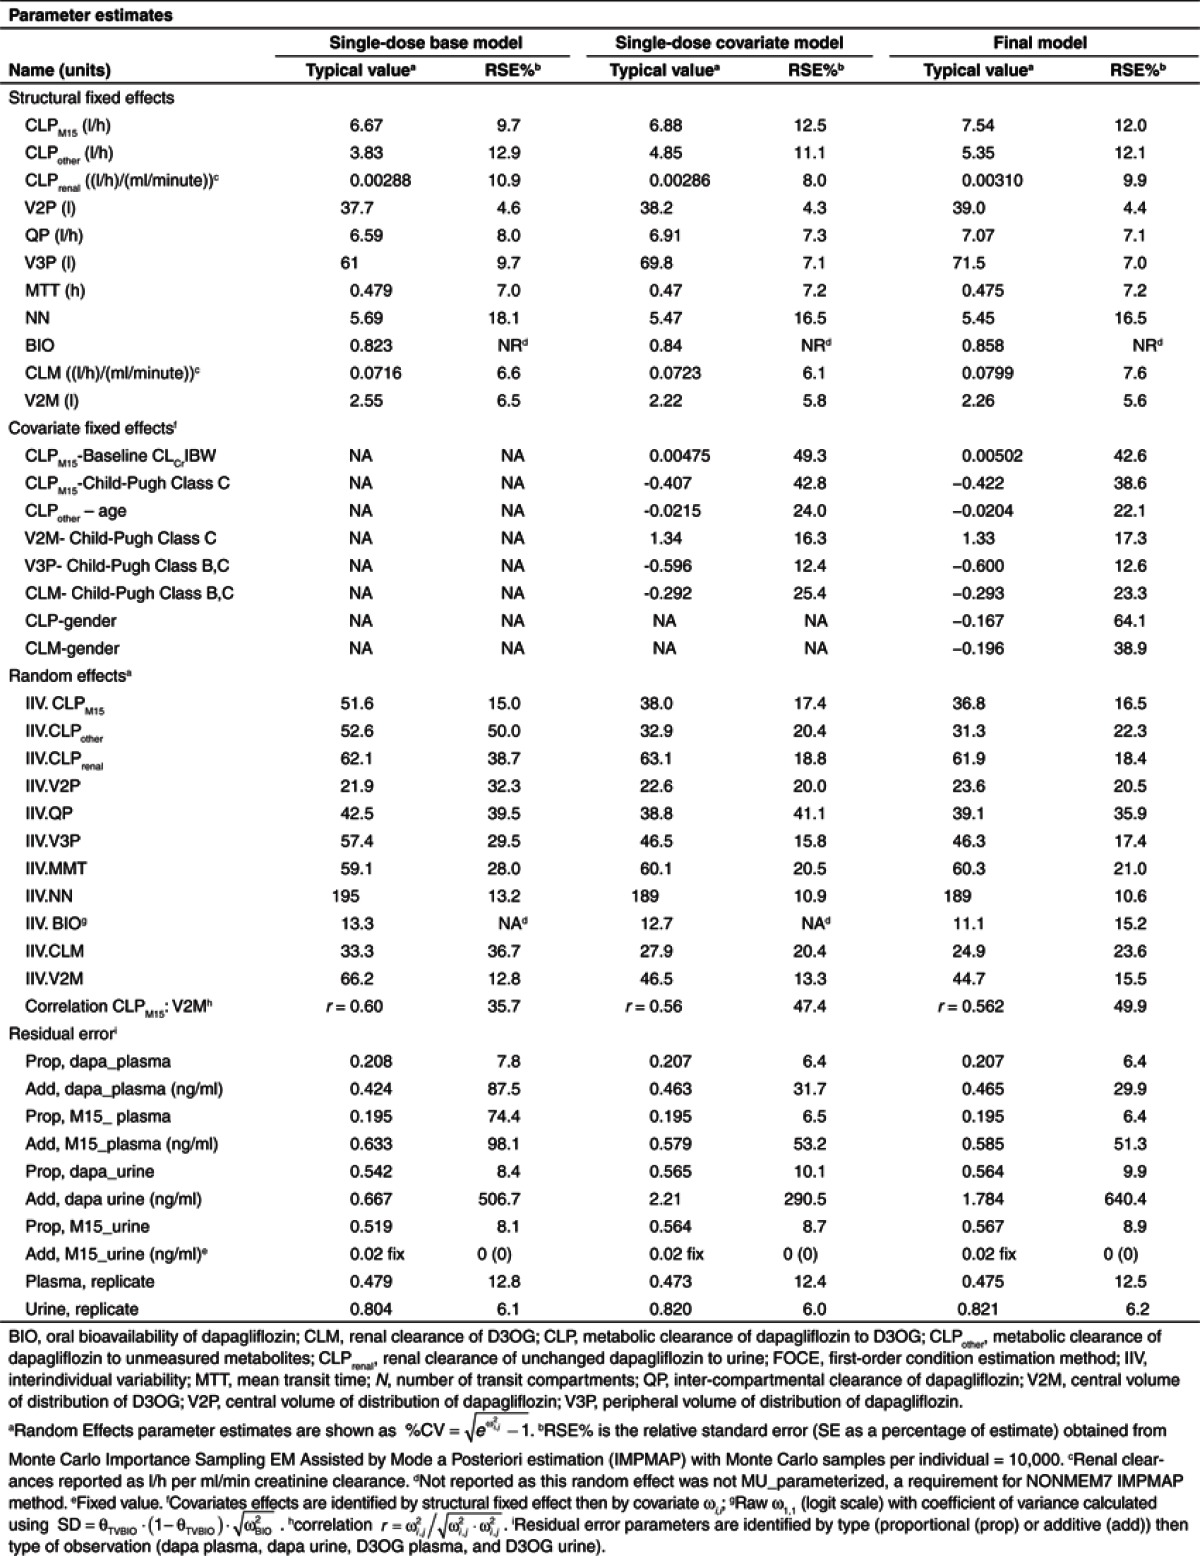
The medians (interquartile range) of fraction of dapagliflozin excreted in urine (FE) and fraction of dapagliflozin metabolized to D3OG (FMM15) were 1.6% (1.2–2.1%) and 60% (53–72%), respectively. In the base model, FE and FMM15 were reduced in subjects with severe renal impairment (Supplementary Figure S1 online). The CLPM15 and the volume of distribution of D3OG (V2M) were found to be correlated (r = 0.6). Overall, the single-dose base model described the observed data well but underpredicted the population D3OG concentrations in plasma in subjects with CLcr < 50 ml/min (data not shown).
The estimates of the proportional components of the residual variability in plasma dapagliflozin and D3OG were 20.8 and 19.5%, respectively. Replicate residual variability in plasma accounted for 47.9% of the variability. As expected, residual variability in urine was larger: 54.2 and 51.9% for dapagliflozin and D3OG, respectively. Replicate residual variability in urine accounted for 80.4% of the variability.
Covariate model
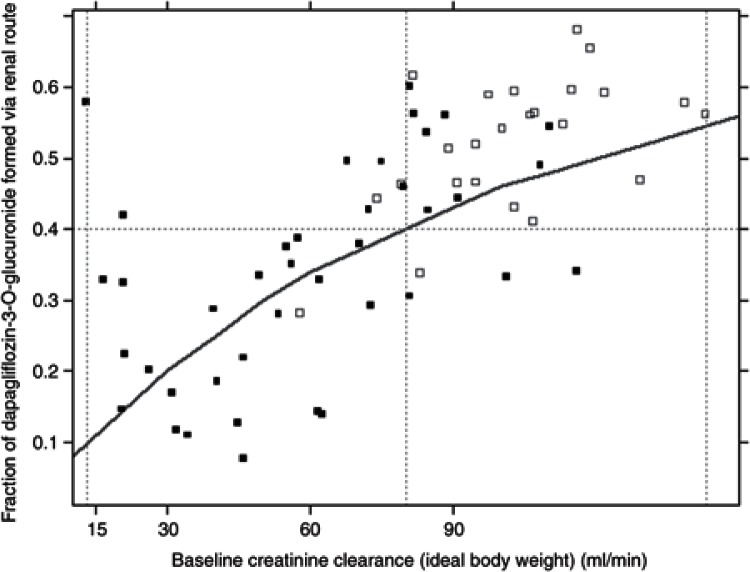
Significant covariate relationships identified during the general additive modeling analysis and included in the stepwise covariate model (SCM) building are summarized in Table 2 and Figure 1. The parameter estimates of the single-dose covariate model are shown in Table 1. Renal function influenced the CLPM15. The fraction of D3OG formed via the renal route decreased from 46% in a typical subject with normal renal function (CLcr ~100 ml/min) to 10% in a typical subject with CLcr = 13 ml/min, the lowest value in the study population. This relationship is illustrated in Figure 2.
Table 2. Summary of baseline covariates and PK–covariate relationships included a priori, retained (3) or removed (×) during backwards deletion of the stepwise covariate model building (P = 0.01).
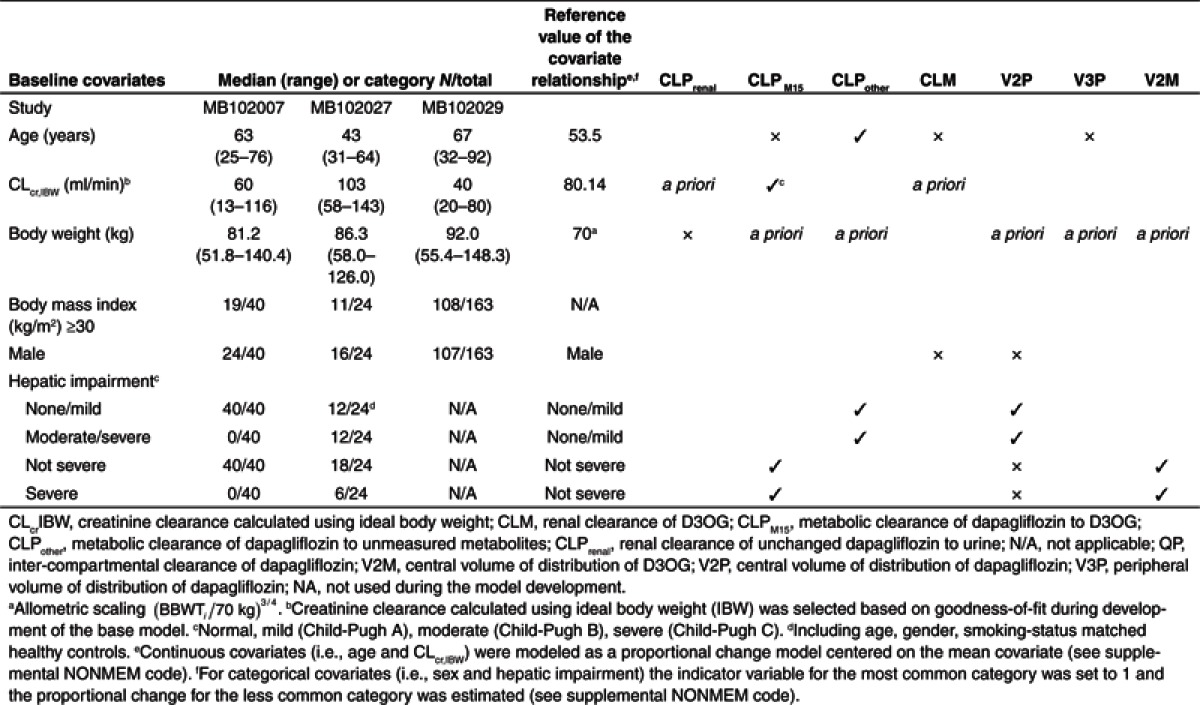
Figure 2.
Renal contribution to the metabolism of dapagliflozin to D3OG in healthy subjects, and T2DM subjects with normal or impaired renal function. Solid squares, MB102007; open squares, MB102027; Line, population predictions.
The covariate model suggested that both formation (CLPM15) and elimination (CLM) of D3OG were altered with HI. With severe HI (Child-Pugh Class C), CLPM15 decreased by 41% and V2M increased by 134%. Moderate or severe HI (Child-Pugh Class B or C) decreased CLM and the peripheral volume of distribution of dapagliflozin (V3P) by 29 and 60%, respectively.
During the backward elimination, the effects of age on the renal clearance of unchanged dapagliflozin to urine (CLPrenal), CLM, and V3P, and the effects of gender on CLM and the central volume of distribution of dapagliflozin (V2P) were removed. The effect of age on the metabolic clearance of dapagliflozin to unmeasured metabolites (CLPother) remained significant, and the CLPother decreased by 2% for every year of increasing age above 54 years.
The covariate model described the single- and multiple-dose data best and improved the population-predicted plasma D3OG concentrations compared with the base model (data not shown).
Final model
The final model incorporated gender effects on CLM and total dapagliflozin clearance (CLP) and resulted in a statistically significant improvements in model fit (ΔOFV = −15.828 points). In females, CLP and CLM were 16.7 and 19.6% lower, respectively. The parameter estimates of the final model are provided in Table 1.
Model evaluation
In the final model, all the structural parameters were estimated with good precision (% relative standard error < 20%). The addition of gender effect on CLP and CLM improved the precision in the estimate of the effects of baseline CLcr and severe HI (Child-Pugh Class C) on CLPM15.
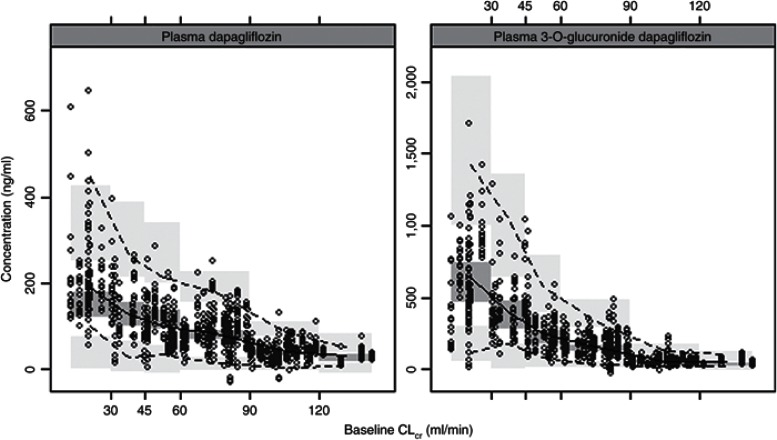
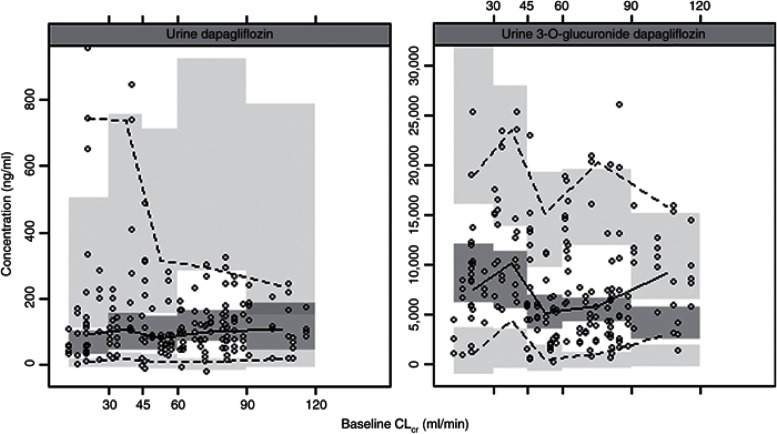
The visual predictive checks confirmed that the model had good simulation properties (Supplementary Figure S3 online). As seen in Figures 3 and 4, there was good agreement in model predicted and observed plasma and urine dapagliflozin and D3OG concentrations for different categories of renal function: CLcr < 30, 30–45, 45–60, 60–90, and >90 ml/min. However, given the high variability in urine concentrations and the paucity of urine data in subjects with CLcr > 90 ml/min, the model predictions in this stratum should be interpreted with caution. In an external evaluation, the final model accurately predicted the plasma dapagliflozin and D3OG concentrations in T2DM subjects with moderate renal impairment (Supplementary Figure S2 online).
Figure 3.
Visual predictive check: plasma dapagliflozin and D3OG by renal function. CLcr, creatinine clearance. Points, observed data; solid line, median of the observations; dotted lines, 5th and 95th percentiles of the observations; shaded areas, 95% confidence interval for simulated data (1,000 simulated data sets) for the corresponding percentiles.
Figure 4.
Visual predictive check: urine dapagliflozin and D3OG by renal functions. Points, observed data; solid line, median of the observations; dotted lines, 5th and 95th percentiles of the observations; shaded areas, 95% confidence interval for simulated data (1,000 simulated data sets).
Model application
Simulations with the final model were performed to gauge the effect of decreasing renal function on the exposure of dapagliflozin and D3OG (Table 3). Compared with T2DM subjects with normal renal function (CLcr of 80–100 ml/min), the exposure of dapagliflozin (realized as AUC at steady state (AUCss)) was 1.26 and 1.35 times higher than subjects with CLcr of 50–79 and 30–49 ml/min, respectively. The increase in D3OG exposure exceeds the increase in dapagliflozin exposure (1.32 times at CLcr of 50–79 ml/min and 1.57 times at CLcr of 30–49 ml/min). Similar changes were seen when patient characteristics of the two phase I studies were used for simulations.
Table 3. Effects of renal function on steady-state dapagliflozin and D3OG exposure.

Discussion
Main findings
The semi-mechanistic model indicated that the influence of both renal and hepatic function on the CLPM15 was the most likely explanation of the altered dapagliflozin and D3OG PK observed in the subjects with renal or HI. The fraction of D3OG formed via the renal route decreased from 40–55% in subjects with normal renal function (CLcr>80 ml/min) to ~10% in subjects with severe renal insufficiency (CLcr = 13 ml/min) (Figure 2).With severe HI, reduction of 42% in the CLPM15 and 29% in the CLM resulted in D3OG exposure comparable to that in healthy subjects. The subjects with moderate HI had nearly double the exposure to D3OG. Therefore, differences in systemic exposure to D3OG between the HI and healthy subject groups did not correlate directly with the severity of HI. The possible explanation for these findings is that D3OG is mainly cleared via renal excretion, and subjects with severe HI may concomitantly present renal dysfunction.12
Effect of renal impairment
Metabolism (primarily glucuronidation via UGT1A9) is the major elimination pathway of dapagliflozin: ~60%, and <2% of an administered dapagliflozin dose is recovered from urine as D3OG and dapagliflozin, respectively.4 The tissue mRNA expression of UGT1A9 in humans has been reported in the literature. On the basis of the reverse transcriptase polymerase chain reaction data, the expression of UGT1A9 was found to be about eightfold higher in the human kidney as compared with that of the liver.13 These data suggest the involvement of kidney in the metabolism of dapagliflozin. Our analysis suggested that the impact of renal impairment on the metabolism of dapagliflozin was manifested by the reduced metabolic clearance of dapagliflozin. Although there is evidence in the literature to suggest that chronic kidney disease contributes to decreased nonrenal metabolism,14 the impact of chronic kidney disease on the liver metabolism of dapagliflozin is not known. Nevertheless, our simulation results along with the literature findings suggest that the kidney plays an important role in the metabolism of dapagliflozin via the UGT1A9 pathway, and this may also explain the greater systemic exposure of dapagliflozin in subjects with moderate and severe renal impairment at steady state as compared with subjects with normal renal function.
Effect of HI
The model assigned the effects of HI on the formation (CLPM15) and clearance of D3OG (CLM) during the stepwise covariate modeling. For technical reasons (linearized SCM), hepatic dysfunction was tested as two separate binary covariates (i.e., mild vs. moderate/severe, and mild/moderate vs. severe). The selection of mild/moderate vs. severe on CLPM15 and mild vs. moderate/severe on CLM should be seen in context of the flexibility of the model, limited data, and the loss of information when categorizing HI.15 Despite that all subjects contributed data on renal function, only six (9%) informed the model regarding moderate or severe HI. The results suggest that metabolic clearance of dapagliflozin to D3OG (CLPM15) is preserved in patients with moderate HI.
Absorption and oral bioavailability
Misspecification of dapagliflozin absorption also resulted in misfit of D3OG data during early sampling times. Therefore, considerable effort was made to characterize the absorption of dapagliflozin. A transit compartment model estimating both the mean transit time and number of transit compartments resulted in a flexible absorption model that well described the rich data during the absorption phase. The drawback was considerably longer computation time, especially when incorporating the multiple-dose data.
Absolute oral bioavailability and nonrenal clearance can be determined from modeling oral data when plasma and urine data are available in subjects with varying renal function.16,17,18 Estimating the absolute oral bioavailability, and thereby the absolute value of clearance, reduced the risk of biased estimates of apparent nonrenal clearance when only oral data were available.19 The model-estimated absolute bioavailability of dapagliflozin was 82% (base model), 84% (covariate model), and 86% (final model), which are in good agreement with the absolute oral bioavailability (geometric mean (90% CI): 78% (73–83%)) determined in healthy subjects following the concomitant administration of single intravenous 14C-labeled microdose at time of maximum concentration (Tmax) of the extravascular (unlabeled) therapeutic dose.3
Model application
Mild renal impairment is common in T2DM and presents a significant proportion of the population treated with dapagliflozin. Given the interplay in body weight, sex, and renal function, simulations were performed (using the covariates reported for each subject) to assess the effects of mild and moderate renal impairment on dapagliflozin and D3OG exposure. As seen in Table 3, the simulations based on the subjects who participated in the phase I PK studies do not differ substantially from those for the subjects in the phase III study. The increases in D3OG AUCss of 1.36 and 1.32 for mild (50 ≤ Clcr < 80 ml/min), and 1.57 and 1.57 for moderate (30 ≤ Clcr < 50 ml/min) renal impairment, are comparable. However, the simulations using the characteristics of phase I subjects could have underpredicted the increase in dapagliflozin exposure compared with using the characteristics from the phase III study. Differences in body weights of subjects in the phase I and III studies should be considered when a model developed with mostly normal weight subjects is used to simulate into a new and obese population.
In conclusion, the semi-mechanistic model developed to estimate the renal and nonrenal clearance of dapagliflozin presented a simplification of the interplay among biological systems; however, it provided a useful approach to evaluate the impact of renal and HI on the population PK of dapagliflozin. The results emphasized the role of renal metabolism of dapagliflozin to D3OG, which is the major elimination pathway of dapagliflozin. The model estimated that the kidneys contributed 40–55% of the metabolism of dapagliflozin with normal renal function. In renal impairment and severe HI, both formation and elimination of D3OG were decreased. In T2DM subjects, D3OG systemic exposure (AUCss) increased more than dapagliflozin exposure.
Methods
Study design
Dapagliflozin and D3OG plasma and urine concentration–time data from a single- and multiple-dose (7 days of q.d. dosing) renal impairment study (NCT00554450),7,8 a 5-day single-dose HI study,9 and a 52-week, phase III (NCT00663260) clinical trial20 in patients with T2DM and moderate renal impairment were available for analysis.
The renal impairment PK/PD study evaluated the PK, PD, and safety and tolerability of oral dapagliflozin in eight healthy adult subjects (50 mg single dose) and in 32 T2DM subjects with normal, mild, moderate, and severe renal impairment (50 mg single dose followed by 20 mg daily dose for 7 days).7,8 The HI study compared the safety and serial PK of a single dose of dapagliflozin (10 mg) in 18 subjects with HI and 6 healthy subjects.9 The phase 3 clinical trial investigated the glycemic efficacy, renal safety, and PK/PD of dapagliflozin in 252 subjects with T2DM and moderate renal impairment.20
Each clinical trial was conducted in accordance to local and international ethics standards and was monitored for compliance with current good clinical practice. The appropriate ethics and regulatory approvals were obtained before study initiation, and written informed consent was obtained from all participants.
Analysis of dapagliflozin and D3OG concentrations
Analysis of dapagliflozin and D3OG plasma and urine concentrations was performed using high-pressure liquid chromatography with tandem mass spectrometry detection within the known period of stability. All determinations of dapagliflozin and D3OG concentrations in human plasma and urine were generated in analytical runs using appropriate calibration curves and quality control samples that met preestablished acceptance criteria. The standard curve ranges for dapagliflozin in plasma and urine were 1–500 and 1–1000 ng/ml, respectively. The standard curve ranges for D3OG in plasma and urine were 1–500 and 10–5000 ng/ml, respectively. The between-run and within-run coefficients of variation for the analytical quality controls of both analytes in either matrix were ≤10%.
Pharmacometric analysis
Modeling approach The single/first-dose data were used to develop a semi-mechanistic (base) model to estimate the renal and nonrenal clearances of dapagliflozin. SCM building was used to evaluate the effects of renal function markers, HI, and other baseline covariates on the structural parameters (covariate model). After confirming that the single-dose models adequately described the multiple-dose data in subjects with T2DM and moderate renal impairment, the final model incorporated important covariates identified in the previous analyses.21 The NONMEM code (ICON Development Solutions, Ellicott city, MD), example data set, and summary of data used in the model development and evaluation are provided in the Supplementary Material.
The compartmental models were parameterized as clearance and volume terms using a parameterization that is stable for different types of estimation methods. The structural model parameters were described as follows (Eqs. 1 and 2):
 |
 |
PTV is the typical value of parameter P, MUi is a function of PTV, Pi is the value of parameter P for the ith individual, and  is a realization of a normally distributed random variable with zero mean and variance
  . Interindividual variability was reported as approximate percent coefficient of variation, and significant correlations between random effects (identified in the base model using nonparametric estimation) were retained in the subsequent models.
Plasma and urine concentrations of dapagliflozin and D3OG were analyzed simultaneously, but four separate residual error models were developed to describe the differences between the individual predictions and the observed dapagliflozin and D3OG concentrations in plasma or urine. The correlation in residual errors for dapagliflozin and D3OG, when measured in either plasma or urine at the same time, was estimated (i.e., replicate residual error).22 As an example, the residual error model for urine dapagliflozin is shown (Eqs. 3 and 4).
 |
 |
 , the jth dapagliflozin observation in urine in the ith individual, was described by the corresponding model prediction
  , the standard deviation of dapagliflozin in urine
  , and the proportion of residual error common to both dapagliflozin and D3OG in urine
  are residual random variables that are normally distributed with a mean of 0 and variance of 1 (fixed).
  is parameterized in terms of proportional
  and additive
  components.
The first-order condition estimation method with η–ε interaction in NONMEM (version 7.1.2) was used to obtain the parameter estimates. Standard errors were generated using Monte Carlo importance sampling EM assisted by mode a posteriori estimation. Xpose (version 4.3.2) (GNU Lesser Public License) was used to process the NONMEM output.
Base model
The absorption of dapagliflozin was described by a transit compartment model.23 kTRANSIT was calculated from the estimate of the mean transit time (i.e., the time for a drug molecule to transit from the first to the last absorption site) and number of transit compartments (N + 1) (Eq. 5). The bioavailability was described using a logit model to ensure that the posterior individual estimates of bioavailability did not exceed 100% (Eq. 6).
 |
 |
The availability of plasma and urine dapagliflozin and D3OG supported three identifiable elimination pathways of dapagliflozin: (1) CLPrenal, (2) CLPM15 , and (3) CLPother (Eq. 7). CLPrenal and CLM were proportional to the CLcr and reported as  . Metabolic clearances (i.e., CLPM15 and CLPother) were scaled by the individual baseline body weight (WTi) using an allometric model,
 , to account for the size of metabolizing organ(s). The FE and FMM15 were obtained from Eqs. 8 and 9.
 |
 |
 |
Covariate model building
Covariate relationships with structural parameters were evaluated visually and statistically using empirical Bayes estimates vs. covariates and stepwise general additive modeling. Only the covariate relationships significant in the stepwise general additive modeling were included in the SCM. The covariate–PK relationships that were evaluated are listed in Table 1. The linearization SCM tool was used for forward and backward selection.24 In this method, the individual predictions were linearized with respect to the ε values (random effects). To implement the linearized SCM method, categorical covariates (e.g., Child-Pugh classification) were dichotomized (Table 2).
The renal contribution to the metabolism of dapagliflozin to D3OG (FMM15,renal) is calculated using Eqs. 10–13.
The relative clearance for dapagliflozin to D3OG (ΔCLPM15) for changes in baseline CLcr was calculated using the relationship between CLcr and CLPM15 as estimated in the covariate model:
 |
where  is the proportional change in CLPM15, CLcr,i is the individual baseline CLcr, and CLcr,mean is the mean baseline CLcr. The nonrenal contribution to ΔCLPM15 (ΔCLPM15,nonrenal) was calculated using the estimate of
  from the final model (see Table 1) and the mean baseline CLcr of 80.14 ml/min for the two clinical pharmacology studies based on the assumption that the kidneys do not contribute to the metabolism at zero level of CLcr:
 |
The renal component of ΔCLPM15 (ΔCLPM15,renal) was the difference between the ΔCLPM15 for the range of baseline CLcr,i values (Eq. 10) and the nonrenal effect (Eq. 11):
The contribution of the kidney to dapagliflozin metabolism to D3OG (FMM15,renal) was the ratio of the renal component of ΔCLPM15 to the relative clearance ΔCLPM15:
 |
Model selection and evaluation
Improvements in goodness-of-fit were assessed by comparing the changes in the NONMEM objective function values (OFVs), improvements in diagnostic plots, reductions in interindividual variability of structural model parameters and residual error, and acceptable predictive performance.
The simulation properties of the models were evaluated by visual predictive checks, a graphical assessment of the agreement between simulations from the model and the observations. To confirm that the model could predict plasma and urine dapagliflozin and D3OG concentrations over the range of renal functions in the data, CLcr was used as the independent variable for visual predictive checks. To account for the different dose and covariate effects of dapagliflozin, the prediction and variance corrected visual predictive checks were used.25
The effects of impaired renal function on the steady-state exposure of dapagliflozin and D3OG were realized by calculating the AUCss using Eqs. 14 and 15. The actual baseline body weight, baseline CLcr, and sex of the subjects in the phase I PK and III PK/PD studies were used in the simulations. In the simulations, a daily dose of dapagliflozin 10 mg was administered to all subjects.
 |
 |
Author contributions
J.-S.V. and Y.H. wrote the manuscript; M.O.K., J.-S.V., L.Z., M.P., and D.W.B. designed the research; M.O.K., J.-S.V., and Y.H. analyzed data; and L.Z. contributed New Reagents/Analytical Tools.
Conflict of interest
Y.H., L.Z., M.P., and D.W.B. were stockholders and/or employees of BMS when these analyses were performed. BMS commissioned the analysis from Uppsala University. J.-S.V. and M.O.K. performed this work as employees of Uppsala University.
Study Highlights
Supplementary Material
References
- Wright E.M. Renal Na(+)-glucose cotransporters. Am. J. Physiol. Renal Physiol. 2001;280:F10–F18. doi: 10.1152/ajprenal.2001.280.1.F10. [DOI] [PubMed] [Google Scholar]
- Komoroski B., Vachharajani N., Feng Y., Li L., Kornhauser D., Pfister M. Dapagliflozin, a novel, selective SGLT2 inhibitor, improved glycemic control over 2 weeks in patients with type 2 diabetes mellitus. Clin. Pharmacol. Ther. 2009;85:513–519. doi: 10.1038/clpt.2008.250. [DOI] [PubMed] [Google Scholar]
- Boulton D.W., et al. Simultaneous oral therapeutic and intravenous ¹4C-microdoses to determine the absolute oral bioavailability of saxagliptin and dapagliflozin. Br. J. Clin. Pharmacol. 2013;75:763–768. doi: 10.1111/j.1365-2125.2012.04391.x. [DOI] [PMC free article] [PubMed] [Google Scholar]
- Kasichayanula S., et al. American Association of Pharmaceutical Scientists, Atlanta, GA; 2008. Disposition and mass balance of [14C]-dapagliflozin after single oral doses in healthy male volunteers. [Google Scholar]
- Molitch M.E., DeFronzo R.A., Franz M.J., Keane W.F., Mogensen C.E., Parving H.H., American Diabetes Association Diabetic nephropathy. Diabetes Care. 2003;26 suppl. 1:S94–S98. doi: 10.2337/diacare.26.2007.s94. [DOI] [PubMed] [Google Scholar]
- Fraser A., Harris R., Sattar N., Ebrahim S., Davey Smith G., Lawlor D.A. Alanine aminotransferase, gamma-glutamyltransferase, and incident diabetes: the British Women's Heart and Health Study and meta-analysis. Diabetes Care. 2009;32:741–750. doi: 10.2337/dc08-1870. [DOI] [PMC free article] [PubMed] [Google Scholar]
- Kasichayanula S., et al. American Society of Nephrology. Philadelphia, PA; 2011. Influence of renal function on dapagliflozin pharmacodynamics in patients with type 2 diabetes mellitus [abstr. TH-PO525]. [Google Scholar]
- Kasichayanula S., et al. American Society of Nephrology. Philadelphia, PA; 2011. Influence of renal function on dapagliflozin pharmacokinetics in healthy subjects and in patients with type 2 diabetes mellitus [abstr. TH-PO526]. [Google Scholar]
- Kasichayanula S., Liu X., Zhang W., Pfister M., LaCreta F.P., Boulton D.W. Influence of hepatic impairment on the pharmacokinetics and safety profile of dapagliflozin: an open-label, parallel-group, single-dose study. Clin. Ther. 2011;33:1798–1808. doi: 10.1016/j.clinthera.2011.09.011. [DOI] [PubMed] [Google Scholar]
- National Kidney Foundation. K/DOQI clinical practice guidelines for bone metabolism and disease in chronic kidney disease Am. J. Kidney Dis. 2003;42:S1–201. [PubMed] [Google Scholar]
- Kasichayanula S., et al. The influence of kidney function on dapagliflozin exposure, metabolism, and efficacy in healthy subjects and in patients with type 2 diabetes mellitus. Br. J. Clin. Pharmacol .2012. e-pub ahead of print (doi:10.1111/bcp.12056). [DOI] [PMC free article] [PubMed]
- Betrosian A.P., Agarwal B., Douzinas E.E. Acute renal dysfunction in liver diseases. World J. Gastroenterol. 2007;13:5552–5559. doi: 10.3748/wjg.v13.i42.5552. [DOI] [PMC free article] [PubMed] [Google Scholar]
- Nishimura M., Naito S. Tissue-specific mRNA expression profiles of human phase I metabolizing enzymes except for cytochrome P450 and phase II metabolizing enzymes. Drug Metab. Pharmacokinet. 2006;21:357–374. doi: 10.2133/dmpk.21.357. [DOI] [PubMed] [Google Scholar]
- Nolin T.D. Altered nonrenal drug clearance in ESRD. Curr. Opin. Nephrol. Hypertens. 2008;17:555–559. doi: 10.1097/MNH.0b013e3283136732. [DOI] [PubMed] [Google Scholar]
- Durkalski V., Berger V.W.Categorizing data. Encyclopedia of Statistics in Behavioral Science John Wiley & Sons, Ltd; 2005. published online 15 October 2005 (doi:10.1002/0470013192.bsa077). [Google Scholar]
- Hinderling P.H., Shi J. Absolute bioavailability estimated from oral data. J. Pharm. Sci. 1995;84:385–386. doi: 10.1002/jps.2600840323. [DOI] [PubMed] [Google Scholar]
- Hinderling P.H. Evaluation of a novel method to estimate absolute bioavailability of drugs from oral data. Biopharm. Drug Dispos. 2003;24:1–16. doi: 10.1002/bdd.320. [DOI] [PubMed] [Google Scholar]
- Hamrén B., Ericsson H., Samuelsson O., Karlsson M.O. Mechanistic modelling of tesaglitazar pharmacokinetic data in subjects with various degrees of renal function–evidence of interconversion. Br. J. Clin. Pharmacol. 2008;65:855–863. doi: 10.1111/j.1365-2125.2008.03110.x. [DOI] [PMC free article] [PubMed] [Google Scholar]
- Hinderling P.H. Biased estimates of nonrenal clearance. J. Pharm. Sci. 2001;90:960–966. doi: 10.1002/jps.1047. [DOI] [PubMed] [Google Scholar]
- Kohan D.E., et al. American Society of Nephrology. Philadelphia, PA; 2011. Efficacy and safety of dapagliflozin in patients with type 2 diabetes and moderate renal impairment [abstr. TH-PO524]. [Google Scholar]
- Zhang L., Feng Y., List J., Kasichayanula S., Pfister M. Dapagliflozin treatment in patients with different stages of type 2 diabetes mellitus: effects on glycaemic control and body weight. Diabetes. Obes. Metab. 2010;12:510–516. doi: 10.1111/j.1463-1326.2010.01216.x. [DOI] [PubMed] [Google Scholar]
- Karlsson M.O., Beal S.L., Sheiner L.B. Three new residual error models for population PK/PD analyses. J. Pharmacokinet. Biopharm. 1995;23:651–672. doi: 10.1007/BF02353466. [DOI] [PubMed] [Google Scholar]
- Savic R.M., Jonker D.M., Kerbusch T., Karlsson M.O. Implementation of a transit compartment model for describing drug absorption in pharmacokinetic studies. J. Pharmacokinet. Pharmacodyn. 2007;34:711–726. doi: 10.1007/s10928-007-9066-0. [DOI] [PubMed] [Google Scholar]
- Khandelwal A., Harling K., Jonsson E.N., Hooker A.C., Karlsson M.O. A fast method for testing covariates in population PK/PD Models. AAPS J. 2011;13:464–472. doi: 10.1208/s12248-011-9289-2. [DOI] [PMC free article] [PubMed] [Google Scholar]
- Bergstrand M., Hooker A.C., Wallin J.E., Karlsson M.O. Prediction-corrected visual predictive checks for diagnosing nonlinear mixed-effects models. AAPS J. 2011;13:143–151. doi: 10.1208/s12248-011-9255-z. [DOI] [PMC free article] [PubMed] [Google Scholar]
Associated Data
This section collects any data citations, data availability statements, or supplementary materials included in this article.


