

Abstract
The mechanisms of arousal from apneas during sleep in patients suffering from obstructive sleep apnea are not well understood. However, we know that respiratory chemosensory pathways converge on the parabrachial nucleus (PB), which sends glutamatergic projections to a variety of forebrain structures critical to arousal, including the basal forebrain, lateral hypothalamus, midline thalamus, and cerebral cortex. We tested the role of glutamatergic signaling in this pathway by developing an animal model for repetitive CO2 arousals (RCAs) and investigating the effect of deleting the gene for the vesicular glutamate transporter 2 (Vglut2) from neurons in the PB. We used mice with lox P sequences flanking exon2 of the Vglut2 gene, in which adeno-associated viral vectors containing genes encoding Cre recombinase and green fluorescent protein were microinjected into the PB to permanently and selectively disrupt Vglut2 expression while labeling the affected neurons. We recorded sleep in these mice and then investigated the arousals during RCA. Vglut2 deletions that included the external lateral and lateral crescent subdivisions of the lateral PB more than doubled the latency to arousal and resulted in failure to arouse by 30 s in >30% of trials. By contrast, deletions that involved the medial PB subdivision had minimal effects on arousal during hypercapnia but instead increased non-rapid eye movement (NREM) sleep by ∼43% during the dark period, and increased delta power in the EEG during NREM sleep by ∼50%. Our results suggest that glutamatergic neurons in the lateral PB are necessary for arousals from sleep in response to CO2, while medial PB glutamatergic neurons play an important role in promoting spontaneous waking.
Introduction
Patients with obstructive sleep apnea (OSA) suffer from repeated cycles during sleep of loss of upper airway muscle tone, airway collapse, and apnea, followed by arousal with re-establishment of the airway, then falling back to sleep. This cycle may be repeated hundreds of times over the course of the night. Although the arousals are brief, and the sleeping individual may not even notice them, the subsequent sleep fragmentation and chronic, intermittent hypoxia cause daytime sleepiness and cognitive impairment, as well as diabetes and cardiovascular pathology (Loredo et al., 1999; Jain, 2007; Kim et al., 2007; Tregear et al., 2009). Despite the importance of these life-saving arousals during apnea, their mechanisms are surprisingly poorly defined.
One problem in studying sleep apnea has been the difficulty in establishing animal models, particularly in rodents, where the underlying anatomy and physiology of cortical arousal has been carefully studied. The arousals that occur during OSA correlate only loosely with the level of hypoxia experienced, more closely with the level of hypercapnia, and best with the level of negative airway pressure generated during attempts to breathe (Gleeson et al., 1990). However, the degree of negative pressure generated during attempts to breathe is proportional to the level of chemoreceptor stimulation. Because it is difficult to simulate negative airway pressure in a freely behaving animal, we have established a protocol of repetitive brief hypercapnia-elicited arousals in mice as a model for the arousals that occur during OSA.
Recent evidence implicates the parabrachial nucleus (PB) and the adjacent preceruleus area (PC) in promoting cortical arousal (Fuller et al., 2011). Furthermore, the PB is also a key site for respiratory regulation (Chamberlin and Saper, 1994; Chamberlin, 2004) and shows extensive cFos expression after hypercapnia or hypoxia (Teppema et al., 1997; Berquin et al., 2000), particularly in the ventral areas in the lateral PB (LPB) [i.e., in the external lateral (PBel), lateral crescent (PBlc), and Kölliker-Fuse (KF) subnuclei, and in the ventrolateral part of the medial PB (MPB)]. Microstimulation studies found that activation of these same areas caused hyperpnea (Chamberlin and Saper, 1994). This respiratory component of the PB also receives dense inputs from cell groups that convey CO2 chemosensory information, including the nucleus of the solitary tract (NTS) and retrotrapezoid nucleus (Herbert et al., 1990; Abbott et al., 2009; Depuy et al., 2011; Song et al., 2011; Bochorishvili et al., 2012), and from the medullary raphe (serotoninergic chemosensory nuclei) (Steinbusch, 1981; Miller et al., 2011; Bang et al., 2012). As the PB projects heavily to the forebrain arousal system, including the hypothalamus, thalamus, basal forebrain, and cortex (Saper and Loewy, 1980; Fulwiler and Saper, 1984), we hypothesized that the PB mediates arousal responses to hypercapnic/hypoxic stimuli via its forebrain projections.
Most PB neurons express the vesicular glutamate transporter type 2 (Vglut2; see the Allen Brain Atlas at http://www.brain-map.org/) (Niu et al., 2010), raising the possibility that the PB arousal pathways are likely to be glutamatergic. To test these hypotheses, we focally deleted the Vglut2 gene to eliminate glutamate signaling from the PB, and examine the effect on arousals from sleep elicited by either hypercapnia or hypoxic hypercapnia.
Materials and Methods
Animals
We used homozygous Vglut2flox/flox mice (n = 42) and homozygous wild-type (n = 5) littermates (as determined by tail DNA PCR analysis) for experimental and control animals. The Vglut2 conditional knock-out mice were originally prepared by Tong et al. (Tong et al., 2007) and have loxP sites flanking the second exon of the Vglut2 gene (Vglut2flox/flox). The original 129S mice were back-crossed with C57BL/6J mice for 2–4 generations.
We also used a Vglut2-ires-Cre line of mice (n = 6) in a second set of experiments, where Cre-recombinase is expressed in cells that express Vglut2; this specificity has been validated by Vong and colleagues by crossing these mice with green fluorescent protein (GFP) reporter mice (Vong et al., 2011). We used heterozygous mice in this study (i.e., Vglut2-ires-Cre+/−). The original 129S Vglut2-ires-Cre mice were backcrossed with C57BL/6J mice at least for two generations.
All mice used in experiments were male. Animals were maintained on a 12 h light/dark cycle with ad libitum access to water and food. All animal procedures met National Institutes of Health standards, as set forth in the Guide for the Care and Use of Laboratory Animals, and all protocols were approved by the Beth Israel Deaconess Medical Center Institutional Animal Care and Use Committee.
Vectors
The adeno-associated viral vectors (AAVs, either serotype 8 or 10) that we used contained the gene for Cre recombinase (AAV-Cre, n = 8), the gene for GFP (AAV-GFP, n = 8), or both (AAV-GFP-ires-Cre, n = 9). In an additional set of mice (n = 22), we used an AAV containing both the genes for Cre and for Venus, a GFP, connected by a self-processing 2A viral peptide bridge (AAV-iCre-2A-Venus). AAV/rh10.CMV.PICre.RBG [serotype 10 AAV-Cre: titer = 1.13 × 10¹³ GC/ml with yield of 7.11 × 10¹² genome copies (GC)/ml] was acquired from the Gene Therapy Program Vector Core at the University of Pennsylvania. AAV-MCS8-GFP-IRES-iCre (serotype8 AAV-GFP-ires-Cre: titer = 8.1 × 10¹² GC/ml) was produced by Harvard Gene Therapy Initiative, Boston, by Dr. Jeng-Shin Lee. The plasmid construct for the AAV-iCre-2A-Venus was generously donated by Dr. Rolf Sprengel at the University of Heidelberg, Heidelberg, Germany (Tang et al., 2009). This plasmid was then cloned and sequenced in our laboratory and packaged by the Harvard Gene Therapy Initiative, Boston, by Dr. Jeng-Shin Lee in AAV (serotype 8 AAV-iCre-2A-Venus: titer = 9.4 × 10¹² GC/ml).
In addition, we also used an AAV conditionally expressing subunit A of diphtheria toxin (AAV-lox-mCherry-lox-DTA-WPRE; or AAV-DTA) in the Vglut2-Cre mice. In this vector the lox-flanked mCherry sequence prevents the transcription of DTA in cells that do not express Cre recombinase. However, in cells that express Cre recombinase, the Cre cleaves off the mCherry sequence enabling the expression of DTA, which leads to cell deletion. This vector was designed, produced, and validated by Dr. Michael Lazarus at Osaka Bioscience Institute, Japan, and Dr. Patrick M. Fuller in our laboratory.
Surgery
To delete the second exon of the Vglut2 gene, we stereotaxically microinjected the homozygous Vglut2flox/flox mice (n = 42) or their wild-type littermates as controls (n = 5) with AAV-Cre as described above (volume varying from 75 to 300 nl) or with AAV-GFP (n = 8). The injections targeted different subnuclei of the PB [(anteroposterior: −5.0 to −5.3 mm; mediolateral: ±1.1 to ±1.3 mm; dorsoventral: −2.5 to −2.9 mm) using a glass micropipette and an air pressure injection system. These mice were also then instrumented with EEG and EMG electrodes and were implanted with telemetric transmitters intraperitoneally for the recording of EKG, body temperature, and locomotor activity (PhysioTel ETA-F10, Data Science International).
In an additional experiment, for selective deletion of the Vglut2 cells in the PB, Vglut2-Cre mice (n = 6) were injected with AAV-DTA (volume, 150 nl) stereotaxically targeted to the lateral PB. These were also implanted with EEG and EMG electrodes for recording sleep.
Data acquisition
Seven days after surgery, mice were attached to the recording cables and acclimatized to the recording chamber for 2 d. Mice were then recorded for sleep for a 48 h period using a preamplifier (Pinnacle Technology) connected to a data acquisition system (8200-K1-SE) and Sirenia Software (both from Pinnacle Technology). Based on loss of Vglut2 expression in our preliminary studies, Cre-induced recombination occurs slowly over a period of several weeks postinjection in these mice, with minimal change at 1 week, substantial recombination by 3 weeks, and maximal recombination by ∼5 weeks. So after a post-injection period of 5 weeks, we recorded sleep in these mice again for 48 h (after 2 d of acclimatization). Because the 1 week postinjection animals were not different from controls in wake–sleep behavior or CO2 responsiveness (see text), we compared the 1 and 5 week recordings from individual animals as paired data (e.g., for measuring EEG delta power).
Following the sleep study, mice were then acclimatized to the plethysmographic chamber beginning at 9:00 A.M. for 3–4 h on each test day, and then received one of the following protocols in a random order:
Air:air—switching between two channels of normocapnic air (artificial air) (21% O2, 79% N2).
Air:hypercapnic mixture—switching between 300 s of normocapnic air followed by 30 s of 10% CO2, 21% O2, and 69% N2.
Air:hypoxic-hypercapnic mixture—switching between 300 s of normocapnic air followed by 30 s of 10% O2, 10% CO2, and 80% N2.
Acoustic stimulation (4 kHz ranging from 2 to 30 dB)—acoustic stimuli ranging from 2 dB to 30 dB were presented for 10 s at 300 s intervals, with each tone presented 10–12 times, in ascending order of intensity. As with the CO2 stimulus, only those epochs where the mice were asleep for 30 s before the stimulus were analyzed for calculating the latency of arousal to stimulus.
All recordings during recurrent stimulation were done in a plethysmographic chamber (unrestrained whole-body plethysmograph, Buxco Research Systems) allowing us to record the breathing of the mouse while in the chamber. Electroencephalogram (EEG) and electromyogram (EMG) were recorded using Pinnacle preamp cables connected to the analog adaptor (8242, Pinnacle Technology) (Fig. 1). Gas levels in the chamber were continuously monitored using CO2 and O2 monitors from CWE, Inc. EEG, EMG, respiration, and CO2 and O2 levels were fed into an Axon Digidata 1322A analog-to-digital converter and the signals were acquired using Axoscope software (Molecular Devices). The DSI transmitters were activated using a magnetic switch and the data acquired using Dataquest A.R.T. (Data Science International).
Figure 1.

RCA protocol. A, Mouse in the plethysmograph chamber, connected to cables for recording EEG and EMG. This chamber is placed on the top of a receiver, which acquires the EKG, temperature, and activity data. B, During RCA, a solenoid switches the gas intake from normocapnic air (O2, 21%; N2, 79%) to either a hypercapnic (CO2, 10%) or hypoxic-hypercapnic (CO2, 10%; O2, 10%) mixture [note rise in carbon dioxide partial pressure (pCO2) and fall in oxygen partial pressure (pO2) at arrows in this example]. Mice spontaneously sleep and awaken (e.g., the mouse is awake before the second CO2 trials in this example). However, only trials where the mouse is clearly in NREM sleep for at least 30 s before onset of the CO2 (e.g., the first and third CO2 trial in this example) are used to examine arousal. During these trials, the arousals, which typically occur within a few seconds after onset of the CO2 stimulus, are judged by EEG arousal (loss of high-amplitude delta waves and appearance of low-voltage fast EEG), which is usually accompanied by EMG activation.
Data analysis
Sleep analysis.
Digitized polygraphic data were analyzed off-line in 10 s bins using Sleep Sign software (Kissei). The software autoscored each epoch using an algorithm that identified three behavioral states based on EEG and EMG. The autoscored data were then checked at least twice visually for movement and any other artifact and to confirm or correct automatic state classification; concurrent video images of the animal's behavior also aided in this process. Over-reading of the sleep recordings were done according to previously published criteria (Neckelmann and Ursin, 1993; Kaur et al., 2008, 2009). The epochs with movement artifacts were excluded from subsequent EEG spectral analysis. EEG data were digitally low-pass filtered at 50 Hz and tapered (Hanning window), and spectral analyses was conducted using a fast Fourier transform. The integrated power of the EEG was analyzed in 2 s bins and averaged over 12 h light/dark cycles in the following frequency ranges: delta (0.5–4 Hz), theta (4.5–8 Hz), alpha (8.5–13 Hz), beta (13.5–30 Hz), and gamma (30.5–50 Hz).
The changes in amount of time spent in wake, nonrapid-eye-movement (NREM) sleep, and rapid-eye-movement (REM) sleep in different treatment groups and across time (1 week postinjection and 5 weeks postinjection) in experimental groups (AAV-Cre-injected) and in control animals (AAV-GFP-injected Vglut2flox/flox mice, AAV-Cre-injected wild-type mice) were compared statistically using two-way ANOVA followed by a Holm-Sidak post hoc test for multiple comparisons. EEG power values in the delta frequency range (0.5–4.0 Hz) were normalized as percentages of the total power in the 0.5–50 Hz frequency range and then compared with their respective control values at 1 week for each mouse. All statistical analyses were done using statistical software (Sigmastat). A probability of <0.05 was considered significant.
Analysis of arousal to hypercapnia.
EEG arousals during repetitive CO2 arousals (RCAs) were analyzed by EEG activation (note the obvious loss of delta in Fig. 1B), which is usually accompanied by EMG activation (Fig. 1). Because occasional spontaneous arousals also occurred before the CO2 exposure, we only analyzed those trials where animals were in NREM sleep for at least 30 s before the CO2 stimulus. This also eliminated any trials in which the animals were in REM sleep during the 30 s before trial onset. REM sleep periods typically are much shorter (hence we would expect to see more frequent spontaneous awakening during the trials) and there were too few trials during REM sleep to provide reliable statistical analysis. We scored the duration and latency of any EEG activation that occurred after onset of RCA. The trials in which animals did not awaken during the 30 s of the stimulus were marked as failure to arouse to stimulus. For the 30 s period of the hypercapnic stimulus, the relationship between the latency of arousals and the minute ventilation (i.e., respiratory rate per minute times mean tidal volume) was tested statistically using Pearson correlation coefficients.
Histological analysis.
At the conclusion of the experiment, the animals were perfused with 0.9% saline followed by 10% buffered formalin. Brains were harvested for analysis of the effective location of the injection site. Brains were kept in 30% sucrose for 2 d and sections were cut at 30 μm using a freezing microtome in four series.
Immunohistochemistry.
One of the series of sections was stained by in situ hybridization for Vglut2 using an exon 2-specific probe (radiolabeled) (Tong et al., 2007). A second series of sections was stained for Vglut2 by in situ hybridization (using a digoxigenin-labeled Vglut2 riboprobe) followed by immunohistochemistry for either Cre recombinase or GFP. A third series was immunostained through the injection site either for GFP (mouse anti-GFP, 1:500) or Cre (rabbit anti-Cre, 1:10,000) and through the forebrain for double immunofluorescence with antibodies for the GFP (mouse anti-GFP, 1:500) and Vglut2 (rabbit anti-Vglut2, 1:500; Table 1). Sections for immunostaining were first incubated in 0.1 m phosphate buffer and 1% H2O2 for 5–10 min followed by three washings in 0.1 m phosphate buffer. In another set of experiments, Cre-specific ablation of neurons was analyzed by immunostaining with Neu-N (mouse anti-Neu-N, 1:1000), followed by a donkey anti-mouse biotinylated secondary antibody (1:500). For all the immunohistochemical staining that involved visualization using a diaminobenzidine (DAB) reaction, the sections after the overnight incubation with primary antiserum were incubated in the respective secondary antibodies (Table 1) for 2 h, followed by incubation in ABC reagents (1:1000; Vector Laboratories) for 90 min, then washed again and incubated in a 0.06% solution of 3,3-diaminobenzidine tetrahydrochloride (Sigma-Aldrich) and 0.05% CoCl2 and 0.01% NiSO4 (NH4) in PBS plus 0.02% H2O2 for 5 min. Finally, the sections were mounted on slides, dehydrated, cleared, and coverslipped. Sections for double-immunofluorescence staining for both GFP and Vglut2 were incubated in fluorescent-labeled secondary antibodies (Table 1) for 2 h and coverslipped with fluorescence mounting media (Dako North America).
Table 1.
List of primary and secondary antibodies used for immunostaining
| Primary antibody overnight incubations at room temperature |
Secondary antibody (2 h incubation) | Dilution | ||||||
|---|---|---|---|---|---|---|---|---|
| Antigen | Host | Dilution | Source | Catalog number | Immunogen | Specificity | ||
| GFP | Mouse | 1:500 | Invitrogen | A11120 | GFP isolated from Aequorea victoria | No staining in uninjected animals | Donkey anti-mouse alexa fluor 488 (Invitrogen) | 1:100 |
| GFP | Rabbit | 1:5000 | Invitrogen | A11122 | GFP isolated from Aequorea victoria | No staining in uninjected animals | Donkey anti-rabbit biotinylated | 1:500 |
| Cre | Rabbit | 1:10,000 | Novagen | 69050 | Bacteriophage P1qa Cre-recombinase, 35 kDa protein, native and denatured | Western blot showed binding to purified Cre recombinase; none detected in uninjected mouse brain | Donkey anti-rabbit biotinylated | 1:500 |
| Vglut2 | Rabbit | 1:500 | Synaptic Systems | 135403 | Strep-Tag fusion protein of rat Vglut2 (amino acids 510–582) | Preincubation of the Vglut2 antibody with immunogen peptide blocks labeling (Graziano et al., 2008). | Donkey anti-rabbit alexa fluor 546 (Invitrogen) | 1:100 |
| Neu-N | Mouse | 1:1000 | Millipore | MAB377 | Purified cell nuclei from mouse brain | Staining only of neuronal cell groups in brain, not blood vessels or meninges or in white matter | Donkey anti-rabbit biotinylated | 1:500 |
In situ hybridization.
We combined in situ hybridization of the Vglut2 neurons using a nonradioactive probe for Vglut2 (digoxigenin-labeled Vglut2 riboprobes corresponding to exon 2 (nucleic acids 830–1287), which was between the loxP sites in the Vglut2flox/flox mice (Tong et al., 2007) with immunohistochemistry for the Cre/GFP labeling using the rabbit anti-Cre (1:5000) antibody or rabbit anti-GFP, in one series of 30 μm sections (1:5000) (Table 1). Sections were incubated overnight in the hybridization buffer containing 5 μg/ml Vglut2 riboprobe at 60°C. The next day, the sections were rinsed in 2× standard saline citrate (SSC) with 50% formamide for 30 min and, after rinsing with RNase buffer twice, were then treated with a solution of RNase A (20 μg/ml) at 37°C for 30 min. After rinsing in RNase buffer twice and repeated washing in the 2× SSC with 50% formamide, the sections were then washed in Tris-HCl-buffered saline, and then incubated overnight in alkaline phosphatase-conjugated anti-digoxigenin antibody (1:200). After rinsing in Tris-buffered saline (TBS), sections were reacted with nitroblue tetrazolium and 5-bromo-4-chloro-3-indolyl-phosphate, 4-toludine salt (a substrate for alkaline phosphatase) for 6–7 h at room temperature. Repeated washings with TBS resulted in specific labeling of the Vglut2-positive neurons by the purple reaction product. Next, the sections were treated with rabbit anti-Cre antibody (1:5000) overnight at room temperature, and then reacted with the biotinylated secondary antibody to rabbit IgG. The Cre was visualized with the avidin-biotin complex (1:1000; Vector Laboratories) and the standard DAB reaction (see above). Finally, sections were mounted on slides, dehydrated, cleared, and coverslipped.
Analysis of injection spread.
Each injection of AAV-Cre transfected a unique pattern of neurons in the PB. The spread of injection depended on the natural diffusion barriers in the tissue (mainly fiber tracts). We therefore divided our cases into groups for analysis based on whether or not they included large numbers of neurons in the respiratory PB as described earlier (Chamberlin and Saper, 1994). The bulk of the respiratory PB is made up of the external lateral subnucleus (PBel) and the adjacent lateral crescent subnucleus (PBlc). The border between these two nuclei is essentially indistinguishable in mice without retrograde labeling (the PBel projects to the amygdala and the PBlc to the medulla), so they were counted as a single structure in our analysis (Fig. 2A, el/lc). The KF subnucleus in mice is very small and located only at far rostral PB levels. While a small number of MPB neurons are in the area that receives respiratory afferents, it is difficult to delineate this region accurately. Hence, for the purpose of quantifying the involvement of the respiratory PB by injections, we counted the numbers of Cre+ neurons in the PBel/lc (Fig. 2G). This cell group is easily identified on Nissl-stained sections. So, on two sections (∼90–100 μm apart) through the far rostral PB and middle PB, we counted the Nissl-stained neurons in the nucleus, as well as the neurons with Cre-immunoreactive nuclei. The diameters of 20 nuclei of each type (Cre+ and Cre−) per animal were then measured, and Abercrombie's correction factor was applied.
Figure 2.
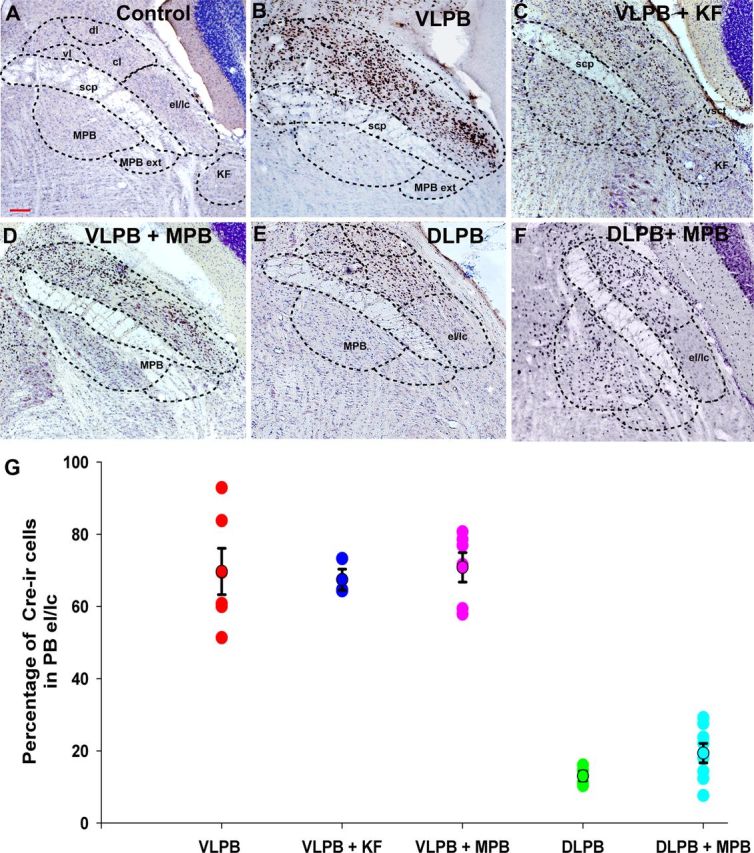
Photomicrographs showing Cre-immunoreactivity (brown) against a Nissl-stained background (blue) in the neurons in the PB region after injection of AAV-Cre in Vglut2flox/flox mice. The presence of Cre-immunoreactivity marks the nuclei of neurons with focal deletion of Vglut2 expression. A, By comparison to sections demonstrating the Nissl-stained PB subnuclei, mice with Cre staining in different subdivisions of the PB complex were categorized into five groups. B, Injection from the VLPB group showing Cre expression throughout the lateral PB, including its most ventrolateral component, the external lateral and lateral crescent (el/lc) subnuclei, as well as the adjacent central and dorsal lateral subnuclei (cl, dl). C, The VLPB+KF group, in which Cre expression included the PBel/lc and extended further rostrally and ventrally into the KF subnucleus, and in this case into the MPB as well. The area marked as KF represents the most caudal part of the KF subnucleus; most of the cell group is rostral to this level. D, Example of the VLPB+MPB group in which mice had Cre expression throughout the lateral PB, including the PBel/lc and also included the MPB. E, Example of an injection in the dl and cl PB subdivisions (DLPB group), but excluding the PBel/lc. F, In the DLPB+MPB group, Cre expression was present throughout the medial PB and also included parts of the PBdl/cl, but again excluded the PBel/lc. G, Quantification of involvement of the PBel/lc in different injection groups. The numbers of Cre-immunoreactive (Cre-ir) neurons in the PBel/lc were quantified (mean ± SEM) and compared with the numbers of Nissl-stained neurons in those cell groups. In the three groups that included the PBel/lc, an average of ∼70% of the neurons in that subnucleus expressed Cre, whereas in the DLPB and DLPB+MPB groups, <20% did (F(4,22) = 45.81; p < 0.01). scp, superior cerebellar peduncle; vl, ventrolateral PB subnucleus; vsct, ventral cerebrospinal tract. Scale bar, 100 μm.
Results
Injections of AAV-Cre produce focal loss of Vglut2 expression in PB neuronal cell bodies and axon terminals in Vglut2flox/flox mice
To delete the Vglut2 gene focally, we injected 42 homozygous Vglut2flox/flox mice stereotaxically with an AAV containing the gene for Cre recombinase, either alone or in combination with GFP. As controls, we made similar injections in five wild-type littermates and injected eight Vglut2flox/flox mice with AAV-GFP (without Cre). As in our earlier work with AAV injections (Chamberlin et al., 1998), we saw no evidence of local inflammation at the injection sites.
As expected, AAV-GFP injections (our control for nonspecific vector effects) in Vglut2flox/flox mice did not affect Vglut2 expression (Fig. 3A). However, injections of AAV-Cre in the PB in the Vglut2flox/flox mice resulted in focal deletion of Vglut2 expression in the transduced neurons (Fig. 3B). Double staining showed that essentially all neurons with Cre-immunoreactive nuclei failed to show Vglut2 mRNA by in situ hybridization (Fig. 3C,D), indicating that the expression of Cre reflects loss of Vglut2 expression (Tong et al., 2007).
Figure 3.
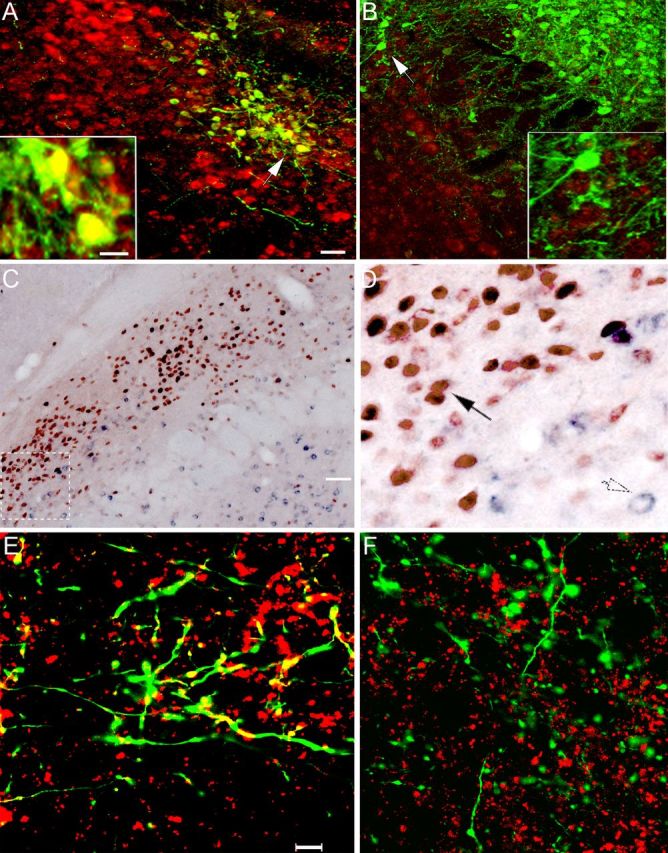
Demonstration of Vglut2 mRNA deletion in neurons transfected with Cre recombinase. A, B, Merged images showing the injection of AAV-GFP in the lateral PB of a control mouse (A) and AAV-GFP-ires-Cre in a Vglut2flox/flox mouse (B). These sections were labeled for GFP immunoreactivity (green) and for Vglut2 mRNA (red) by in situ hybridization. The insets show cells at the white arrowheads at higher magnification. In the control mouse, nearly all of the GFP+ neurons also label for Vglut2 mRNA (yellow). However, in B, there is no double-labeling, confirming that Vglut2 expression has been deleted from the GFP-expressing (and Cre-expressing) neurons. C, D, Deletion of expression of Vglut2 mRNA (purple) in the cytoplasm of neurons from Vglut2flox/flox mice that express Cre-recombinase in their nuclei (brown) after an injection of AAV-GFP-ires-Cre into the lateral PB. D, Higher-power photomicrograph of the box shown in white dashed lines in C, demonstrating that purple cytoplasm indicating Vglut2 mRNA is found only in neurons with a clear (non-Cre-stained) nucleus (open arrow, lower right), whereas none is found in the cytoplasm of the neurons with brown Cre-stained nuclei (black arrow). E, F, Vglut2 protein deletion from axon terminals. Merged z-stacks of confocal fluorescence images of a section immunostained for Vglut2 terminals (red) and GFP (green) in the basal forebrain after the microinjections of AAV-GFP (E) or AAV-GFP-ires-Cre (F) in the PB. Anterogradely labeled fibers and terminals (green) could be traced into the basal forebrain and, in mice injected with AAV-GFP, foci of Vglut2 double-labeling (yellow) were seen in axon terminals. After the AAV-GFP-ires-Cre injection in a Vglut2flox/flox mouse, the green terminals no longer contained evidence of Vglut2 staining, although many other Vglut2+ terminals (red) are seen in the background. Scale bars: A, B, 20 μm; insets in A, B, 10 μm; C, 50 μm; D, 12.5 μm; E, F, 10 μm.
In animals injected with AAV-GFP, we found that GFP-immunoreactive PB neuronal terminals in the basal forebrain coexpressed Vglut2 immunoreactivity. However, in mice injected with AAV-GFP-ires-Cre, there was no Vglut2 expression in the GFP-immunoreactive terminals in the basal forebrain (Fig. 3F). Thus, Vglut2 protein expression was also deleted from the terminals of Cre-transfected neurons.
The Cre injection sites could be divided into two groups: those that heavily involved the respiratory part of the PB, and those in which few if any neurons were transduced in the respiratory PB. Among the cases involving the respiratory PB, we found 17 that included at least 60% of the neurons in the PBel/lc subnuclei bilaterally (Fig. 2G). Within that group of 17 cases, we identified six centered on the PBel/lc (the VLPB group; Fig. 2B, VLPB), five cases including at least 50% of the neurons in the KF nucleus as well as variable numbers of MPB neurons (the VLPB+KF group; Fig. 2C), and six in which the injection also included neurons in the medial PB subdivision bordering the PBel, but not the KF subnucleus (the VLPB+MPB group; Fig. 2D). Variable numbers of neurons in the dorsal and central lateral PB (PB dl/cl) were included in all of these cases (Fig. 2B–D).
The involvement of PBM and PBdl/cl neurons in the respiratory PB cases was controlled for by two sets of injections that did not include the respiratory PB (showed Cre expression in <20% of the neurons in the PBel/lc or KF; Fig. 2G). One set of control injections (the DLPB group, n = 4; Fig. 2E, DLPB) included the dorsal, central, ventral, and internal lateral subnuclei, but few cells in the PBel/lc or MPB. The other set of control injections was centered in the MPB, but also included cells along the needle track in the PBcl/dl (the DLPB+MPB group, n = 8; Fig. 2F), but again, few cells in the PBel/lc or KF.
The full set of injections analyzed in these groups is shown in Figure 4. Note that in six cases the injection sites either were not symmetric or they missed the target. These cases were not analyzed further.
Figure 4.

Schematic representation of the extent of neurons expressing Cre in the PB complex of Vglut2flox/flox mice. L1–L3, R1–R3, Examples from each of the five groups of mice characterized in Figure 2 are shown in a single column, with the first three sections in each column representing rostrally to caudally the left side of the brain (L1–L3), and the next three the right side (R1–R3). Columns A–E correspond to the five groups of injection sites identified in Fig. 2. The outlines of the Cre-expressing regions are shown projected against Nissl-stained template sections and the different injection sites are numbered. Scale bar, 100 μm.
Effect of focal deletions of Vglut2 in the PB on RCAs
RCA protocol
Mice chronically instrumented with EEG and EMG electrodes were placed in a plethysmograph chamber that had a continuous flow of normocapnic air (baseline 2 l/min of 21% O2; balance N2). Every 300 s, the gas source was switched to a normoxic-hypercapnic (10% CO2) or hypoxic-hypercapnic mixture (10% O2 and 10% CO2) to simulate apnea for 30 s, after which the source was switched back to normocapnic air (Fig. 1). These recurrent cycles of elevated CO2 caused brief arousals in almost all trials in control mice. Arousals were judged by cortical activation (loss of delta activity in EEG), which is usually accompanied by EMG activation (Fig. 1).
Normocapnic controls
To compare the latency to arousal by hypercapnia to the latency of spontaneous arousals, we performed trials in which the channels in the gas mixer were switched every 300 s but both the channels delivered normocapnic air (O2, 21%; N2, 79%). All trials were scored in which the animals had been in NREM sleep for at least 30 s before onset of the gas exchange. In these trials, the average latency to arousal in controls (AAV-GFP and AAV-CreWT) and experimental animals ranged from 102 to 110 s (representing the expected remaining time in a typical NREM sleep bout) and was not significantly different among the treatment groups. As a result, in only ∼10–15% of trials did the animals arouse within 30 s of the switch, representing the frequency of spontaneous arousal during the test (Fig. 5).
Figure 5.
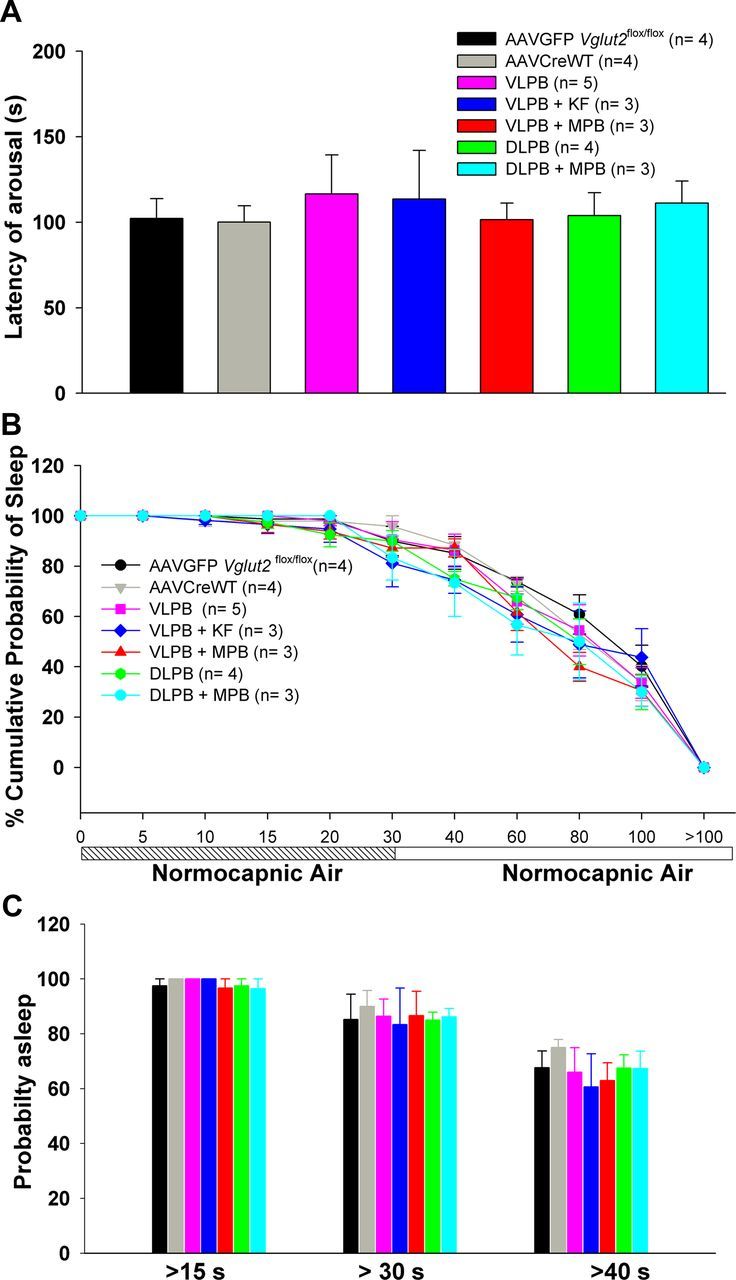
Responses of mice in trials when the test gas mixture is normocapnic air (O2, 21%; N2, 79%). A, Mean arousal latency for each group of animals with Vglut2 deletions in the PB complex, calculated from the point when the channels were switched. B, Time course of arousals for each group. C, Percentage of trials that showed arousal latencies of >15, 30, and 40 s. The numbers were quite similar for all groups, indicating that the Vglut2 deletions did not affect the likelihood of the animals waking up spontaneously during a 100 s period of observed sleep. This figure represents the normocapnic responses of the animals, which were then tested for arousals to hypercapnia and hypoxic hypercapnia as shown in Figures 6 and 7.
Arousals with repetitive 10% CO2 (hypercapnia) for 30 s
Exposure to the hypercapnic stimulus woke up the control animals after a mean of 19 s in the AAV-GFP and of 15 s in the AAV-CreWT control groups; the groups did not differ statistically. In ∼60% of trials, the control mice aroused within 15 s of onset of CO2 exposure, and in 100% of trials by 30 s (Fig. 6).
Figure 6.
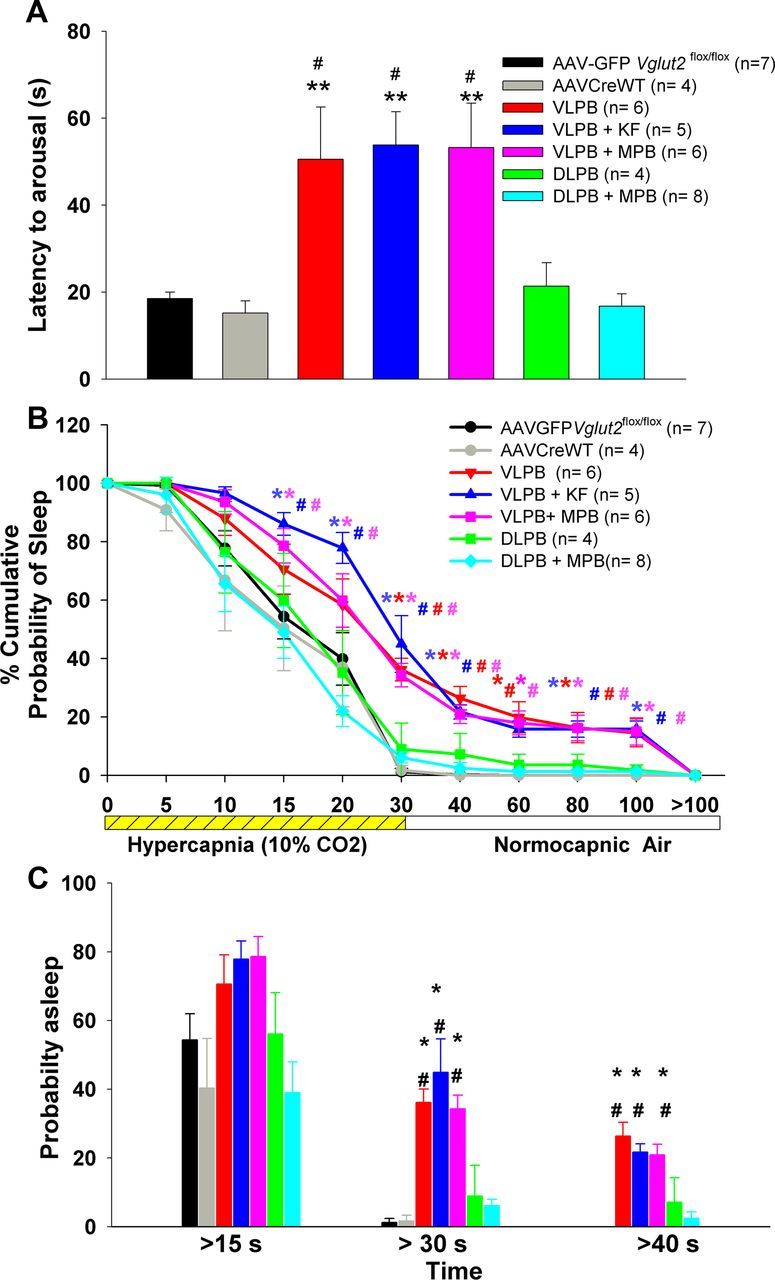
A series of graphs comparing the arousal latencies of the mice in the different experimental groups during and after exposure to a hypercapnic gas mixture (CO2, 10%; O2, 21%; N2, 69%). A, Mean arousal latency calculated from the point of increase in CO2 in the chamber. B, Time course of arousals that occurred in different groups after onset of hypercapnia and are calculated as the percentage of trials in which the animals remained asleep at each time point. C, Percentage of trials in each group that showed arousal latencies of >15, 30, and 40 s. Note that the arousals were delayed and trials with failure to arouse were more frequent in all three groups (VLPB, VLPB+MPB, and VLPB+KF) in which the deletions included the PBel/lc, but that latency to arousal in animals with deletions that avoided this area (DLPB and DLPB+MPB) was similar to control groups. *p < 0.05; **p < 0.01, compared with the control group (AAV-GFP). #p < 0.05, compared with the AAV-CreWT group. In B, the colors of * and #, correspond to respective groups, and represents significance compared with the controls. Error bars show SEM.
However, in all three groups in which Vglut2 deletion involved the PBel (Fig. 2, VLPB, red; VLPB+KF, blue; VLPB+MPB, magenta), hypercapnic arousals were significantly delayed (F(6,33) = 6.39, p < 0.001), with mean latency to arousal in all three groups being approximately three times longer than that in intact control animals. Arousals in the DLPB and DLPB+MPB groups, which largely excluded the PBel/lc neurons, were not different from controls (Fig. 6A). To examine the distribution of arousal times, we performed across all the groups a survival analysis to compare the probability of remaining asleep at different time points after onset of the CO2 stimulus (Fig. 6B), demonstrating that the awakening of animals to CO2 was diminished at virtually every time point. As a result, the VLPB, VLPB+KF, and VLPB+MPB groups also showed significant increases in failures to arouse to 30 s CO2 stimulation (F(6,33) = 17.6; p < 0.001; for all three groups compared with AAV-GFP and AAV-CreWT), while the DLPB and DLPB+MPB groups aroused within 30 s on almost all trials, similar to the control animals (Fig. 6C). In ∼40% of trials in which the animals with PBel/lc deletions did not awaken during the 30 s CO2 stimulus, the animals subsequently awakened at a pace similar to animals that had never been exposed to CO2 (Fig. 5B). Within the groups including PBel/lc neurons, there were no significant differences between the animals in which the KF or the MPB were also included and the group in which they were not.
To distinguish whether the deficit in arousal to CO2 in the groups with PBel/lc deletions was due to reduced respiratory sensation or effort, we examined the relationship of their minute ventilation (respiratory rate times volume) with arousal. We found no significant correlation of the minute ventilation during the 30 s of hypercapnia with the latency to arousal (Pearson correlation coefficient, r = −0.063; p = 0.75). Thus, it is unlikely that sensation from respiratory movement during the hypercapnia contributed to the arousal.
Arousals with repetitive hypoxic hypercapnia (CO2, 10%; O2, 10%) for 30 s
Because obstructive apneas produce varying degrees of hypoxia as well as hypercapnia, we tested a repetitive hypoxic-hypercapnic stimulus to see whether the role of the PB in hypercapnic arousal is affected by the oxygen level. In the AAV-GFP and AAV-CreWT control groups, hypoxic hypercapnia caused EEG arousal after 14 and 10 s respectively (Fig. 7). However, the experimental groups with injections involving the PBel/lc (VLPB, VLPB+KF, and VLPB+MPB) showed significantly longer latencies (F(6,30) = 13.67; p < 0.001) to arousal in response to the hypoxic-hypercapnic stimulus (Fig. 7A). In the DLPB and DLPB+MPB deletion groups, which omitted the PBel/lc, the response to hypoxic hypercapnia was similar to the response of the control group, as observed with hypercapnia. The mean latency to arousal for the groups including the PBel/lc was again 2–3 times that of the groups that did not include it.
Figure 7.
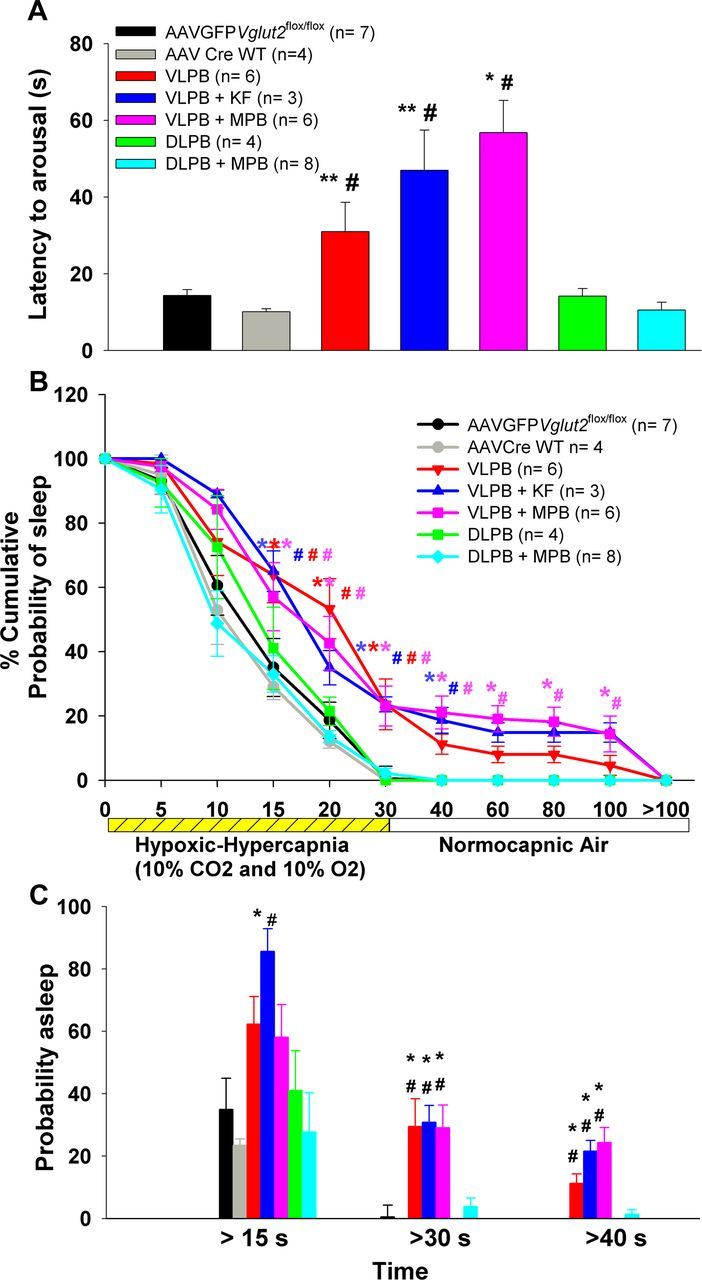
A series of graphs comparing the arousal latencies during and after exposure to a hypoxic-hypercapnic gas mixture (CO2, 10%; O2, 10%; N2, 80%). A, Mean arousal latency calculated from the point of introducing the hypoxic-hypercapnic gas mixture. B, Time course of arousals that occurred in different groups and are calculated as the percentage of trials in which the animals remained asleep at each time point. C, Percentage of trials in each group that showed arousal latencies of >15, 30, and 40 s. Note that animals in all three groups (VLPB, VLPB+MPB, and VLPB+KF) with deletions including the PBel/lc showed delayed arousals and more trials with failure to arouse, whereas the behavior of animals with deletions that avoided this region (DLPB and DLPB+MPB) was similar to that of controls.*p < 0.05 and **p < 0.01, compared with the control group (AAV-GFP); #p < 0.05, compared with the AAV-CreWT group. In B, the colors of * and #, correspond to respective groups, and represents significance compared with the controls. Error bars show SEM.
The time course of EEG arousals was also analyzed across groups (Fig. 7B) and, as with the hypercapnic arousal, the percentage of animals with PBel/lc deletions that were awakened was diminished at every time point. Similar to the hypercapnic response, on ∼35% of trials animals in the groups that included the PBel/lc deletions failed to arouse during the 30 s stimulus (F(6,30) = 19.41; p < 0.001; Fig. 7C), something that almost never occurred in animals in which the PBel/lc was intact. Again as with the hypercapnic stimulus, among the groups including deletion of Vglut2 in PBel/lc neurons, the inclusion of the KF or the MPB made no apparent difference at any time point. Thus, the addition of hypoxia to hypercapnia has very little effect on the time to arousal in our model, or on the importance of the glutamatergic neurons in the PBel/lc in arousal to both types of stimulus.
Does coexpression of other neurotransmitters in glutamatergic neurons in the PB compensate for loss of Vglut2 expression?
Deletion of Vglut2 in the PBel/lc diminished but did not abolish arousal to CO2 (Fig. 8). However, the PBel/lc neurons also express other potential neurotransmitters that may contribute to arousal, such as calcitonin gene-related peptide (CGRP; Yasui et al., 1991). Therefore we conducted a second set of experiments to kill the glutamatergic neurons selectively, by using a line of mice in which Cre-recombinase had been knocked in at the Vglut2 locus (n = 6). To genetically target killing of the Vglut2 neurons, we microinjected a conditional AAV that expresses only mCherry (a red fluorescent protein) in cells without Cre, but which expresses the lethal A subunit of diphtheria toxin in cells with Cre (AAV-lox-mCherry-lox-DTA-WPRE). The extent of neuronal loss in the PB (n = 3) as demonstrated by Neu-N staining (Fig. 8A) was comparable to the extent of loss of Vglut2 expression in the VLPB (dl/cl/el) group in the deletion experiments. The arousal latency to hypercapnia in these mice was 51 s and was not significantly different from that of mice in which Vglut2 alone had been deleted in the VLPB group (Fig. 8B). The percentage of trials that showed failures to arouse within 30 s poststimulus was also comparable to the VLPB group. Mice with either Vglut2 deletion or with nearly complete loss of glutamatergic neurons in the PBel/lc, also showed similar probabilities of sleep at various time points after CO2 onset (Fig. 8C). Thus the full effect of the loss of glutamatergic neurons in the VLPB on CO2-induced arousal appears to be accounted for by the loss of glutamatergic signaling from the PBel/lc.
Figure 8.
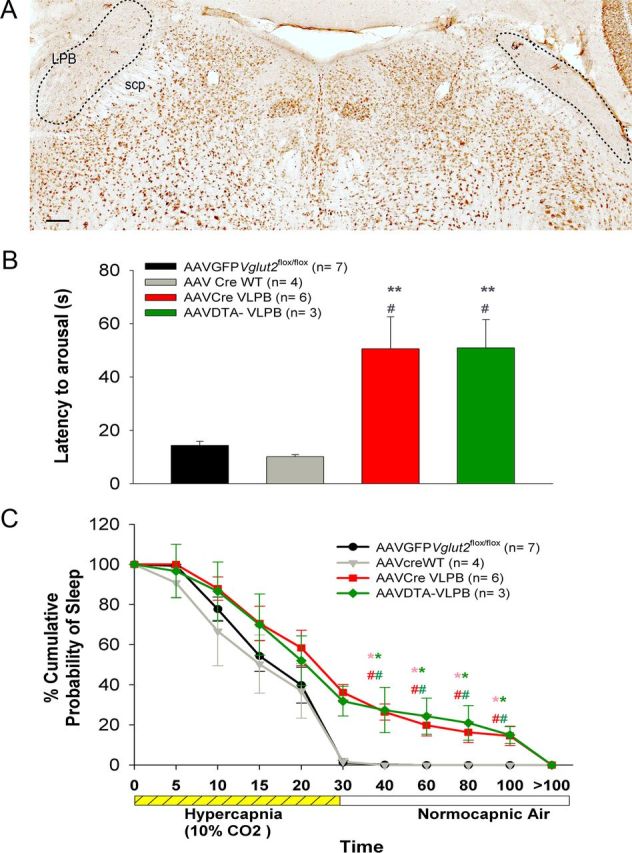
Genetically targeted killing of LPB glutamatergic neurons produces reduced CO2 arousal similar to deletion of Vglut2 in this population. A, Photomicrograph of a brain section immunostained for Neu-N, a neuronal marker, after bilateral injection of AAV-DTA killed Vglut2-Cre neurons into the LPB. Almost all of the neurons in the LPB, including the PBel/lc, were lost (lesion marked by dotted line). B, C, Graphs comparing the latency of arousal and probability of sleep during and after a hypercapnic stimulus of 30 s in mice injected bilaterally with AAV-DTA (green) compared with the control mice (black and gray) and the VLPB group from which Vglut2 was deleted in the LPB, including the PBel/lc (red), as shown in Figure 6. Note that the reduction in CO2 arousal in the two groups was essentially identical. Scale bar, 100 μm. *p < 0.05 and **p < 0.01, compared with the control group (AAV-GFP), and #p < 0.05, compared with the AAV-CreWT group. In C, the colors of * and # correspond to the respective groups and represent significance compared with the controls. Error bars show SEM.
Effect of focal deletion of Vglut2 in the PB on wake–sleep
Because a recent report demonstrated hypersomnia after large lesions of the PB (Fuller et al., 2011), we were concerned that the diminished arousal to CO2 after Vglut2 deletions from the PBel/lc might represent a generalized increase in sleepiness in these animals. We therefore assessed spontaneous sleep and wake in our mice at 5 weeks after injection of AAV-Cre (when the Vglut2 deletion approached its maximum) and compared this to wake–sleep in control animals as well as the experimental groups, recorded 1 week after injection (when preliminary time course experiments showed minimal evidence of Vglut2 deletion). Interestingly, the focal deletion of Vglut2 in the VLPB and DLPB groups, which did not include the MPB, had no significant effect on sleep amount, while deletions that included the MPB (DLPB+MPB, VLPB+MPB, and VLPB+KF) showed significant increases in NREM sleep and reductions of wake time (Fig. 9A–C).
Figure 9.

A series of graphs to show the effect of loss of Vglut2 expression in the different subdivisions of the PB on wake–sleep percentages and delta power in the EEG. A–C, Percentage (mean ± SEM) of wakefulness, NREM sleep, and REM sleep, respectively, during the 12 h light/dark period and over the full 24 h, in each group of control and experimental animals. D–F, Effect of focal deletion of Vglut2 on the EEG delta power (0.5–4.0 Hz) during NREM sleep, REM sleep, and wakefulness, respectively, averaged over 24 h. Comparison is made between 1 week after AAV-Cre injection, when there has been little recombination and sleep is similar to AAV-GFP-injected controls, and 5 weeks, when recombination is essentially complete. Note that at 5 weeks, only deletions that included the MPB increased NREM sleep and delta power in the EEG during NREM sleep. *p < 0.05, **p < 0.01 compared with AAV-Cre Vglut2flox/flox after 1 week; #p < 0.05 compared with AAV-GFP Vglut2flox/flox and AAV-CreWT after 1 week and after 5 weeks.
The amount of NREM sleep did not differ between measurements in weeks one or five in the control mice, including both Vglut2flox/flox mice injected with AAV-GFP, and wild-type mice injected with AAV-Cre, with both groups spending an average of 49.7% of time in NREM sleep during the light phase and 30% of time during the dark phase. The NREM sleep time in the Vglut2flox/flox mice injected with AAV-Cre also did not differ from controls 1 week after injection. By contrast, at 5 weeks, significant changes in sleep amounts emerged in the groups of Vglut2flox/flox animals injected with AAV-Cre into the MPB. During the light phase, only the VLPB+MPB group showed a moderate increase in NREM sleep by 16.95% compared with week 1 AAV-Cre control (F(6,72) = 19.78, p < 0.001, 2-way ANOVA, followed by post hoc test for multiple comparisons). During the dark period, all three groups that included deletions in the MPB (DLPB+MPB, VLPB+MPB, and VLPB+KF) showed increases in NREM sleep. The most pronounced increase in NREM sleep was in the DLPB+MPB group with the most extensive MPB Vglut2 deletion (42.8% increase in NREM sleep compared with week 1 controls and 38.43% compared with week 5 controls; F(6,72) = 25.96, p < 0.001, groups times 2-way ANOVA followed by multiple comparisons). Comparatively smaller increases in NREM sleep were seen in the VLPB+KF (36.18%) and VLPB+MPB groups (34.20%), in which smaller numbers of MPB neurons, mainly along its lateral margin near the PBel and KF, were affected. Over a 24 h period, the amount of NREM sleep was also significantly higher (F(6,72) = 34.23; p < 0.001) in the DLPB+MPB group (23.57%); followed by the VLPB+MPB group (21.05%), and the VLPB+KF group (20.24%), compared with 1 and 5 week controls (Fig. 9B). The Vglut2 deletion in the MPB caused an increase in both the mean duration and number of NREM sleep bouts, but because of the variance within groups, neither of these reached statistical significance. Thus, the increase in NREM sleep amount probably reflects the increases in both bout duration and frequency, but our sample was not large enough to make this distinction.
Reciprocal changes were seen in the amount of the wakefulness in the groups where the Vglut2 deletions included the MPB (DLPB+MPB, VLPB+MPB, and VLPB+KF) (Fig. 9A). The amount of REM sleep (Fig. 9C) was not significantly different in any of the groups compared with the both AAV-GFP and AAV-Cre controls at 1 week. In particular, the animals with deletions of the PBel/lc, but not including the MPB, showed the greatest loss of CO2-induced arousal, but had no increase in baseline sleep.
Effect of focal deletion of Vglut2 in the PB on delta activity
To determine whether the mice with Vglut2 deletions of the PBel/lc might have had deeper sleep that would have caused them to be more difficult to awaken to CO2 stimulation despite normal total sleep amounts, we compared the percentage of total EEG power in the delta frequency range (0.5–4 Hz) across groups while awake and during NREM and REM sleep. Because it is difficult to compare absolute values of EEG power across animals due to minor differences in electrode placement, each animal's EEG power at 1 week served as its own control and the percentage change from weeks 1 to 5 in delta power was analyzed for each animal. This change was then compared across the groups. NREM EEG delta power significantly increased only in the two groups that included the largest part of the MPB (VLPB+MPB group and DLPB+MPB group) (F(6,70) = 22.62, treatment groups times time, p < 0.001; Fig. 9D). A trend toward an increase in the delta power in the VLPB+KF group was not statistically significant.
Delta power during wakefulness and REM sleep was not significantly different across all the groups. A representative hypnogram from a mouse in the DLPB+MPB group (Fig. 10) illustrates the increase in EEG delta power at week 5 compared with week 1.
Figure 10.

Representative distribution of sleep and delta power (as shown in Fig. 9) across 24 h in a DLPB+MPB mouse. A, At baseline, 1 week after AAV-Cre injection. B, After deletion of Vglut2 from most neurons 5 weeks after injection. In each panel, the top trace shows the hypnogram; the middle trace shows delta power in the EEG, coded green for NREM sleep, red for REM sleep, and black for wakefulness; and the lower trace shows integrated EMG (with the same color coding). Note that at 5 weeks after the deletion of Vglut2 in the MPB, the mouse had few long wake bouts, spending more time in NREM sleep, and showed greater delta power in the EEG during NREM sleep.
Arousals in response to an acoustic stimulus
To determine whether mice with large PB deletions were simply hypoarousable in general, we examined the responses in the group of mice with the greatest deficits in wakefulness and CO2 response (VLPB+MPB group) and control mice to an acoustic stimulus. A tone was presented at different intensities (2, 5, 10, and 30 dB) for 10 s every 300 s in ascending order of intensity (Fig. 11). Although the VLPB+MPB mice had reduced responses to CO2 and were sleepy (i.e., showed an increase in NREM sleep and delta power during NREM sleep during the day), their latency to arousal in response to the sound was similar to that of the control group. At low levels of sound intensity (2 and 5 dB), both groups showed similar numbers of failures to arouse, suggesting that they had similar sound thresholds (i.e., the PB deletions had not affected hearing or the sound threshold needed to cause arousal). These experiments indicate that the delays and frequent failures of arousal to hypercapnia or hypoxic hypercapnia in the animals with PBel/lc deletions were due to a selective insensitivity to respiratory chemosensory stimuli.
Figure 11.

Response of mice with extensive Vglut2 deletions in the VLPB+MPB group to acoustic arousal, compared with control animals. A, Latency of arousals to a 4 kHz tone at 2, 5, 10, and 30 dB, given for a period of 10 s every 300 s. B, Percentage of trials with failure to arouse at each dB level. Note that both the latency and threshold of arousal is identical in both groups when using an acoustic stimulus, indicating that the failure to arouse to hypercapnia and hypoxic hypercapnia (as shown in Figs. 6, 7) in this group of experimental mice is not due to an overall reduction in arousability. Error bars show SEM.
Discussion
Our results indicate that deletions of the Vglut2 gene from the PB el/lc resulted in approximately threefold longer mean latency to EEG arousal from either hypercapnia or hypoxic hypercapnia, and frequently resulted in failure of the animals to arouse at all during the stimulus. Based on cFos activation during hypercapnia and anatomical tracing studies, the portion of the PB that receives respiratory chemoreceptor inputs includes not only the PBel and lc, but also the KF and the adjacent ventrolateral corner of the MPB. However, essentially similar responses were seen after deletions that involved the PBel/lc, but did not include the KF or MPB, as after deletions that included the latter territories, and no change in arousal was seen after deletions that just involved the MPB. Therefore we conclude that the key site for transmitting hypercapnic arousal signals is the PBel/lc. As the PBlc is a thin layer of cells along the lateral surface of the PBel that mainly projects to the medulla, while the PBel occupies the bulk of this territory and projects to the forebrain (see below), we propose that the PBel glutamatergic neurons are a key source of the EEG arousal stimulus in response to increased CO2 levels.
The reduction in arousal to CO2 was not due to overall sleepiness, as animals with VLPB deletions that did not include the MPB had essentially normal amounts of wakefulness and normal EEG power spectra. Even the group that included the MPB along with the VLPB had normal arousal to acoustic stimuli. Hence, the loss of arousal after PBel deletions was specific to respiratory, as opposed to acoustic stimuli.
Afferent pathways to the PB in hypercapnia-induced cortical arousals
Hypercapnia may cause arousal by activating either central or peripheral sensory pathways. Peripheral CO2 receptors in the olfactory system (Hu et al., 2007) may be active at levels as low as 1% CO2, but the latency to arousal in our mice is probably too long for this pathway to play a role. Carotid sinus chemoreceptors, which respond to CO2 in arterial blood, are probably consistent with the latency to arousal that we observed. These afferents terminate in the caudolateral part of the NTS (Panneton and Loewy, 1980). We do not think that vagal mechanoreceptor input due to increased respiratory efforts contributed to arousal in our mice (Gleeson et al., 1990), as latency to arousal did not correlate with minute ventilation. However, this input also terminates in the caudolateral part of the NTS (Kalia and Richter, 1988). This area projects heavily to the PBel/lc, the KF, the far lateral part of the MPB, and the lateral parts of the dl and cl subnuclei (Herbert et al., 1990; Song et al., 2011).
Central respiratory CO2 receptive neurons, which respond to the pH of the bicarbonate buffered CSF, probably take too long to account for normal arousals, although they may contribute in animals with prolonged latencies due to PBel/lc deletions. CO2 responsive glutamatergic neurons along the ventrolateral surface of the rostral medulla in the retrotrapezoid nucleus project intensely to the same parts of the PB as the respiratory part of the NTS (Rosin et al., 2006; Guyenet et al., 2008; Bochorishvili et al., 2012). Thus, the PB is a key site of convergence for the ascending CO2 chemosensory pathways, underscoring its likely role in respiratory responses.
Medullary serotoninergic raphe neurons are also CO2-responsive, and mice lacking these neurons have impaired arousal to CO2 (Buchanan and Richerson, 2010; Brust et al., 2012). However, CO2 responsiveness can be restored by a 5HT2A agonist (Smith et al., 2012), suggesting that serotonin may be a neuromodulator that sets the level of responsiveness, rather than transmitting the chemosensory arousal signal itself. As the PB receives substantial serotoninergic innervation (Steinbusch, 1981; Block and Hoffman, 1987; Miller et al., 2011; Bang et al., 2012), it seems likely that the contribution of the serotoninergic system to CO2 arousals is at least in part mediated by its input to the PB. On the other hand, the persistence of arousal to CO2 after PB deletions or lesions, even if delayed, suggests that there are other alternative pathways, and that the serotonin system may provide facilitatory input to those as well.
PBel neurons also receive spinal and trigeminal pain afferents (Bernard et al., 1989). Like the respiratory chemosensory inputs, these axons run along the superficial lateral surface of the PBel, where they contact the distal dendrites of PBel neurons. The PBel neurons may represent a circuit that can produce potent forebrain arousal under conditions of visceral sensory distress, such as pain or respiratory insufficiency, but they apparently are not important for maintaining baseline wakefulness or in response to lemniscal stimuli, such as sound.
Distinct roles for PBel and MPB in arousal
Our Vglut2 deletions encompassed the entire region of the PB that receives respiratory chemoreceptor input (Teppema et al., 1997; Berquin et al., 2000), including the PBel/lc, KF, and the most lateral part of the MPB. However, lesions that did not include the PBel/lc failed to cause loss of arousal to CO2 stimulation. The KF and the PBlc mainly project caudally to the medullary and spinal sites associated with respiratory regulation (Herbert et al., 1990; Chamberlin and Saper, 1994; Yokota et al., 2007, 2012), which would be consistent with those cell groups augmenting respiratory drive during hypercapnia (Mizusawa et al., 1995). The PBel consists of neurons that express CGRP and that project heavily to the lateral hypothalamus, basal forebrain, and amygdala. This pathway would be a strong candidate for causing forebrain arousal during respiratory chemoreceptor stimulation. The MPB also provides projections to the lateral hypothalamus and basal forebrain, as well as to the cerebral cortex (Saper and Loewy, 1980; Fulwiler and Saper, 1984; Bester et al., 1997). Hence, it could also be a source of arousal responses to hypercapnia. However, large deletions in the MPB that did not include the PBel caused little change in response to hypercapnia or hypoxic hypercapnia, so the MPB is not likely to be involved in that pathway.
On the other hand, increased NREM sleep time and elevated delta power in the EEG during NREM sleep were associated mainly with deletions that involved the MPB. These cases also involved deletion of Vglut2 in various combinations of the PBdl, cl, and el subnuclei. But deletions in these lateral PB subnuclei, without the MPB, did not affect NREM sleep time or delta power, so the effect can be attributed to the MPB itself. These observations suggest that glutamatergic neurons in the MPB make a contribution toward maintaining the baseline waking state, but not chemosensory arousal, and that the chemosensory arousals elicited from the PBel were likely due to the projections of those cell groups outside the PB, and not to intrinsic projections to MPB neurons that drive baseline arousal.
Our findings that Vglut2 deletions involving the MPB cause an increase in NREM sleep and in delta power during NREM sleep are consistent with the observations of Fuller and colleagues after cell-specific ablation of PB neurons (Fuller et al., 2011). This increase in delta power is similar to that seen after ablation of basal forebrain noncholinergic neurons in previous studies (Kaur et al., 2008; Fuller et al., 2011) and underscores the importance of the parabrachial-basal forebrain pathway in maintaining a waking state. The increased EEG delta power during NREM sleep, but not during REM sleep or wakefulness, is similar to the rebound after sleep deprivation, suggesting that the MPB glutamatergic neurons may play a role in counteracting the homeostatic sleep drive that builds up during prolonged wakefulness.
Fuller and colleagues suggested that the PB drives arousal via projections to the basal forebrain (Fuller et al., 2011). They found a large and topographically organized projection to the basal forebrain from a population of glutamatergic neurons in the dorsolateral pons that spans from the PC through the MPB and LPB, with the most medial of these neurons projecting to the most medial parts of the basal forebrain, and the most lateral parts to the more lateral basal forebrain. However, PBel neurons have other targets in the lateral hypothalamus and amygdala that could also contribute to arousal, and these possibilities have not been tested.
In conclusion, we have identified a major component of the brain circuitry that permits arousal from sleep during periods of insufficient respiration, as may occur in humans under conditions of asphyxia (e.g., when the face is covered during sleep, or when there is a fire), or during apnea or hypopnea (e.g., in neuromuscular diseases or in either central or obstructive sleep apnea). Under these conditions, there is a convergence of both hypercapnic and hypoxic respiratory chemosensory inputs in the PB, particularly in the PBel, that are critical for subsequent forebrain arousal. Failure of this circuit may be the basis for such disorders as sudden infant death syndrome or Ondine's curse (individuals who fail to breathe sufficiently, particularly during sleep), whereas engaging this circuit during sleep apnea may be lifesaving, but may result in the complications of sleep fragmentation, which can cause cognitive, cardiovascular, and metabolic consequences.
Footnotes
This work was supported by National Institutes of Health Grant P01 HL095491 and a grant from the G. Harold and Leila Y. Mathers Foundation. E.E.H. received postdoctoral support from Grants F32NS063673 and T32HL007901. We thank Quan Ha and Minh Ha for their excellent technical support, and Sathyajit Bandaru for maintaining the mouse breeding program. We are also indebted to Drs. Bradford Lowell and Qingchun Tong, who produced the Vglut2flos/flox and Vglut2-ires-Cre mice and supplied us with the breeder pairs, and we thank Dr. Rolf Sprengel at University of Heidelberg for donating the plasmid construct for the AAV-iCre-2A-Venus, and to Dr. Dr. Jeng-Shin Lee at Harvard Gene Therapy Initiative for help in packaging it.
References
- Abbott SB, Stornetta RL, Fortuna MG, Depuy SD, West GH, Harris TE, Guyenet PG. Photostimulation of retrotrapezoid nucleus phox2b-expressing neurons in vivo produces long-lasting activation of breathing in rats. J Neurosci. 2009;29:5806–5819. doi: 10.1523/JNEUROSCI.1106-09.2009. [DOI] [PMC free article] [PubMed] [Google Scholar]
- Bang SJ, Jensen P, Dymecki SM, Commons KG. Projections and interconnections of genetically defined serotonin neurons in mice. Eur J Neurosci. 2012;35:85–96. doi: 10.1111/j.1460-9568.2011.07936.x. [DOI] [PMC free article] [PubMed] [Google Scholar]
- Bernard JF, Peschanski M, Besson JM. A possible spino (trigemino)-ponto-amygdaloid pathway for pain. Neurosci Lett. 1989;100:83–88. doi: 10.1016/0304-3940(89)90664-2. [DOI] [PubMed] [Google Scholar]
- Berquin P, Bodineau L, Gros F, Larnicol N. Brainstem and hypothalamic areas involved in respiratory chemoreflexes: a Fos study in adult rats. Brain Res. 2000;857:30–40. doi: 10.1016/S0006-8993(99)02304-5. [DOI] [PubMed] [Google Scholar]
- Bester H, Besson JM, Bernard JF. Organization of efferent projections from the parabrachial area to the hypothalamus: a Phaseolus vulgaris-leucoagglutinin study in the rat. J Comp Neurol. 1997;383:245–281. doi: 10.1002/(SICI)1096-9861(19970707)383:3<245::AID-CNE1>3.0.CO;2-3. [DOI] [PubMed] [Google Scholar]
- Block CH, Hoffman GE. Neuropeptide and monoamine components of the parabrachial pontine complex. Peptides. 1987;8:267–283. doi: 10.1016/0196-9781(87)90102-1. [DOI] [PubMed] [Google Scholar]
- Bochorishvili G, Stornetta RL, Coates MB, Guyenet PG. Pre-Botzinger complex receives glutamatergic innervation from galaninergic and other retrotrapezoid nucleus neurons. J Comp Neurol. 2012;520:1047–1061. doi: 10.1002/cne.22769. [DOI] [PMC free article] [PubMed] [Google Scholar]
- Brust RD, Corcoran AE, Ray RS, Nattie E, Richerson GB. Refining the serotonergic contribution to central chemosensitivity. Program #897.23/SS15 Neuroscience Meeting Planner; New Orleans, LA: Society for Neuroscience; 2012. Dy. [Google Scholar]
- Buchanan GF, Richerson GB. Central serotonin neurons are required for arousal to CO2. Proc Natl Acad Sci U S A. 2010;107:16354–16359. doi: 10.1073/pnas.1004587107. [DOI] [PMC free article] [PubMed] [Google Scholar]
- Chamberlin NL. Functional organization of the parabrachial complex and intertrigeminal region in the control of breathing. Respir Physiol Neurobiol. 2004;143:115–125. doi: 10.1016/j.resp.2004.03.015. [DOI] [PubMed] [Google Scholar]
- Chamberlin NL, Saper CB. Topographic organization of respiratory responses to glutamate microstimulation of the parabrachial nucleus in the rat. J Neurosci. 1994;14:6500–6510. doi: 10.1523/JNEUROSCI.14-11-06500.1994. [DOI] [PMC free article] [PubMed] [Google Scholar]
- Chamberlin NL, Du B, de Lacalle S, Saper CB. Recombinant adeno-associated virus vector: use for transgene expression and anterograde tract tracing in the CNS. Brain Res. 1998;793:169–175. doi: 10.1016/S0006-8993(98)00169-3. [DOI] [PMC free article] [PubMed] [Google Scholar]
- Depuy SD, Kanbar R, Coates MB, Stornetta RL, Guyenet PG. Control of breathing by raphe obscurus serotonergic neurons in mice. J Neurosci. 2011;31:1981–1990. doi: 10.1523/JNEUROSCI.4639-10.2011. [DOI] [PMC free article] [PubMed] [Google Scholar]
- Fuller PM, Fuller P, Sherman D, Pedersen NP, Saper CB, Lu J. Reassessment of the structural basis of the ascending arousal system. J Comp Neurol. 2011;519:933–956. doi: 10.1002/cne.22559. [DOI] [PMC free article] [PubMed] [Google Scholar]
- Fulwiler CE, Saper CB. Subnuclear organization of the efferent connections of the parabrachial nucleus in the rat. Brain Res. 1984;319:229–259. doi: 10.1016/0165-0173(84)90012-2. [DOI] [PubMed] [Google Scholar]
- Gleeson K, Zwillich CW, White DP. The influence of increasing ventilatory effort on arousal from sleep. Am Rev Respir Dis. 1990;142:295–300. doi: 10.1164/ajrccm/142.2.295. [DOI] [PubMed] [Google Scholar]
- Graziano A, Liu XB, Murray KD, Jones EG. Vesicular glutamate transporters define two sets of glutamatergic afferents to the somatosensory thalamus and two thalamocortical projections in the mouse. J Comp Neurol. 2008;507:1258–1276. doi: 10.1002/cne.21592. [DOI] [PubMed] [Google Scholar]
- Guyenet PG, Stornetta RL, Bayliss DA. Retrotrapezoid nucleus and central chemoreception. J Physiol. 2008;586:2043–2048. doi: 10.1113/jphysiol.2008.150870. [DOI] [PMC free article] [PubMed] [Google Scholar]
- Herbert H, Moga MM, Saper CB. Connections of the parabrachial nucleus with the nucleus of the solitary tract and the medullary reticular formation in the rat. J Comp Neurol. 1990;293:540–580. doi: 10.1002/cne.902930404. [DOI] [PubMed] [Google Scholar]
- Hu J, Zhong C, Ding C, Chi Q, Walz A, Mombaerts P, Matsunami H, Luo M. Detection of near-atmospheric concentrations of CO2 by an olfactory subsystem in the mouse. Science. 2007;317:953–957. doi: 10.1126/science.1144233. [DOI] [PubMed] [Google Scholar]
- Jain V. Clinical perspective of obstructive sleep apnea-induced cardiovascular complications. Antioxid Redox Signal. 2007;9:701–710. doi: 10.1089/ars.2007.1558. [DOI] [PubMed] [Google Scholar]
- Kalia M, Richter D. Rapidly adapting pulmonary receptor afferents: I. Arborization in the nucleus of the tractus solitarius. J Comp Neurol. 1988;274:560–573. doi: 10.1002/cne.902740406. [DOI] [PubMed] [Google Scholar]
- Kaur S, Junek A, Black MA, Semba K. Effects of ibotenate and 192IgG-saporin lesions of the nucleus basalis magnocellularis/substantia innominata on spontaneous sleep and wake states and on recovery sleep after sleep deprivation in rats. J Neurosci. 2008;28:491–504. doi: 10.1523/JNEUROSCI.1585-07.2008. [DOI] [PMC free article] [PubMed] [Google Scholar]
- Kaur S, Thankachan S, Begum S, Liu M, Blanco-Centurion C, Shiromani PJ. Hypocretin-2 saporin lesions of the ventrolateral periaquaductal gray (vlPAG) increase REM sleep in hypocretin knockout mice. PLoS One. 2009;4:e6346. doi: 10.1371/journal.pone.0006346. [DOI] [PMC free article] [PubMed] [Google Scholar]
- Kim Y, Laposky AD, Bergmann BM, Turek FW. Repeated sleep restriction in rats leads to homeostatic and allostatic responses during recovery sleep. Proc Natl Acad Sci U S A. 2007;104:10697–10702. doi: 10.1073/pnas.0610351104. [DOI] [PMC free article] [PubMed] [Google Scholar]
- Loredo JS, Ziegler MG, Ancoli-Israel S, Clausen JL, Dimsdale JE. Relationship of arousals from sleep to sympathetic nervous system activity and BP in obstructive sleep apnea. Chest. 1999;116:655–659. doi: 10.1378/chest.116.3.655. [DOI] [PubMed] [Google Scholar]
- Miller RL, Stein MK, Loewy AD. Serotonergic inputs to FoxP2 neurons of the pre-locus coeruleus and parabrachial nuclei that project to the ventral tegmental area. Neuroscience. 2011;193:229–240. doi: 10.1016/j.neuroscience.2011.07.008. [DOI] [PMC free article] [PubMed] [Google Scholar]
- Mizusawa A, Ogawa H, Kikuchi Y, Hida W, Shirato K. Role of the parabrachial nucleus in ventilatory responses of awake rats. J Physiol. 1995;489:877–884. doi: 10.1113/jphysiol.1995.sp021100. [DOI] [PMC free article] [PubMed] [Google Scholar]
- Neckelmann D, Ursin R. Sleep stages and EEG power spectrum in relation to acoustical stimulus arousal threshold in the rat. Sleep. 1993;16:467–477. [PubMed] [Google Scholar]
- Niu JG, Yokota S, Tsumori T, Qin Y, Yasui Y. Glutamatergic lateral parabrachial neurons innervate orexin-containing hypothalamic neurons in the rat. Brain Res. 2010;1358:110–122. doi: 10.1016/j.brainres.2010.08.056. [DOI] [PubMed] [Google Scholar]
- Panneton WM, Loewy AD. Projections of the carotid sinus nerve to the nucleus of the solitary tract in the cat. Brain Res. 1980;191:239–244. doi: 10.1016/0006-8993(80)90326-1. [DOI] [PubMed] [Google Scholar]
- Rosin DL, Chang DA, Guyenet PG. Afferent and efferent connections of the rat retrotrapezoid nucleus. J Comp Neurol. 2006;499:64–89. doi: 10.1002/cne.21105. [DOI] [PubMed] [Google Scholar]
- Saper CB, Loewy AD. Efferent connections of the parabrachial nucleus in the rat. Brain Res. 1980;197:291–317. doi: 10.1016/0006-8993(80)91117-8. [DOI] [PubMed] [Google Scholar]
- Smith HR, Richerson GB, Buchanan GF. Activation of 5-HT2A receptors recovers hypercapnia-induced arousal in genetically central 5-HT neuron deficient mice. Program #799.07/BBB8 Neuroscience Meeting Planner; New Orleans, LA: Society for Neuroscience; 2012. [Google Scholar]
- Song G, Xu H, Wang H, Macdonald SM, Poon CS. Hypoxia-excited neurons in NTS send axonal projections to Kolliker-Fuse/parabrachial complex in dorsolateral pons. Neuroscience. 2011;175:145–153. doi: 10.1016/j.neuroscience.2010.11.065. [DOI] [PMC free article] [PubMed] [Google Scholar]
- Steinbusch HW. Distribution of serotonin-immunoreactivity in the central nervous system of the rat-cell bodies and terminals. Neuroscience. 1981;6:557–618. doi: 10.1016/0306-4522(81)90146-9. [DOI] [PubMed] [Google Scholar]
- Tang W, Ehrlich I, Wolff SB, Michalski AM, Wölfl S, Hasan MT, Lüthi A, Sprengel R. Faithful expression of multiple proteins via 2A-peptide self-processing: a versatile and reliable method for manipulating brain circuits. J Neurosci. 2009;29:8621–8629. doi: 10.1523/JNEUROSCI.0359-09.2009. [DOI] [PMC free article] [PubMed] [Google Scholar]
- Teppema LJ, Veening JG, Kranenburg A, Dahan A, Berkenbosch A, Olievier C. Expression of c-fos in the rat brainstem after exposure to hypoxia and to normoxic and hyperoxic hypercapnia. J Comp Neurol. 1997;388:169–190. doi: 10.1002/(SICI)1096-9861(19971117)388:2<169::AID-CNE1>3.0.CO;2-#. [DOI] [PubMed] [Google Scholar]
- Tong Q, Ye C, McCrimmon RJ, Dhillon H, Choi B, Kramer MD, Yu J, Yang Z, Christiansen LM, Lee CE, Choi CS, Zigman JM, Shulman GI, Sherwin RS, Elmquist JK, Lowell BB. Synaptic glutamate release by ventromedial hypothalamic neurons is part of the neurocircuitry that prevents hypoglycemia. Cell Metab. 2007;5:383–393. doi: 10.1016/j.cmet.2007.04.001. [DOI] [PMC free article] [PubMed] [Google Scholar]
- Tregear S, Reston J, Schoelles K, Phillips B. Obstructive sleep apnea and risk of motor vehicle crash: systematic review and meta-analysis. J Clin Sleep Med. 2009;5:573–581. [PMC free article] [PubMed] [Google Scholar]
- Vong L, Ye C, Yang Z, Choi B, Chua S, Jr, Lowell BB. Leptin action on GABAergic neurons prevents obesity and reduces inhibitory tone to POMC neurons. Neuron. 2011;71:142–154. doi: 10.1016/j.neuron.2011.05.028. [DOI] [PMC free article] [PubMed] [Google Scholar]
- Yasui Y, Saper CB, Cechetto DF. Calcitonin gene-related peptide (CGRP) immunoreactive projections from the thalamus to the striatum and amygdala in the rat. J Comp Neurol. 1991;308:293–310. doi: 10.1002/cne.903080212. [DOI] [PubMed] [Google Scholar]
- Yokota S, Oka T, Tsumori T, Nakamura S, Yasui Y. Glutamatergic neurons in the Kolliker-Fuse nucleus project to the rostral ventral respiratory group and phrenic nucleus: a combined retrograde tracing and in situ hybridization study in the rat. Neurosci Res. 2007;59:341–346. doi: 10.1016/j.neures.2007.08.004. [DOI] [PubMed] [Google Scholar]
- Yokota S, Kaur S, Van der Horst V, Chamberlin NL, Saper CB. Mouse parabrachial neurons projecting to the rostral ventral respiratory group, phrenic and hypoglossal neurons are activated by hypercapnia. Sleep. 2012;Vol 35(Suppl):A-44. [Google Scholar]