

Abstract
People vary in their ability to learn new motor skills. We hypothesize that between‐subject variability in brain structure and function can explain differences in learning. We use brain functional and structural MRI methods to characterize such neural correlates of individual variations in motor learning. Healthy subjects applied isometric grip force of varying magnitudes with their right hands cued visually to generate smoothly‐varying pressures following a regular pattern. We tested whether individual variations in motor learning were associated with anatomically colocalized variations in magnitude of functional MRI (fMRI) signal or in MRI differences related to white and grey matter microstructure. We found that individual motor learning was correlated with greater functional activation in the prefrontal, premotor, and parietal cortices, as well as in the basal ganglia and cerebellum. Structural MRI correlates were found in the premotor cortex [for fractional anisotropy (FA)] and in the cerebellum [for both grey matter density and FA]. The cerebellar microstructural differences were anatomically colocalized with fMRI correlates of learning. This study thus suggests that variations across the population in the function and structure of specific brain regions for motor control explain some of the individual differences in skill learning. This strengthens the notion that brain structure determines some limits to cognitive function even in a healthy population. Along with evidence from pathology suggesting a role for these regions in spontaneous motor recovery, our results also highlight potential targets for therapeutic interventions designed to maximize plasticity for recovery of similar visuomotor skills after brain injury. Hum Brain Mapp, 2011. © 2010 Wiley‐Liss, Inc.
Keywords: motor learning, brain plasticity, diffusion imaging, functional MRI, voxel‐based morphometry
INTRODUCTION
There is considerable interindividual variation in the capacity of healthy adults to learn new motor skills [Frensch and Miner, 1994; Tubau et al., 2007; Unsworth and Engle, 2005]. Such interindividual heterogeneity may account for individual differences in behavioral adaptation [Krubitzer, 2007] that could become clinically‐significant in the context of brain pathology [Cramer, 2008], where it may explain differences in recovery potential [Stinear et al., 2007]. Imaging studies of motor learning have provided evidence both for functional and structural brain plasticity in specific, behaviorally‐relevant brain regions that putatively underlie such phenomena [Doyon et al., 2002; Draganski et al., 2004; Floyer‐Lea and Matthews, 2004, 2005; Floyer‐Lea et al., 2006; Lehericy et al., 2005; Ungerleider et al., 2002].
Previous studies testing for associations between MRI‐derived measures and performance of simple motor or cognitive tasks suggest that behavioral variation even between healthy, nonexpert individuals can be explained in part by individual differences in brain function and structure [Grabner et al., 2007; Jenkins et al., 1994; Johansen‐Berg et al., 2007; Karni et al., 1995; Klingberg et al., 2000; Tamas Kincses et al., 2008]. Individual differences in forms of learning correlate with variations in learning‐related brain activation [Tamas Kincses et al., 2008] and, in independent studies using different paradigms, with structure [Della‐Maggiore et al., 2009]. However, the possible relationships between brain structural and functional variations that may explain such behavioral differences have not been defined explicitly. Here we combined structural and functional MRI to investigate the imaging correlates of the individual variation in motor learning. This multimodal approach should better define brain regions exhibiting significant learning‐related plasticity with the acquisition of new skills.
We used a visuomotor tracking task, based on one used previously [Floyer‐Lea and Matthews, 2004, 2005], which requires subjects to learn a sequence of force generating movements. Previous functional studies of a similar task have identified patterns of learning‐related activity [Floyer‐Lea and Matthews, 2004, 2005]. Reductions in activity of areas within the sensorimotor and prefrontal cortex, caudate and cerebellar cortex, and increases in cerebellar dentate, thalamus, and putamen are found over the course of short‐term learning of a sequence of movements. We predicted that covariation in structure and function of some or all of these regions would relate to variation in motor learning behavior. We first tested the hypothesis that individual behavioral variations in short‐term motor learning can be explained by differences in functional activity across some or all of these learning‐related regions. Second, we hypothesized that variations in learning potential are associated with differences in the structural properties of these same task‐related regions, as acquisition of motor skills relies on functional integration across brain circuits [Doyon et al., 2002; Floyer‐Lea and Matthews, 2005; Hikosaka et al., 2002; Lehericy et al., 2005] involving specific grey matter (GM) regions and the white matter (WM) pathways connecting them. Our rationale for these hypotheses is that structural features of the white matter, such as myelin thickness and axon diameter, will influence the speed and efficiency of information transfer along a pathway [Gillespie and Stein, 1983] and are therefore likely to influence behavioral performance that depends on that pathway [Fields, 2008]. Similarly, anatomical properties of a grey matter region, such as cell density and cell size, will modulate the processing abilities of the region and in turn influence behavioral responses that depend on such processing. Finally, we combined functional and structural imaging correlates of individual variation in motor learning to evaluate the correspondence between these measures and individual differences in motor learning.
MATERIALS AND METHODS
Participants
Twelve right‐handed healthy volunteers (mean ± SD age: 30.1 ± 5.3 years; 3 men, nine women) with normal visual acuity participated in this study. All subjects gave informed consent according to the protocol approved by the local research Ethics Committee and in compliance with the Declaration of Helsinki.
Experimental Setup
An isometric visuomotor tracking task was used to assess motor skill learning (Supporting Information Fig. S1). Subjects were asked to track the vertical movements of a computer‐controlled bar (the target bar) displayed on a screen by altering the amount of pressure applied to a hand‐held plastic rod (with a diameter of 40 mm) containing a strain gauge located between its two halves. The maximum distance between the two halves of the rod was 5 mm. The arm was held in a semi‐pronated position, supported by an armrest. The isometric force exerted by the subjects was represented in real‐time on the projection screen (a semitransparent screen in front of the scanner, viewed at a distance of 50 cm) by the height of a second bar representing grip pressure generated that was presented next to the target bar. The subject was asked to match the height of the pressure sensitive bar to that of the target bar. The target bar moved in a sinusoidal fashion with the amplitude or rate changing in either a repetitive (Sequence) or randomly varying (Random) fashion. Feedback on performance was provided by the color of the subject's bar changing from red to blue when the difference between the heights of the two bars fell below 10 mm (40 pixels).
The experiment was implemented as a “block” design with three conditions: Sequence, Random and Rest. During each of the 38‐s Sequence blocks, subjects performed two repeats of the smoothly varying sequence. In the Random blocks, subjects followed 38 s of pseudo‐random sequence. The pseudo‐random sequence was created by randomly permuting the amplitude and rate parameters of the sequence presented in the Sequence blocks. Although learning was expected to occur in both conditions, Sequence and Random were used to test the acquisition of a skill alone (Random) or in combination with learning of a specific sequence of movements (Sequence). During the Rest blocks, subjects made no movements and were shown a newly generated random sequence with random variation of the response bar to simulate subject performance. Rest blocks were designed to match the visual stimulation of the Sequence and Random blocks and to prevent rehearsal of the sequence. At the beginning of each block a word (“Sequence,” “Random,” or “Rest”) was presented for 1 s to indicate the condition that would follow. Ten blocks of each condition were performed in an imaging session, giving a total experimental duration of 26 min. Subjects had a practice session before the scanning procedure, outside the scanner, with two blocks of Random to ensure that they fully understood the task.
We recorded the tracking error (defined as the distance between the target bar and the pressure‐sensing bar) throughout the experiment at a frequency of 30 Hz (half the screen refresh rate). The 95th percentile (p95) of the absolute tracking error for Sequence and Random conditions was chosen as a summary measure of performance across each block in each subject, expected to reduce over time with learning. Learning was quantified by a reduction of the p95 from the first (block 1, p95 block1) to the last block (block 10) of the experiment (Δp95).
Data Acquisition
Functional MRI (fMRI).
Subjects lay supine on the scanner bed, and cushions were used to reduce head motion. Data acquisition was performed on 3 Tesla Varian Inova MRI system using multislice gradient‐echo EPI sequence [repetition time (TR): 3000 ms; echo time (TE): 30 ms; 43 axial slices (3.5‐mm‐thick) providing whole‐brain coverage; field of view (FOV): 256 × 192 mm; matrix 64 × 64].
Structural imaging (T1‐ and diffusion‐weighted scans).
In a separate imaging session, structural scans were acquired in 11 out of 12 subjects on a 1.5 Tesla Siemens Sonata MRI scanner, with maximum gradient strength of 40 mT m−1. A T1‐weighted 3D FLASH sequence (TR = 12 ms, TE = 5.65 ms, flip angle = 19°, with elliptical sampling of k space, giving a voxel size of 1 × 1 × 1 mm) was acquired. Diffusion‐weighted data were acquired using echo planar imaging [60 axial slices (2.5‐mm‐thick), matrix size 128 × 104, FOV 320 × 260 mm, giving a voxel size of 2.5 × 2.5 × 2.5 mm]. Diffusion weighting was isotropically distributed along 60 directions using a b value of 1,000 s mm−2. For each set of diffusion‐weighted data, five volumes with no diffusion weighting were acquired at points throughout the acquisition. Two sets of diffusion‐weighted data were acquired for subsequent averaging to improve signal‐to‐noise ratio. The total scan time for the diffusion‐weighted imaging (DWI) protocol was 45 min.
Image Analysis
Analysis was carried out using tools from the FMRIB Software Library (FSL) (http://www.fmrib.ox.ac.uk/fsl) and in‐house software.
fMRI analysis.
At the first level (within‐subject), preprocessing involved several stages. The first four EPI volumes were deleted to allow the signal to reach steady‐state magnetization. Motion in remaining volumes was corrected using MCFLIRT [Jenkinson and Smith, 2001]. Non‐brain structures were removed using BET [Smith, 2002]. The data were spatially smoothed using a Gaussian kernel of 5‐mm full‐width at half maximum. Each dataset was normalized by a single scaling factor (“grand mean scaling”), whereby each volume in the 4D dataset was normalized by the same value, to allow for cross‐subject statistics to be valid. High‐pass temporal filtering with a 150 s cut‐off was used to remove low‐frequency drifts. The time series was analyzed using a general linear model (GLM) approach. Registration to standard space was carried out using FLIRT [Jenkinson and Smith, 2001]. Statistical analysis was carried out in FEAT using FILM with local autocorrelation correction [Woolrich et al., 2001]. The hemodynamic response function was modeled as a gamma function, a normalization of the probability density function of the gamma distribution with zero phase, standard deviation of 3 s, and a mean lag of 6 s.
There were four principal explanatory variables (EVs) in the first level (within‐subject) model. The first two EVs specified the onset and duration of Sequence or Random task periods to identify the mean effect associated with each task. The remaining two EVs specified a linear trend in signal change associated with the Sequence and Random task, respectively. That is, they account for a linear increase, or decrease, in task‐related signal change over the course of the whole scanning session [Floyer‐Lea and Matthews, 2004]. These linear trend regressors were demeaned to ensure their orthogonality with respect to the mean effect of Sequence or Random tasks. The explanatory variables (EVs) were modeled along with their temporal derivatives. FEAT was used to fit the model to the data, to generate parameter estimates for each of the four main EVs against Rest, and to contrast these parameter estimates against one another (i.e., Sequence > Random, Random > Sequence).
To generate second or group level statistical activation maps for each of the within‐session EVs, random effects analyses were applied to the whole‐brain group data using FLAME [Beckmann et al., 2003]. Group Z (Gaussianized T) statistic images were thresholded using clusters determined by Z > 2.3 and a corrected cluster extent significance threshold of P = 0.05. A mean group effect associated with each task was identified. A second regressor including individual subject measures of baseline performance during the first block (p95 block1) or individual learning scores (Δp95) in Sequence (or Random) was also used to model the signal at the group level to test for areas where task‐related blood‐oxygen‐level‐dependent (BOLD) signal changes correlated with individual behavior. Functional networks related to individual differences in p95 block1 represented correlates of baseline performance. Correlations between individual learning scores (Δp95) and BOLD signal changes assessed the individual learning.
DWI preprocessing and tract‐based spatial statistics (TBSS).
All diffusion‐weighted scans were corrected for head motion and eddy currents using successive affine registrations before averaging. Local correlations between individual learning scores and FA values were tested using TBSS, a voxel‐wise method for statistical comparisons of diffusion indices across subjects that increases the sensitivity and the interpretability of the results compared with more traditional voxel‐based approaches only requiring non‐linear registration [Smith et al., 2006]. First, FA images were created using DTIFit within the FMRIB Diffusion Toolbox [part of FSL; Smith et al., 2004]. Individual FA maps were then nonlinearly aligned to a common FA template (http://www.fmrib.ox.ac.uk/fsl/data/FMRIB58_FA.html) using FNIRT non‐linear registration (http://www.fmrib.ox.ac.uk/fsl/fnirt). The across‐subject mean FA image was calculated and used to generate a WM tract “skeleton,” which was thresholded at FA > 0.2 to restrict analysis to WM. Individual subject maximum FA values nearest to the mean FA skeleton were perpendicularly projected onto this skeleton for statistical comparisons. As the association between individual learning differences and structural variation may reflect variation in baseline performance, we tested for local correlations between FA and p95 block1 of the Sequence and Random conditions to assess performance‐related individual variation in brain structure; then, we tested for local correlations between FA and Δp95 learning scores of the Sequence and Random conditions. To test for local correlations between learning scores (Δp95) or baseline performance (p95 block1) and diffusion measures (FA values), we carried out permutation‐based nonparametric testing [Nichols and Holmes, 2002]. Results were considered significant for P < 0.05 (after initial cluster‐forming thresholding at t > 2), fully corrected for multiple comparisons across space. The location of significant clusters was determined using the JHU White Matter Tractography Atlas (http://fsl.fmrib.ox.ac.uk/fsl/fslview/atlas-descriptions.html).
Voxel‐based morphometry analysis.
T1‐weighted structural images were analyzed with FSL‐VBM, a voxel‐based morphometry style analysis [Ashburner and Friston 2000; Good et al. 2001] carried out with FSL tools (http://www.fmrib.ox.ac.uk/fsl/fslvbm). Structural images were brain‐extracted using BET [Smith, 2002] and tissue‐type segmentation was carried out using FAST [Zhang et al., 2001]. The resulting grey‐matter partial volume images were then aligned to the MNI152 GM template using FNIRT nonlinear registration (http://www.fmrib.ox.ac.uk/fsl/fnirt). The resulting images were averaged to create a study‐specific template, to which the native GM images were then nonlinearly reregistered. Then, the registered partial volume images were modulated (to correct for local expansion or contraction induced by the nonlinear registration) by dividing by the Jacobian of the warp field. The modulated, segmented images were then smoothed with an isotropic Gaussian kernel with a sigma of 3 mm. Finally, to test for local correlations between individual learning scores (Δp95) or baseline performance (p95 block1) and GM density values, voxel‐wise GLM was applied using permutation‐based nonparametric testing, forming clusters at t > 2 and testing clusters for significance at P < 0.05, corrected for multiple comparisons. The location of significant clusters was identified using the MRI Atlas of the Human Cerebellum [Schmahmann et al., 2000] and the Juelich Atlas (http://fsl.fmrib.ox.ac.uk/fsl/fslview/atlas-descriptions.html).
Multivariate Analysis Combining Structural, Functional, and Behavioral Measures
The relationship between learning, functional and structural MRI measures was visualised using multidimensional scaling [MDS; Young and Hamer, 1987], which summarises the degree of similarity between multidimensional data points in a lower dimensional space. In our results, the data points represented our measures (behavioral measure of learning, functional, and structural imaging measures) in d‐dimensional space (d was the number of subjects). The MDS then represented these data points in a two‐dimensional space such that distances between points in this two‐dimensional representation reflect their correlation in the d‐dimensional space. Therefore, two points that were close to each other on the MDS map were more correlated (i.e., more similar to each other) than points that were far away (i.e., less similar to each other). This approach has been previously used, for example, to represent similarities between anatomical connectivity profiles of cortical regions [Passingham et al., 2002].
For the MDS visualisation, regions showing significant covariation across the group between learning scores (Δp95) and either FA, GM density, or Sequence‐related BOLD signal change were used as regions of interest to extract individual structural (FA, GM density) or functional (mean BOLD signal change associated with the Sequence vs. Rest contrast) measures. These individual subject scores were entered into MDS. Spearman correlation coefficients between behavioral and imaging measures were computed, and MDS was applied to these correlation coefficients, resulting in a Kruskal's STRESS value of 0.17 (values approaching zero denoted a better fit).
We also modeled behavioral data (Δp95) using the MRI measurements. We used a simple linear regression, where the explanatory variables were one or a combination of the MRI measures. We adopted both Akaike information criterion (AIC) and the Bayes information criterion (BIC) as an approximation to the model evidence. Lower values for AIC/BIC indicate a model that best explains behavioral data, whilst still remaining parsimonious [Kass and Raftery, 1995].
Behavioral Analysis
Raw behavioral data were visually inspected for each individual subject to confirm compliance with the task. Two subjects failed to perform one of the two repetitions of a block (one of them being in the Sequence task and the other one in the Random). These data were discarded and the p95 of these subjects was calculated using one repetition of that block instead of two.
Statistical analysis of behavioral performance data was performed using SPSS Statistics 17. Repeated measures ANOVA of p95 of the tracking error was used to test for the influence of within‐subject factors of tasks (Sequence vs. Random) and blocks (1–10). Paired t tests (P ≤ 0.05, two‐tailed) were used to test for differences in p95 between the first block and the tenth block within both the Sequence and Random conditions. Regression analysis was used to test for a significant linear decrease over time both in the Sequence and Random tasks.
Although we reported all cases where we fail to reject the null hypothesis, in our hypothesis testing throughout the article, we were only interested in rejecting the null hypothesis (no effect) and controlling for Type I error.
RESULTS
Behavioral Performance
Learning was assessed in the Sequence as well as in the Random task from the changes in p95 over the 10 blocks of tracking (Fig. 1A). Overall, there was a trend towards a main effect of block (F = 2.79; df = 2.98; P = 0.056) and a trend towards an interaction of block by task (F = 2.79; df = 3.02; P = 0.055). Over ten blocks there was a significant linear decrease in the p95 for the Sequence (P < 0.005). This was not seen with the Random condition (P > 0.1). Similarly, a significant reduction in p95 from block 1 to 10 (Δp95) was found for the Sequence blocks (paired t test: t(11) = 4.3, P < 0.001), but not for the Random blocks (paired t test: t(11) = −0.56, P > 0.1) (Fig. 1B).
Figure 1.

(A) Mean and standard error of the 95th percentile (p95) of the tracking error in the Sequence (red) and Random (light blue) conditions at each block across all subjects (n = 12). (B) The p95 of the tracking error in the Sequence (left) and Random (right) conditions calculated at block 1 and at Block 10 (Δp95) in all subjects (n = 12). There was a significant reduction in Δp95 for the Sequence (paired t test: t(11) = 4.3, P < 0.001) but not for the Random (paired t test: t(11) = −0.56, P > 0.1) condition. [Color figure can be viewed in the online issue, which is available at wileyonlinelibrary.com.]
Task‐Related Brain Activations
The Sequence task (vs. Rest) was associated with activation in a widespread, bilateral network of predominantly frontal‐parietal, basal ganglia, and cerebellar regions (Fig. 2A). A similar, but less widespread network showed significant activation during the Random task (vs. Rest) (Fig. 2B). The Sequence task induced significantly higher BOLD signal change (activation) than the Random task in most of the commonly activated brain regions (Fig. 2C). The Random task was associated with greater signal than the Sequence task in the temporal pole bilaterally (data not shown).
Figure 2.

Task‐related functional networks (n = 12). Group mean brain activation for Sequence vs. Rest (A), Random vs. Rest (B) and Sequence vs. Random (C) contrasts, as well as linear reduction in Sequence (vs. Rest) related activation contrast (D), Z > 2.3, P < 0.05 corrected. R: right; L: left. [Color figure can be viewed in the online issue, which is available at wileyonlinelibrary.com.]
To define brain regions in which activity changes over time as a result of learning, we tested for linear changes in task‐related activation. Consistent with the behavioral results, task‐related activations decreased over time only in the Sequence task, where we found a linear decrease in activation in the prefrontal cortex, primary and secondary sensorimotor cortices, supplementary motor area (SMA), insular cortex, anterior cingulate, and paracingulate cortex, as well as in the parietal and temporo‐occipital cortices and cerebellar hemispheres (Fig. 2D). No brain regions in which there was increasing activity over time were found for either task.
Imaging Correlates of Individual Variation in Skill Learning
Functional correlates.
Better initial performance (p95 block1) during the Sequence condition correlated with higher activation in the right prefrontal, lateral premotor (PM) and cingulate cortices, as well as in the SMA, basal ganglia, thalamus, and cerebellum bilaterally (Supporting Information Table S1 and Fig. S2A). In the Random condition, better initial performance (p95 block1) correlated with higher activation in the left primary sensorimotor cortices and basal ganglia, as well as bilaterally in the posterior parietal and temporal‐occipital cortices, the hippocampus and cerebellum (Supporting Information Table S1 and Fig. S2B). There was no significant positive correlation between p95 block1 in Sequence or Random and BOLD signal change. The most significant correlation was found at P values of 0.1 (corrected for multiple comparisons) in both conditions.
There was a bilateral positive correlation between Sequence‐related activation and individual learning scores (Δp95) including cortical‐subcortical regions such as the primary and secondary sensorimotor cortices, cingulate and paracingulate cortices, left amygdala and parahippocampal gyrus, basal ganglia and thalamus, the cerebellar cortex bilaterally and right dentate nucleus. In these regions, increased task‐related activation was associated with steeper learning‐related reduction in tracking error (Table I, Fig. 3A). Significant positive correlations between brain activation and Δp95 in the Random condition were found in subcortical areas involved in motor control such as basal ganglia and thalamus in the left hemisphere, and motor regions of the cerebellar cortex bilaterally (Table I, Fig. 3B). There was no significant negative correlation between Δp95 and BOLD signal change either in Sequence or in Random (corrected P = 1.0).
Table I.
Functional correlates of individual learning scores (Δp95)
| Region of interest | Sequence | Random | ||||||
|---|---|---|---|---|---|---|---|---|
| Z | MNI coordinates | Z | MNI coordinates | |||||
| x | y | z | x | y | z | |||
| R superior frontal gyrus | 4.4 | 26 | 20 | 60 | ||||
| L medial frontal gyrus, pre‐SMA | 4.4 | −14 | 4 | 50 | ||||
| L precentral gyrus, PMd | 2.9 | −24 | 4 | 52 | ||||
| L precentral gyrus, M1 | 3.4 | −38 | −14 | 46 | ||||
| L postcentral gyrus | 3.4 | −58 | −16 | 42 | ||||
| L cingulate gyrus | 3.6 | −14 | 16 | 32 | ||||
| R paracingulate gyrus | 3.8 | 4 | 14 | 44 | ||||
| L parietal opercular cortex | 4.1 | −62 | −34 | 22 | ||||
| L amygdala | 3.8 | −18 | −10 | −16 | ||||
| L parahippocampal gyrus | 3.1 | −18 | −32 | −12 | 2.8 | −18 | −40 | −12 |
| L Putamen | 2.6 | −30 | −16 | −4 | 2.5 | −26 | −10 | 12 |
| L globus pallidus | 2.8 | −26 | −18 | −4 | 3.0 | −22 | −14 | 2 |
| L thalamus, ventral posterior medial nucleus | 3.3 | −16 | −22 | −2 | ||||
| L thalamus, lateral posterior nucleus | 3.3 | −16 | −30 | 8 | ||||
| L thalamus, ventral lateral nucleus | 2.8 | −10 | −10 | 0 | 3.0 | −18 | −16 | 16 |
| L lateral geniculate body | 3.3 | −20 | −22 | −8 | ||||
| L subthalamic nucleus | 3.1 | −10 | −12 | −4 | 2.5 | −10 | −18 | −6 |
| R subthalamic nucleus | 2.4 | 12 | −16 | −8 | ||||
| L substantia Nigra | 3.7 | −10 | −18 | −16 | 2.5 | −12 | −18 | −10 |
| R red nucleus | 2.6 | 8 | −18 | −8 | 2.4 | −6 | −20 | −8 |
| R cerebellum, lobule V | 2.9 | 8 | −50 | −18 | 4.4 | 30 | −36 | −32 |
| R cerebellum, lobule VI | 3.2 | 26 | −56 | −30 | ||||
| R cerebellum, lobule VIII | 2.8 | 18 | −62 | −60 | ||||
| R cerebellum, lobule IX | 3.7 | 2 | −64 | −42 | ||||
| R cerebellum, crus I‐II | 3.6 | 34 | −54 | −40 | 3.9 | 16 | −74 | −28 |
| R cerebellum, dentate nucleus | 3.6 | 22 | −42 | −38 | ||||
| L cerebellum, lobule VIII | 4.2 | −18 | −66 | −60 | ||||
| L cerebellum, lobule VI | 3.5 | −20 | −62 | −18 | ||||
| L cerebellum, lobule V | 3.7 | −12 | −52 | −18 | 3.3 | −18 | −56 | −22 |
| L pontine nuclei | 3.2 | −10 | −24 | −32 | ||||
Mean location in MNI x, y, z coordinates, and Z score of peak voxel for each cluster showing a significant positive correlation between individual learning scores (Δp95) and brain activation during the Sequence or Random condition (vs. Rest) (random effects, Z > 2.3, P < 0.05 corrected). Abbreviations: SMA: supplementary motor area; PMd: lateral premotor cortex dorsal; R: right; L: left.
Figure 3.
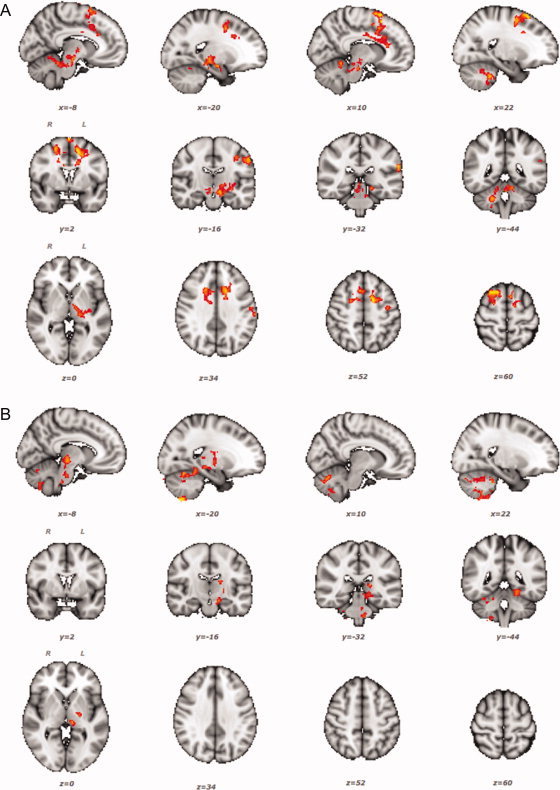
Regions where BOLD signal change correlates positively with individual learning scores (Δp95), Z > 2.3, P < 0.05 corrected. Higher BOLD signal changes in the Sequence vs. Rest (A) and Random vs. Rest (B) contrasts are associated with steeper learning curves (i.e., higher Δp95 values). R: right; L: left. [Color figure can be viewed in the online issue, which is available at wileyonlinelibrary.com.]
White matter correlates.
There was no correlation between initial performance (p95 block1) for Sequence or Random and FA values. Specifically, there was no detectable positive or negative correlation between Sequence or Random p95 block1 and FA (corrected P = 1.0).
We found a significant positive correlation between FA and Sequence learning scores (Δp95) in the WM of the cerebellum bilaterally and in WM underlying the right precentral gyrus (t > 2, P < 0.05 corrected) (Fig. 4A). The cerebellar voxels were localized to WM adjacent to the right (1,216 voxels, centre of gravity in mm coordinates: x = 14, y = −58, z = −32) and left (808 voxels, centre of gravity in mm coordinates: x = −19, y = −58, z = −36) dentate nuclei. Cerebral voxels showing significant correlations between FA and Sequence learning scores (Δp95) were found in a region corresponding to the right superior longitudinal fasciculus underlying the central gyrus (795 voxels, centre of gravity in mm coordinates: x = 36, y = −10, z = 35). There was no negative correlation between Δp95 in Sequence or Random and FA values. Specifically, the most significant correlation between Δp95 in Sequence and FA was found at corrected P of 1.0. No significant correlations were found between Δp95 in Random condition and FA maps. The most significant positive or negative correlation between Δp95 in Random and FA values reached a corrected P value of 0.6.
Figure 4.

(A) Regions of the cerebellum and precentral gyrus showing covariation between FA and motor learning scores (Δp95) in the Sequence task, t > 2, P < 0.05 corrected. Light blue shows the WM skeleton in which statistical analysis was carried out; dark blue indicates regions where higher FA correlates with steeper learning curves (i.e., higher Δp95 values). (B) Regions of the cerebellum and the temporo‐occipital cortex showing covariation between GM density and learning scores (Δp95) in the Sequence task, t > 2, P < 0.05 corrected. In these regions, higher GM density co‐varies with steeper learning curves. R: right; L: left. [Color figure can be viewed in the online issue, which is available at wileyonlinelibrary.com.]
Grey matter correlates.
There was no significant correlation between baseline Sequence or Random performance (p95 block1) and GM density. Specifically, the most significant positive correlation between p95 block1 in Sequence or in Random and GM density was found at a corrected P value of 0.2. There was no negative correlation between Sequence or Random p95 block1 and GM density (P = 1.0 corrected).
We found a positive correlation between GM density and Sequence learning scores (Δp95) in the cerebellar GM bilaterally and in the right occipital cortex (t > 2, P < 0.05 corrected) (Fig. 4B), i.e., steeper changes in Sequence condition were associated with higher GM density. Significant cerebellar clusters (2,067 voxels in the right hemisphere; 1,727 in the left) were localized to lobules VII, VIII, IX, Crus I, and II, and lobule VI bilaterally (Table II). The occipital cluster showing a significant positive correlation between GM density and Sequence learning scores was located in the inferior division of the right lateral occipital cortex (211 voxels; max t value 6.2; mm coordinates: x = 36, y = −88, z = −8) occupying a region corresponding to V2/V3 and extending towards MT/V5. There was no significant negative correlation between Δp95 in Sequence and GM density. The most significant correlation between Δp95 in Sequence and GM map reached a corrected P value of 0.1.
Table II.
Grey matter correlates of individual learning scores (Δp95)
| Region of interest | t | MNI coordinates | ||
|---|---|---|---|---|
| x | y | z | ||
| R cerebellum, Crus I | 3.5 | 28 | −82 | −22 |
| R cerebellum, Crus II | 5.2 | 34 | −84 | −40 |
| L cerebellum, Lobule VI | 3.9 | −26 | −58 | −34 |
| L cerebellum, Crus I | 5.2 | −18 | −72 | −32 |
| L cerebellum, Crus II | 6.1 | −26 | −80 | −38 |
| R lateral occipital cortex | 6.2 | 36 | −88 | −8 |
Mean location in MNI x, y, z coordinates, and max t value for each cluster showing a significant correlation between learning outcome and GM density during the Sequence condition (vs. Rest), (t > 2, P < 0.05 corrected). R: right; L: left.
No significant correlation was found between Δp95 in Random and GM density. The most significant positive correlation between Δp95 in Random and GM map was found at a corrected P value of 0.25, whereas the most significant negative correlation was found at corrected P value of 0.6.
Multivariate Analysis of Structural, Functional, and Behavioral Measures
We visualized the significant brain–behavior relationships in the Sequence condition using MDS, a two‐dimensional representation of distances between elements that reflects the similarity between measures (Fig. 5). MDS suggested that skill learning (Δp95) covaried most closely with structural measures of WM (colored blue). The relatedness of behavior and structural measures of GM (colored green) was high, whereas relationships between behavior and functional responses (colored red) were more variable. For some regions (e.g., the cerebellum), close relationships were found, whereas for others (e.g., the prefrontal and cingulate cortices), distances from the behavioral scores were relatively higher.
Figure 5.

Multivariate analysis of behavioral and imaging measures using multidimensional scaling (MDS). Distances between elements of the two dimensional representation of behavioral vs. functional vs. structural measures reflect the overall similarity between their properties. Abbreviations: BStemF: brainstem functional; LAmgF: left amygdala functional; LCbF: left cerebellar functional; LCbGM: left cerebellar grey matter; LCbWM: left cerebellar white matter; LCingF: left cingulate functional; LHippoF: left hippocampus functional; LPallF: left palludum functional; LParacingF: left paracingulate functional; LParOpercF: left parietal opercular functional; LPostCF: left postcentral gyrus functional; LPreCF: left precentral functional; LpSMAF: left preSMA functional; LPutF: left putamen functional; LSFGF: left superior frontal gyrus functional; LThalF: left thalamus functional; RCbF: right cerebellar functional; RCbGM: right cerebellar grey matter; RCbWM: right cerebellar white matter; RCingF: right cingulate functional; RDentF: right dentate functional; RParacingF: right paracingulate functional; RPreCWM: right precentral gyrus white matter; RpSMAF: right preSMA functional; RSFGF: right superior frontal gyrus functional; RVisGM: right visual cortex grey matter. [Color figure can be viewed in the online issue, which is available at wileyonlinelibrary.com.]
As MDS showed that the functional responses and structural properties of the cerebellum consistently correlated with variation in behavioral measures of learning, we assessed the contribution of each imaging modality, as well as combination of modalities within the cerebellum to explain behavioral performance. Results from the simple linear regression suggested that WM alone (AIC, −18.6; BIC, −17.8) or GM alone (AIC, −17.9; BIC, −17.1) provided the optimal explanations for individual variation in skill learning outcomes. Combining structural measures (WM and GM) did not improve the model evidence (AIC, −13.5; BIC, −11.9). Functional responses explained the learning scores (AIC, −16.1; BIC, −14.9) to a comparable extent. Combining structural and functional measures (WM, GM, and BOLD signal) did not improve the model fitting further (AIC, 160.3; BIC, 171.1).
DISCUSSION
This study demonstrates that individual differences in short‐term motor skill learning reflect variation in functional and structural properties of specific brain regions within individuals. Specifically, we showed that between‐subject differences in short‐term skill learning were associated with individual variation in the BOLD signal change, WM integrity and GM density of cerebellar and cortical regions mediating motor control. Variations in the amplitude of functional responses across a network including premotor, prefrontal, parietal, and medio‐temporal limbic areas, as well as basal ganglia and cerebellum, were associated with individual variation in skill learning. Structural measures of WM integrity and GM density in premotor and visual cortex and in the cerebellum also covaried with individual learning. Importantly, regions in which structural measures correlated with individual learning outcomes colocalized with some of the areas showing correlates between fMRI activation and learning.
Imaging the Neural Correlates of Individual Variation in Learning
Cortical and subcortical brain regions in which fMRI activation correlated with individual learning scores have been reported previously to mediate motor learning, a form of nondeclarative memory [Doyon et al., 2002; Floyer‐Lea and Matthews, 2004, 2005; Hikosaka et al., 2002]. Our observations that BOLD signal change within dorsal PM (PMd) and the structure of WM underlying PMd correlate both with learning scores are consistent with the functional and anatomical evidence for a role for PMd both in motor learning and in visuospatial memory [Deiber et al., 1997; Jenkins et al., 1994]. Rostral PMd is a target of specific, parietal afferents [Tomassini et al., 2007] and is indirectly connected with the extrastriate visual areas [Baizer et al., 1991]. Consistent with this, the VBM analysis revealed covariation between individual measures of learning and GM density in ipsilateral V2/V3 and MT/V5 and extrastriate areas involved in the perception of visual motion.
We also found colocalized functional and structural correlates of skill learning within the cerebellum. The role for the cerebellum in motor learning has been defined by several imaging studies [Deiber et al., 1997; Doyon et al., 2002; Flament et al., 1999; Lehericy et al., 2005]. We interpret the decrease in cerebellar activation over the course of learning as reflecting decreased cerebellar feedback when movement errors are minimized with practice. A role in somatosensory modulation of self‐generated movements has been defined [Blakemore et al., 1999; Doyon et al., 2002; Hikosaka et al., 2002]. Consistent with this, we observed a correlation between BOLD signal and learning behavior in left parietal opercular cortex, part of a network for predicting sensory consequences of motor commands along with brainstem nuclei and the cerebellum [Blakemore et al., 1999]. There is also evidence for subcortical activation in the right dentate nucleus with learning [Doyon et al., 2002; van Mier et al., 1998], a region that correlates with individual behavioral variation in this study. Consistent with this, we find correlations between motor learning and FA within cerebellar WM, although, given the spatial resolution of the imaging data, it is difficult to determine precisely whether these WM locations are related to the GM regions showing structural and functional covariations.
BOLD signal intensity in other cortical and subcortical regions including the substantia nigra, parahippocampal gyrus, and amygdala also showed a correlation with learning behavior. These regions have been implicated in relevant aspects of motor control and learning such as inhibition of competing motor programs [Mink, 1996], recall of topographic information [Aguirre et al., 1996], and reward‐based learning [Tremblay and Schultz, 1999].
Overall, our results provide insights into the brain basis of the potential for a specific form of learning by identifying regions within motor control networks whose structural characteristics and functional specializations are associated with individual, as well as group short‐term learning.
We would anticipate that other tasks probing different aspects of motor behavior would provide comparable results, but could identify distinct functional‐anatomical regions as showing the strongest relationships with task performance. Indeed, previous studies have provided anatomically specific evidence that individual brain structural and functional properties, explored separately, contribute to explain individual differences in other learning tasks [Della‐Maggiore et al., 2009; Tamas Kincses et al., 2008].
Both genetic and individual developmental processes may be important factors contributing to individual variation in brain structure and function [Chiang et al., 2009; Filippini et al., 2009; Hariri et al., 2003; Pezawas et al., 2004]. Our observations from the multidimensional scaling analysis highlight a potential relationship between experience‐dependent remodeling of brain structure and brain function in determining behavior [Krakauer et al., 2006]. They also point to a specific region (cerebellum) within the task‐related motor learning network, the structural and functional properties of which were correlated strongly with skill learning. The colocalization of brain–behavioral correlations in the cerebellum may reflect the key role of the cerebellum for adapting to visual and proprioceptive sensory feedback [Grafton et al., 2008]. The significant correlation between imaging measures and the Sequence, but not the Random task, suggests that aspects of learning requiring both feedforward [Miall and King, 2008; Tseng et al., 2007] and feedback [Grafton et al., 2008; Thoroughman and Shadmehr, 1999] components, such as those contained in the Sequence condition, rely on specific cerebellar functional and structural properties and support the biological plausibility of our results.
Methodological Considerations
Although we find consistent and colocalized correlations between learning scores and measures of brain structure and function, such a simple relationship should not be expected across all brain regions contributing to the task. In the present study, and in previous studies of brain‐behavioural correlations [Della‐Maggiore et al., 2009; Tamas Kincses et al., 2008], reported instances of structural and functional variations correlated with behavior only in a small proportion of the brain network involved in task performance. Those parts of networks that are not identified may either not be limiting the performance or may be too imprecisely segmented or registered for strong correlations to be apparent. In addition, the different imaging modalities used will vary in their sensitivity. Brain microstructural architecture, grey matter volume and function may also reflect different aspects of a dynamic behavior such as motor learning (e.g., traces of previous motor experiences vs. current attentional demands for task performance) and this may contribute to explain limited colocalization across imaging modalities. In some regions, optimized task performance may be associated with smaller functional responses, reflecting greater efficiency of information processing [Floyer‐Lea and Matthews, 2005; Lehericy et al., 2005]. Available evidence suggests that positive relationships between structure and performance for both GM [Boyke et al., 2008; Draganski et al., 2004; Maguire et al., 2000] and WM measures are found frequently [Johansen‐Berg et al., 2007]. However, in some cases negative relationships have been reported, such as the association between slower reaction times and increased FA in occipital WM [Tuch et al., 2005].
The challenge of predicting the direction of behavior–brain correlations stems from ambiguities over the biological interpretation of MRI‐based measures. For example, while there is a positive correlation between BOLD signal amplitude and local synaptic activity [Logothetis et al., 2001], both excitatory and inhibitory activity contribute to the signal [Logothetis, 2008]. In the GM, the density measure considered by a VBM analysis will be positively influenced by features such as greater neuronal density reflected in greater cortical thickness, but related changes in other factors could have opposing effects, e.g., greater myelination at the WM/GM interface that would alter MRI segmentation of GM by shifting the apparent GM/WM boundary. The sensorimotor regions may be more affected by local variation at the GM/WM interface and may suffer more from regional contrast‐to‐noise variation [Tardif et al., 2009]. This may have affected our ability to detect correlations between GM density variation and learning scores in premotor regions, despite our ability to show an association with WM tracts sub‐serving these regions. Similarly, FA, the measure of WM integrity used, will not only increase as myelination or packing density of the principle fiber population increase [Beaulieu, 2002], but it will also be influenced by other factors, such as properties of minor fiber populations in regions of fiber crossing, or features such as tract geometry. Structural properties of the WM tracts approaching the premotor regions in our right‐handed healthy volunteers may have affected the strength of the correlations between FA values and individual learning scores. Finally, differences in the measurement noise associated with the different imaging modalities may have contributed to the differences in the brain–behavioral correlations. Therefore, we should not expect a simple one‐to‐one relationship between imaging measures and underlying physiological or anatomical features. Caution is required when assigning neurobiological interpretations to results.
Implications of This Study
Nonetheless, our observations have important practical implications in considering the neurobiology of neurorehabilitation. Skill learning can be thought of as a model for re‐learning of lost motor abilities following brain damage [Krakauer, 2006]. The particular motor task studied here, in which subjects learn a sequence of movements, may be useful for understanding processes involved in rehabilitation: rehabilitation interventions often involve retraining of sequences of movements to allow for goal directed tasks to be carried out. Our results therefore generate hypotheses to be tested in patient populations. In this view, regions showing associated functional and structural covariation (e.g., the cerebellum and PM) with individual measures of motor learning may define areas of special importance for motor recovery in the damaged brain. The ipsilateral PM has previously been shown to have a role in the adaptive recovery of function after brain damage [Bosnell et al., in preparation; Johansen‐Berg et al., 2002; Wegner et al., 2008; Supporting Information Fig. S3A], a potential mediated through its direct connections with the spinal cord [Dum and Strick, 2002], modulatory effects on motor output from primary motor regions [Chouinard et al., 2003], or both. In addition, there is a correspondence between regions of the cerebellum found in the current study (Crus I and Lobule VI) and those implicated in recovery by previous studies of patients following stroke [Baron et al., 1984; Johansen‐Berg et al., 2002; Supporting Information Fig. S3B]. Connections between the cerebellum and frontal cortex provide an anatomical substrate for cerebellar modulatory influences on motor output [Dum et al., 2002] relevant to plasticity in motor learning as well as in recovery [Manto et al., 2006; Miall et al., 2007; Sanes et al., 1990]. Defining regions that may contribute to motor recovery based on their roles in motor learning, as we propose here, will help identify candidate anatomical targets for therapeutic intervention [e.g., using transcranial magnetic stimulation; Khedr et al., 2005], transcranial direct current stimulation [Hummel et al., 2005], or deep brain stimulation [Fuentes et al., 2009] aimed at modulating motor‐related plasticity after brain injury.
CONCLUSIONS
This study demonstrates associations between individual variations in brain structure and function and motor learning. It demonstrates the potential for multimodal imaging to define brain regions showing behaviorally‐relevant plasticity in healthy, as well as in diseased brains. It further validates current measures of brain structure as markers for assessment of brain plasticity in longitudinal studies. Finally, this work suggests potential targets for therapeutic interventions designed to maximize adaptive functional reorganization after brain damage.
Supporting information
Additional Supporting Information may be found in the online version of this article.
Figure S1. Motor learning has been tested using a visuomotor tracking task. (A) The subject's arm is held in a semipronated position, supported by an armrest (top right). Subjects are asked to track a computer‐controlled bar (blue) displayed on a screen (top left) by altering the amount of grip pressure applied isometrically to a hand‐held sensor (top right) controlling the subject's bar (green) (top left). (B) The target bar is programmed to move in a sinusoidal fashion (blue line), the rate and amplitude of which can be altered to create either a repetitive sequence (Sequence) or a randomly varying (Random) cue. The distance between the computer‐ and the subject‐controlled bars (green line) represents the absolute tracking error (red line). Reduction in the p95 of the absolute tracking error over time is used as a measure of learning.
Figure S2. Regions where BOLD signal change correlates negatively with baseline performance during the first block (p95 block1) of Sequence or Random cues (Z>2.3, p<0.05 corrected). Higher BOLD signal change in the Sequence vs. Rest (A) and Random vs. Rest (B) contrasts are associated with better performance during the first blocks of Sequence and Random conditions, respectively. R: right; L: left.
Figure S2. Regions where BOLD signal change correlates negatively with baseline performance during the first block (p95 block1) of Sequence or Random cues (Z>2.3, p<0.05 corrected). Higher BOLD signal change in the Sequence vs. Rest (A) and Random vs. Rest (B) contrasts are associated with better performance during the first blocks of Sequence and Random conditions, respectively. R: right; L: left.
Figure S3. Comparison between learning‐ and recovery‐dependent plastic changes. (A) Variation in functional activation of the ipsilateral (i.e., right) premotor cortex (PM) helps explain individual variation in learning scores, with “better learners” (as defined by steeper learning curves) showing higher signal changes in this region (results from this study). PM is also involved in spontaneous motor recovery after brain damage. Examples from multiple sclerosis (Wegner et al., 2008) and stroke (Bosnell et al., in preparation) confirm the functional relevance of PM in spontaneous motor recovery and potentially in individual variation in recovery outcomes. (B) Variation in functional activation of the cerebellum are associated with individual variation in learning (results from this study), as well as in individual differences in rehabilitation‐driven recovery (Johansen‐Berg et al., 2002), suggesting the cerebellum as a source of plasticity both in the healthy and diseased brains. R: right; L: left.
Table S1. Functional correlates of individual baseline performance (p95 block1 of Sequence and p95 block1 of Random). Mean location in MNI x, y, z coordinates, and Z score of peak voxel for each cluster showing a significant negative correlation between initial performance (p95 block1) and activation during the Sequence or Random condition (vs. Rest) (random effects, Z>2.3, p<0.05 corrected). Abbreviations: SMA: supplementary motor area; PMd: lateral premotor cortex dorsal; R: right; L: left.
REFERENCES
- Aguirre GK, Detre JA, Alsop DC, D'Esposito M ( 1996): The parahippocampus subserves topographical learning in man. Cereb Cortex 6: 823–829. [DOI] [PubMed] [Google Scholar]
- Ashburner J, Friston KJ ( 2000): Voxel‐based morphometry—The methods. Neuroimage 11 ( 6, Part 1): 805–821. [DOI] [PubMed] [Google Scholar]
- Baizer JS, Ungerleider LG, Desimone R ( 1991): Organization of visual inputs to the inferior temporal and posterior parietal cortex in macaques. J Neurosci 11: 168–190. [DOI] [PMC free article] [PubMed] [Google Scholar]
- Baron JC, Rougemont D, Soussaline F, Bustany P, Crouzel C, Bousser MG, Comar D ( 1984): Local interrelationships of cerebral oxygen consumption and glucose utilization in normal subjects and in ischemic stroke patients: A positron tomography study. J Cereb Blood Flow Metab 4: 140–149. [DOI] [PubMed] [Google Scholar]
- Beaulieu C ( 2002): The basis of anisotropic water diffusion in the nervous system—A technical review. NMR Biomed 15: 435–455. [DOI] [PubMed] [Google Scholar]
- Beckmann CF, Jenkinson M, Smith SM ( 2003): General multilevel linear modeling for group analysis in FMRI. Neuroimage 20: 1052–1063. [DOI] [PubMed] [Google Scholar]
- Blakemore SJ, Wolpert DM, Frith CD ( 1999): The cerebellum contributes to somatosensory cortical activity during self‐produced tactile stimulation. Neuroimage 10: 448–459. [DOI] [PubMed] [Google Scholar]
- Bosnell R, Kincses T, Kischka U, Matthews PM, Johansen‐Berg H: DTI measures of white matter integrity correlate with response to motor training post‐stroke (in preparation).
- Boyke J, Driemeyer J, Gaser C, Buchel C, May A ( 2008): Training‐induced brain structure changes in the elderly. J Neurosci 28: 7031–7035. [DOI] [PMC free article] [PubMed] [Google Scholar]
- Chiang MC, Barysheva M, Shattuck DW, Lee AD, Madsen SK, Avedissian C, Klunder AD, Toga AW, McMahon KL, de Zubicaray GI, Wright MJ, Srivastava A, Balov N, Thompson PM ( 2009): Genetics of brain fiber architecture and intellectual performance. J Neurosci 29: 2212–2224. [DOI] [PMC free article] [PubMed] [Google Scholar]
- Chouinard PA, Van Der Werf YD, Leonard G, Paus T ( 2003): Modulating neural networks with transcranial magnetic stimulation applied over the dorsal premotor and primary motor cortices. J Neurophysiol 90: 1071–1083. [DOI] [PubMed] [Google Scholar]
- Cramer SC ( 2008): Repairing the human brain after stroke: I. Mechanisms of spontaneous recovery. Ann Neurol 63: 272–287. [DOI] [PubMed] [Google Scholar]
- Deiber MP, Wise SP, Honda M, Catalan MJ, Grafman J, Hallett M ( 1997): Frontal and parietal networks for conditional motor learning: A positron emission tomography study. J Neurophysiol 78: 977–991. [DOI] [PubMed] [Google Scholar]
- Della‐Maggiore V, Scholz J, Johansen‐Berg H, Paus T ( 2009): The rate of visuomotor adaptation correlates with cerebellar white‐matter microstructure. Hum Brain Mapp 30: 4048–4053. [DOI] [PMC free article] [PubMed] [Google Scholar]
- Doyon J, Song AW, Karni A, Lalonde F, Adams MM, Ungerleider LG ( 2002): Experience‐dependent changes in cerebellar contributions to motor sequence learning. Proc Natl Acad Sci USA 99: 1017–1022. [DOI] [PMC free article] [PubMed] [Google Scholar]
- Draganski B, Gaser C, Busch V, Schuierer G, Bogdahn U, May A ( 2004): Neuroplasticity: Changes in grey matter induced by training. Nature 427: 311–312. [DOI] [PubMed] [Google Scholar]
- Dum RP, Strick PL ( 2002): Motor areas in the frontal lobe of the primate. Physiol Behav 77: 677–682. [DOI] [PubMed] [Google Scholar]
- Dum RP, Li C, Strick PL ( 2002): Motor and nonmotor domains in the monkey dentate. Ann N Y Acad Sci 978: 289–301. [DOI] [PubMed] [Google Scholar]
- Fields RD ( 2008): White matter in learning, cognition and psychiatric disorders. Trends Neurosci 31: 361–370. [DOI] [PMC free article] [PubMed] [Google Scholar]
- Filippini N, Rao A, Wetten S, Gibson RA, Borrie M, Guzman D, Kertesz A, Loy‐English I, Williams J, Nichols T, Whitcher B, Matthews PM ( 2009): Anatomically‐distinct genetic associations of APOE epsilon4 allele load with regional cortical atrophy in Alzheimer's disease. Neuroimage 44: 724–728. [DOI] [PubMed] [Google Scholar]
- Flament D, Shapiro MB, Kempf T, Corcos DM ( 1999): Time course and temporal order of changes in movement kinematics during learning of fast and accurate elbow flexions. Exp Brain Res 129: 441–450. [DOI] [PubMed] [Google Scholar]
- Floyer‐Lea A, Matthews PM ( 2004): Changing brain networks for visuomotor control with increased movement automaticity. J Neurophysiol 92: 2405–2412. [DOI] [PubMed] [Google Scholar]
- Floyer‐Lea A, Matthews PM ( 2005): Distinguishable brain activation networks for short‐ and long‐term motor skill learning. J Neurophysiol 94: 512–518. [DOI] [PubMed] [Google Scholar]
- Floyer‐Lea A, Wylezinska M, Kincses T, Matthews PM ( 2006): Rapid modulation of GABA concentration in human sensorimotor cortex during motor learning. J Neurophysiol 95: 1639–1644. [DOI] [PubMed] [Google Scholar]
- Frensch PA, Miner CS ( 1994): Effects of presentation rate and individual differences in short‐term memory capacity on an indirect measure of serial learning. Mem Cognit 22: 95–110. [DOI] [PubMed] [Google Scholar]
- Fuentes R, Petersson P, Siesser WB, Caron MG, Nicolelis MA ( 2009): Spinal cord stimulation restores locomotion in animal models of Parkinson's disease. Science 323: 1578–1582. [DOI] [PMC free article] [PubMed] [Google Scholar]
- Gillespie MJ, Stein RB ( 1983): The relationship between axon diameter, myelin thickness and conduction velocity during atrophy of mammalian peripheral nerves. Brain Res 259: 41–56. [DOI] [PubMed] [Google Scholar]
- Good CD, Johnsrude IS, Ashburner J, Henson RN, Friston KJ, Frackowiak RS ( 2001): A voxel‐based morphometric study of ageing in 465 normal adult human brains. Neuroimage 14 ( 1, Part 1): 21–36. [DOI] [PubMed] [Google Scholar]
- Grabner RH, Stern E, Neubauer AC ( 2007): Individual differences in chess expertise: A psychometric investigation. Acta Psychol (Amst) 124: 398–420. [DOI] [PubMed] [Google Scholar]
- Grafton ST, Schmitt P, Van Horn J, Diedrichsen J ( 2008): Neural substrates of visuomotor learning based on improved feedback control and prediction. Neuroimage 39: 1383–1395. [DOI] [PMC free article] [PubMed] [Google Scholar]
- Hariri AR, Goldberg TE, Mattay VS, Kolachana BS, Callicott JH, Egan MF, Weinberger DR ( 2003): Brain‐derived neurotrophic factor val66met polymorphism affects human memory‐related hippocampal activity and predicts memory performance. J Neurosci 23: 6690–6694. [DOI] [PMC free article] [PubMed] [Google Scholar]
- Hikosaka O, Nakamura K, Sakai K, Nakahara H ( 2002): Central mechanisms of motor skill learning. Curr Opin Neurobiol 12: 217–222. [DOI] [PubMed] [Google Scholar]
- Hummel F, Celnik P, Giraux P, Floel A, Wu WH, Gerloff C, Cohen LG ( 2005): Effects of non‐invasive cortical stimulation on skilled motor function in chronic stroke. Brain 128 ( Part 3): 490–499. [DOI] [PubMed] [Google Scholar]
- Jenkins IH, Brooks DJ, Nixon PD, Frackowiak RS, Passingham RE ( 1994): Motor sequence learning: A study with positron emission tomography. J Neurosci 14: 3775–3790. [DOI] [PMC free article] [PubMed] [Google Scholar]
- Jenkinson M, Smith S ( 2001): A global optimisation method for robust affine registration of brain images. Med Image Anal 5: 143–156. [DOI] [PubMed] [Google Scholar]
- Johansen‐Berg H, Dawes H, Guy C, Smith SM, Wade DT, Matthews PM ( 2002): Correlation between motor improvements and altered fMRI activity after rehabilitative therapy. Brain 125 ( Part 12): 2731–2742. [DOI] [PubMed] [Google Scholar]
- Johansen‐Berg H, Della‐Maggiore V, Behrens TE, Smith SM, Paus T ( 2007): Integrity of white matter in the corpus callosum correlates with bimanual co‐ordination skills. Neuroimage 36 ( Suppl 2): T16–T21. [DOI] [PMC free article] [PubMed] [Google Scholar]
- Karni A, Meyer G, Jezzard P, Adams MM, Turner R, Ungerleider LG ( 1995): Functional MRI evidence for adult motor cortex plasticity during motor skill learning. Nature 377: 155–158. [DOI] [PubMed] [Google Scholar]
- Kass RE, Raftery AE ( 1995): Bayes factors. J Am Stat Assoc 90: 773–795. [Google Scholar]
- Khedr EM, Ahmed MA, Fathy N, Rothwell JC ( 2005): Therapeutic trial of repetitive transcranial magnetic stimulation after acute ischemic stroke. Neurology 65: 466–468. [DOI] [PubMed] [Google Scholar]
- Klingberg T, Hedehus M, Temple E, Salz T, Gabrieli JD, Moseley ME, Poldrack RA ( 2000): Microstructure of temporo‐parietal white matter as a basis for reading ability: Evidence from diffusion tensor magnetic resonance imaging. Neuron 25: 493–500. [DOI] [PubMed] [Google Scholar]
- Krakauer JW ( 2006): Motor learning: Its relevance to stroke recovery and neurorehabilitation. Curr Opin Neurol 19: 84–90. [DOI] [PubMed] [Google Scholar]
- Krakauer JW, Mazzoni P, Ghazizadeh A, Ravindran R, Shadmehr R ( 2006): Generalization of motor learning depends on the history of prior action. PLoS Biol 4: e316. [DOI] [PMC free article] [PubMed] [Google Scholar]
- Krubitzer L ( 2007): The magnificent compromise: Cortical field evolution in mammals. Neuron 56: 201–208. [DOI] [PubMed] [Google Scholar]
- Lehericy S, Benali H, Van de Moortele PF, Pelegrini‐Issac M, Waechter T, Ugurbil K, Doyon J ( 2005): Distinct basal ganglia territories are engaged in early and advanced motor sequence learning. Proc Natl Acad Sci USA 102: 12566–12571. [DOI] [PMC free article] [PubMed] [Google Scholar]
- Logothetis NK ( 2008): What we can do and what we cannot do with fMRI. Nature 453: 869–878. [DOI] [PubMed] [Google Scholar]
- Logothetis NK, Pauls J, Augath M, Trinath T, Oeltermann A ( 2001): Neurophysiological investigation of the basis of the fMRI signal. Nature 412: 150–157. [DOI] [PubMed] [Google Scholar]
- Maguire EA, Gadian DG, Johnsrude IS, Good CD, Ashburner J, Frackowiak RS, Frith CD ( 2000): Navigation‐related structural change in the hippocampi of taxi drivers. Proc Natl Acad Sci USA 97: 4398–4403. [DOI] [PMC free article] [PubMed] [Google Scholar]
- Manto M, Oulad ben Taib N, Luft AR ( 2006): Modulation of excitability as an early change leading to structural adaptation in the motor cortex. J Neurosci Res 83: 177–180. [DOI] [PubMed] [Google Scholar]
- Miall RC, King D ( 2008): State estimation in the cerebellum. Cerebellum 7: 572–576. [DOI] [PMC free article] [PubMed] [Google Scholar]
- Miall RC, Christensen LO, Cain O, Stanley J ( 2007): Disruption of state estimation in the human lateral cerebellum. PLoS Biol 5: e316. [DOI] [PMC free article] [PubMed] [Google Scholar]
- Mink JW ( 1996): The basal ganglia: Focused selection and inhibition of competing motor programs. Prog Neurobiol 50: 381–425. [DOI] [PubMed] [Google Scholar]
- Nichols TE, Holmes AP ( 2002): Nonparametric permutation tests for functional neuroimaging: A primer with examples. Hum Brain Mapp 15: 1–25. [DOI] [PMC free article] [PubMed] [Google Scholar]
- Passingham RE, Stephan KE, Kotter R ( 2002): The anatomical basis of functional localization in the cortex. Nat Rev Neurosci 3: 606–616. [DOI] [PubMed] [Google Scholar]
- Pezawas L, Verchinski BA, Mattay VS, Callicott JH, Kolachana BS, Straub RE, Egan MF, Meyer‐Lindenberg A, Weinberger DR ( 2004): The brain‐derived neurotrophic factor val66met polymorphism and variation in human cortical morphology. J Neurosci 24: 10099–10102. [DOI] [PMC free article] [PubMed] [Google Scholar]
- Sanes JN, Dimitrov B, Hallett M ( 1990): Motor learning in patients with cerebellar dysfunction. Brain 113 ( Part 1): 103–120. [DOI] [PubMed] [Google Scholar]
- Schmahmann JD, Doyon J, Toga AW, Petrides M, Evans AC ( 2000): MRI Atlas of the Human Cerebellum. San Diego, California: Academic Press. [Google Scholar]
- Smith SM ( 2002): Fast robust automated brain extraction. Hum Brain Mapp 17: 143–155. [DOI] [PMC free article] [PubMed] [Google Scholar]
- Smith SM, Jenkinson M, Woolrich MW, Beckmann CF, Behrens TE, Johansen‐Berg H, Bannister PR, De Luca M, Drobnjak I, Flitney DE, Niazy RK, Saunders J, Vickers J, Zhang Y, De Stefano N, Brady JM, Matthews PM ( 2004): Advances in functional and structural MR image analysis and implementation as FSL. Neuroimage 23 ( Suppl 1): S208–S219. [DOI] [PubMed] [Google Scholar]
- Smith SM, Jenkinson M, Johansen‐Berg H, Rueckert D, Nichols TE, Mackay CE, Watkins KE, Ciccarelli O, Cader MZ, Matthews PM, Behrens TE ( 2006): Tract‐based spatial statistics: Voxelwise analysis of multi‐subject diffusion data. Neuroimage 31: 1487–1505. [DOI] [PubMed] [Google Scholar]
- Stinear CM, Barber PA, Smale PR, Coxon JP, Fleming MK, Byblow WD ( 2007): Functional potential in chronic stroke patients depends on corticospinal tract integrity. Brain 130 ( Part 1): 170–180. [DOI] [PubMed] [Google Scholar]
- Tamas Kincses Z, Johansen‐Berg H, Tomassini V, Bosnell R, Matthews PM, Beckmann CF ( 2008): Model‐free characterization of brain functional networks for motor sequence learning using fMRI. Neuroimage 39: 1950–1958. [DOI] [PubMed] [Google Scholar]
- Tardif CL, Collins DL, Pike GB ( 2009): Sensitivity of voxel‐based morphometry analysis to choice of imaging protocol at 3 T. Neuroimage 44: 827–838. [DOI] [PubMed] [Google Scholar]
- Thoroughman KA, Shadmehr R ( 1999): Electromyographic correlates of learning an internal model of reaching movements. J Neurosci 19: 8573–8588. [DOI] [PMC free article] [PubMed] [Google Scholar]
- Tomassini V, Jbabdi S, Klein JC, Behrens TE, Pozzilli C, Matthews PM, Rushworth MF, Johansen‐Berg H ( 2007): Diffusion‐weighted imaging tractography‐based parcellation of the human lateral premotor cortex identifies dorsal and ventral subregions with anatomical and functional specializations. J Neurosci 27: 10259–10269. [DOI] [PMC free article] [PubMed] [Google Scholar]
- Tremblay L, Schultz W ( 1999): Relative reward preference in primate orbitofrontal cortex. Nature 398: 704–708. [DOI] [PubMed] [Google Scholar]
- Tseng YW, Diedrichsen J, Krakauer JW, Shadmehr R, Bastian AJ ( 2007): Sensory prediction errors drive cerebellum‐dependent adaptation of reaching. J Neurophysiol 98: 54–62. [DOI] [PubMed] [Google Scholar]
- Tubau E, Escera C, Carral V, Corral MJ ( 2007): Individual differences in sequence learning and auditory pattern sensitivity as revealed with evoked potentials. Eur J Neurosci 26: 261–264. [DOI] [PubMed] [Google Scholar]
- Tuch DS, Salat DH, Wisco JJ, Zaleta AK, Hevelone ND, Rosas HD ( 2005): Choice reaction time performance correlates with diffusion anisotropy in white matter pathways supporting visuospatial attention. Proc Natl Acad Sci USA 102: 12212–12217. [DOI] [PMC free article] [PubMed] [Google Scholar]
- Ungerleider LG, Doyon J, Karni A ( 2002): Imaging brain plasticity during motor skill learning. Neurobiol Learn Mem 78: 553–564. [DOI] [PubMed] [Google Scholar]
- Unsworth N, Engle RW ( 2005): Individual differences in working memory capacity and learning: Evidence from the serial reaction time task. Mem Cognit 33: 213–220. [DOI] [PubMed] [Google Scholar]
- van Mier H, Tempel LW, Perlmutter JS, Raichle ME, Petersen SE ( 1998): Changes in brain activity during motor learning measured with PET: Effects of hand of performance and practice. J Neurophysiol 80: 2177–2199. [DOI] [PubMed] [Google Scholar]
- Wegner C, Filippi M, Korteweg T, Beckmann C, Ciccarelli O, De Stefano N, Enzinger C, Fazekas F, Agosta F, Gass A, Hirsch J, Johansen‐Berg H, Kappos L, Barkhof F, Polman C, Mancini L, Manfredonia F, Marino S, Miller DH, Montalban X, Palace J, Rocca M, Ropele S, Rovira A, Smith S, Thompson A, Thornton J, Yousry T, Matthews PM ( 2008): Relating functional changes during hand movement to clinical parameters in patients with multiple sclerosis in a multi‐centre fMRI study. Eur J Neurol 15: 113–122. [DOI] [PubMed] [Google Scholar]
- Woolrich MW, Ripley BD, Brady M, Smith SM ( 2001): Temporal autocorrelation in univariate linear modeling of FMRI data. Neuroimage 14: 1370–1386. [DOI] [PubMed] [Google Scholar]
- Young FM, Hamer RM ( 1987): Multidimensional Scaling: History, Theory and Applications: New York: Lawrence Erlbaum Assoc. [Google Scholar]
- Zhang Y, Brady M, Smith S ( 2001): Segmentation of brain MR images through a hidden Markov random field model and the expectation‐maximization algorithm. IEEE Trans Med Imaging 20: 45–57. [DOI] [PubMed] [Google Scholar]
Associated Data
This section collects any data citations, data availability statements, or supplementary materials included in this article.
Supplementary Materials
Additional Supporting Information may be found in the online version of this article.
Figure S1. Motor learning has been tested using a visuomotor tracking task. (A) The subject's arm is held in a semipronated position, supported by an armrest (top right). Subjects are asked to track a computer‐controlled bar (blue) displayed on a screen (top left) by altering the amount of grip pressure applied isometrically to a hand‐held sensor (top right) controlling the subject's bar (green) (top left). (B) The target bar is programmed to move in a sinusoidal fashion (blue line), the rate and amplitude of which can be altered to create either a repetitive sequence (Sequence) or a randomly varying (Random) cue. The distance between the computer‐ and the subject‐controlled bars (green line) represents the absolute tracking error (red line). Reduction in the p95 of the absolute tracking error over time is used as a measure of learning.
Figure S2. Regions where BOLD signal change correlates negatively with baseline performance during the first block (p95 block1) of Sequence or Random cues (Z>2.3, p<0.05 corrected). Higher BOLD signal change in the Sequence vs. Rest (A) and Random vs. Rest (B) contrasts are associated with better performance during the first blocks of Sequence and Random conditions, respectively. R: right; L: left.
Figure S2. Regions where BOLD signal change correlates negatively with baseline performance during the first block (p95 block1) of Sequence or Random cues (Z>2.3, p<0.05 corrected). Higher BOLD signal change in the Sequence vs. Rest (A) and Random vs. Rest (B) contrasts are associated with better performance during the first blocks of Sequence and Random conditions, respectively. R: right; L: left.
Figure S3. Comparison between learning‐ and recovery‐dependent plastic changes. (A) Variation in functional activation of the ipsilateral (i.e., right) premotor cortex (PM) helps explain individual variation in learning scores, with “better learners” (as defined by steeper learning curves) showing higher signal changes in this region (results from this study). PM is also involved in spontaneous motor recovery after brain damage. Examples from multiple sclerosis (Wegner et al., 2008) and stroke (Bosnell et al., in preparation) confirm the functional relevance of PM in spontaneous motor recovery and potentially in individual variation in recovery outcomes. (B) Variation in functional activation of the cerebellum are associated with individual variation in learning (results from this study), as well as in individual differences in rehabilitation‐driven recovery (Johansen‐Berg et al., 2002), suggesting the cerebellum as a source of plasticity both in the healthy and diseased brains. R: right; L: left.
Table S1. Functional correlates of individual baseline performance (p95 block1 of Sequence and p95 block1 of Random). Mean location in MNI x, y, z coordinates, and Z score of peak voxel for each cluster showing a significant negative correlation between initial performance (p95 block1) and activation during the Sequence or Random condition (vs. Rest) (random effects, Z>2.3, p<0.05 corrected). Abbreviations: SMA: supplementary motor area; PMd: lateral premotor cortex dorsal; R: right; L: left.