

Abstract
αβ T cell receptors (TCR) recognize peptide antigens presented by class I or class II major histocompatibility complex molecules (pMHC). Here we review the use of thermodynamic measurements in the study of TCR-pMHC interactions, with attention to the diversity in binding thermodynamics and how this is related to the variation in TCR-pMHC interfaces. We show that there is no enthalpic or entropic signature for TCR binding; rather, enthalpy and entropy changes vary in a compensatory manner that reflects a narrow free energy window for the interactions that have been characterized. Binding enthalpy and entropy changes do not correlate with structural features such as buried surface area or the number of hydrogen bonds within TCR-pMHC interfaces, possibly reflecting the myriad of contributors to binding thermodynamics, but likely also reflecting a reliance on van’t Hoff over calorimetric measurements and the unaccounted influence of equilibria linked to binding. TCR-pMHC binding heat capacity changes likewise vary considerably. In some cases the heat capacity changes are consistent with conformational differences between bound and free receptors, but there is little data indicating these conformational differences represent the need to organize commonly disordered CDR loops. In this regard, we discuss how thermodynamics may provide additional insight into conformational changes occurring upon TCR binding. Finally, we highlight opportunities for the further use of thermodynamic measurements in the study of TCR-pMHC interactions, not only for understanding TCR binding in general, but for understanding specifics of individual interactions and the engineering of T cell receptors with desired molecular recognition properties.
Keywords: T cell receptors, peptide/MHC complexes, thermodynamics, enthalpy/entropy compensation, conformational selection
Introduction
Recognition of an antigenic peptide presented by a class I or class II major histocompatibility complex (MHC) protein is required for the initiation and propagation of a cellular immune response as well as generation and maintenance of the T cell repertoire. Peptide/MHC complexes (pMHC) are recognized by αβ T cell receptors (TCR) expressed on the surface of CD4+ or CD8+ T cells (Figure 1). In some respects, T cell receptors are similar to antibodies; important here is that their antigen binding sites are composed of multiple complementarity-determining region (CDR) loops generated via genetic recombination processes similar to those used in antibody generation. However, one of the many key differences between antibodies and TCRs is the nature of the ligand recognized. Whereas antibodies recognize linear or nonlinear epitopes of seemingly unlimited chemical and structural diversity, T cell receptors recognize a composite surface consisting of elements of the antigenic peptide as well as the α-helices of the MHC peptide-binding groove (recently reviewed in Rudolph et al., 2006). Thus, unlike antibodies, the ligand for the TCR consists of both self (the MHC) and non-self (the peptide).
Figure 1.

Ribbon diagram of a complex between an αβ T cell receptor and a peptide/MHC complex. The α chain of the TCR is red and the β chain is blue. The peptide in the peptide/MHC complex is in yellow stick format, the heavy chain cyan, and β2m is light brown. The dual recognition of peptide (non-self) and MHC (self) is evident from the figure. The figure is of the B7 TCR recognizing the Tax peptide presented by HLA-A2, PDB file 1BD2 [Ding et al., 1998].
A second key difference between antibodies and TCRs is that TCRs are cross-reactive, capable of recognizing multiple peptides bound to one or more MHC molecules (recently reviewed in [Wucherpfennig et al., 2007], where use of the term “polyspecific” was suggested for describing TCR recognition of multiple ligands). TCR cross-reactivity (or polyspecificity) is necessary for the development and continued maintenance of the T cell arm of the immune system and is crucial given the fixed size of the T cell repertoire relative to the vast universe of potential peptide antigens [Mason, 1998]. These two features, cross-reactivity and dual recognition of self/non-self, present special challenges and opportunities in the study of TCR molecular recognition. Here, we review the use of thermodynamic measurements in the study of TCR-pMHC interactions, with particular attention to how thermodynamic measurements have instructed our understanding of the determinants of TCR binding and specificity. We discuss opportunities for the further use of thermodynamic measurements, not only for understanding TCR binding in general, but for understanding specifics of individual interactions and the engineering of T cell receptors with desired molecular recognition properties. We also discuss the use of binding kinetics as a complementary tool to investigate molecular recognition properties, although we do not address the ongoing debate regarding the relative importance of TCR binding kinetics versus affinity in T cell signaling and activation (e.g., Rosette et al., 2001, Tian et al., 2007).
General features of TCR binding thermodynamics: is there a thermodynamic signature for TCR-pMHC binding?
Surface plasmon resonance studies of TCR-pMHC interactions performed in the mid-to-late 1990s with soluble ectodomains indicated that TCRs bind ligand weakly with slow-to-moderate association rates (usually ≤ 105 M−1 s−1) [Davis et al., 1998], slower than those expected for a diffusion limited, geometrically constrained protein-protein interaction [Janin, 1997, Vijayakumar et al., 1998]. As slow kinetics can result from conformational adjustments required for binding, and because little or no conformational differences were seen between bound and free pMHC [Garboczi et al., 1996, Garcia et al., 1998, Garcia et al., 1996], some authors suggested that TCR CDR loops must undergo conformational adjustments upon recognition of ligand [Matsui et al., 1994]. This suggestion was supported by crystallographic studies with the αβ TCR 2C, for which three out of six CDR loops were shown to populate different conformations in the free and bound states [Garcia et al., 1998, Garcia et al., 1996]. Around the time of these observations, the inherent cross-reactivity of T cell receptors was becoming increasingly appreciated (e.g., Bhardwaj et al., 1993, Evavold et al., 1995, Wucherpfennig and Strominger, 1995), highlighted by Mason’s estimation that any given T cell is capable of reacting “productively with approximately 106 different MHC-associated minimal peptide epitopes” [Mason, 1998]. TCR cross-reactivity, sometimes discussed as binding degeneracy, fit well with the notion that receptor binding occurs with conformational shifts in one or more CDR loops, as the availability of multiple conformations for unbound TCRs could broaden the reactivity of any given receptor.
The first measurements of TCR binding thermodynamics closely followed, with van der Merwe and colleagues showing in 1999 that the human TCR JM22 and the murine TCR F5 bound pMHC with favorable enthalpy changes and unfavorable entropy changes [Willcox et al., 1999]. Although these measurements were performed via van’t Hoff analysis not accounting for the influence of a heat capacity change, the measurement with JM22 was corroborated by a direct measurement of the enthalpy change using titration calorimetry [Willcox et al., 1999]. Considered with the kinetic and structural data, the unfavorable entropy changes for the binding of JM22 and F5 suggested that rather than simply adjusting conformation upon binding, TCR CDR loops are flexible in the unbound state. Such flexibility was proposed to be a key feature of T cell receptors and their biology, allowing the receptor binding site to adapt to different ligands.
The measurements of van der Merwe were closely followed by a report from the Davis lab, who showed that the 2B4 TCR bound the mouse class II MHC I-Ek presenting the MCC peptide with thermodynamics similar to those for the JM22 and F5 TCRs (a favorable enthalpy change and an unfavorable entropy change, reported at 25 °C) [Boniface et al., 1999]. Van’t Hoff analysis was used again, although the data analysis incorporated a heat capacity change, which at −660 cal/mol/K was reasonably large for a protein-protein interaction that buried about 2000 Å2 [Stites, 1997]. The availability of measurements of both ΔS° and ΔCp allowed Davis and co-workers to perform a structure-based thermodynamic dissection of the binding thermodynamics, albeit using modeled structures. The approach used, developed by Spolar and Record in their analysis of protein-DNA interactions [Spolar and Record, 1994], extracts the contribution of changes in solvation and the loss in translational and rotational degrees of freedom from overall binding entropy changes, with the residual attributed to changes in protein backbone or side chain conformational entropy. Application of this method to the 2B4 TCR binding data suggested a significant conformational entropy penalty must be overcome for binding, estimated to result from the need for approximately 30 amino acids to “fold” in order for the 2B4 TCR to bind. Again, considering prior kinetic and structural observations, the overall interpretation of the data was that flexibility in the TCR CDR loops permitted a TCR repertoire of limited size to interact with a much larger array of pMHC ligands, i.e. the cross-reactivity inherent in the T cell receptor was attributable at least in part to the capacity for one or more CDR loops to adopt multiple conformations.
Additional reports of unfavorable entropy changes for TCR-pMHC interactions followed [Anikeeva et al., 2003, Garcia et al., 2001, Krogsgaard et al., 2003, Lee et al., 2004], and for a brief period the notion that unfavorable binding entropy changes reflect a loss of TCR conformational flexibility was generally well accepted, having been bolstered by structural studies indicating conformational differences between free and bound receptors (or conformational differences in the same receptor bound to different ligands) [Ding et al., 1999, Garcia et al., 1998, Garcia et al., 1996, Reiser et al., 2003, Reiser et al., 2002]. T cell receptors were presumed to bind ligand with a “thermodynamic signature” consisting of a favorable enthalpy change and an unfavorable entropy change, with strong implications for T cell immunobiology.
However, this thermodynamic signature was soon questioned with the description of entropically favorable TCR-pMHC interactions. The first example was the binding of the A6 TCR to the Tax peptide presented by HLA-A2 [Davis-Harrison et al., 2005]. Notably, the CDR loops of the A6 TCR had previously been shown to change conformation upon recognition of different ligands [Ding et al., 1999], an observation used to support the idea of structural plasticity within TCR binding sites. The second observation of an entropically favorable TCR-pMHC interaction was the binding of the LC13 TCR to the FLR peptide presented by HLA-B8 [Ely et al., 2006]. Since these two observations, numerous other TCR binding reactions have been shown to be entropically favorable, conclusively demonstrating that unfavorable binding entropies are not a signature of TCR recognition of pMHC [Colf et al., 2007, Gakamsky et al., 2007, Mazza et al., 2007, Miller et al., 2007], irrespective of whether conformational changes occur upon binding.
Yet should these results have been surprising? The overall binding thermodynamics associated with molecular recognition in any system are influenced not only by what needs to occur for binding to proceed (e.g., conformational changes or reductions in flexibility), but also the specific details of the resulting interface (e.g., hydrophobic/hydrophilic surface buried, hydrogen bonds and salt bridges formed, water or ion incorporation, pKa shifts, etc.). In that respect, due to the extensive variation in the makeup of the CDR loops, the different peptides and MHC molecules, and the variations in TCR binding modes, the chemistry in every TCR-pMHC interface is different. Loop conformational changes or reductions in flexibility could indeed occur in any given interaction, but the thermodynamic consequences may be masked by other contributors, the costs of which are difficult to predict – even the deceptively simple entropic cost for forming a complex out of two proteins is not well established given differing capacities for residual motion at the binding site [Benzhuo Lu, 2005, Brady and Sharp, 1997] and observations that protein dynamics can redistribute or even increase upon ligand binding (e.g., Fayos et al., 2003, Grunberg et al., 2006, Zidek et al., 1999).
Thus, the notion that TCR-pMHC interactions should have an enthalpic/entropic “signature” is too much of a generalization. A good example is provided by the A6 and B7 TCRs. Both receptors recognize the Tax/HLA-A2 ligand as a strong agonist with similar structural topologies and using the same Vβ segments, yet the binding thermodynamics for the two receptors are markedly different: whereas the binding of A6 is entropically favored, the binding of B7 is entropically opposed, and the binding enthalpy changes differ by more than 10 kcal/mol at 25 °C.
The variation in TCR-pMHC binding thermodynamics: energetically, biology doesn’t care how you form the complex, just that you do
If there is no enthalpic or entropic signature for TCR-pMHC interactions, are there trends in the thermodynamic data which may yield insight into T cell immunobiology? All of the TCR-pMHC interactions whose underlying binding thermodynamics have been characterized to-date are tabulated in Table 1, and plotted graphically as binding ΔH° vs. binding ΔS° in Figure 2 (all data are shown at a common reference temperature of 25 °C). Panel A in Figure 2 shows data for only “wild-type” TCRs, peptides, or MHC molecules; panel B adds thermodynamic data for all interactions involving peptide variants, MHC mutants, and altered TCRs (again, only for those interactions for which ΔH° and ΔS° are available). A number of details are clear from this analysis. Examining only the “wild-type” interactions (Fig. 2A), the enthalpy/entropy changes vary over a wide range (from −30 to 12 kcal/mol for ΔH° and from −80 to 60 cal/mol/K for ΔS°), yet the binding affinities (reported by the ΔG° values) are all very similar. Binding enthalpy changes are almost all favorable, consistent with the majority of protein-protein interactions [Stites, 1997], although there are several with enthalpy changes very close to zero. A close comparison of the data in Figure 2A with Table 1, in which all the values are tabulated, reveals there are no commonalities dictated by either T cell receptor or MHC subtype (discussed further below).
Table 1.
Published TCR-pMHC binding thermodynamics at 25 °C
| TCR – pMHC Interaction | ΔS° (cal/mol/K) |
ΔH° (kcal/mol) |
ΔG° (kcal/mol) |
ΔCp (cal/mol/K) |
MHC class | Notes | Reference |
|---|---|---|---|---|---|---|---|
| 2C - dEV8/H-2Kb | −54.33 | −22.7 | −6.5 | −1100 | I | Degano et al 2000, Kroggsgard et al. 2003 | |
| 2C - p2Ca/H-2Kb | −77 | −29 | −6.0 | −1500 | I | Degano et al. 2000, Kroggsgard et al. 2003 | |
| 2C - QL9/H2-Ld | 11.58 | −4.19 | −7.6 | -- | I | a | Colf et al. 2007 |
| 2C - SIYR/H2-Kb | −4.1 | −8.4 | −7.2 | −1100 | I | Degano et al. 2000, Kroggsgard et al. 2003 | |
| A6 - Tax/HLA-A2 | 11.6 ± 3.5 | −4.2 ± 1.1 | −7.7 | −560 ± 120 | I | Davis-Harrision et al. 2005 | |
| A6 - Tax/HLA-A2 | 25 ± 1 | −1.8 ± 0.3 | −9.2 ± 0.1 | −520 ± 50 | I | b | Armstrong and Baker, 2007 |
| AHIII - p1049/HLA-A2 | 14.76 | −3.9 | −8.3 | -- | I | c | Miller et al. 2007 |
| AHIII - p1049/HLA-A2 K66A | 21.13 | −0.6 | −6.9 | -- | I | c | Miller et al. 2007 |
| B7 - Tax/HLA-A2 | −22 ± 3.1 | −14.6 ± 0.9 | −8.0 | −750 ± 90 | I | Davis-Harrison et al. 2005 | |
| BM3.3 - pBM1/H2-Kb | −19.8 ± 1 | −13.4 ± 0.4 | −7.5 ± 0.1 | −535 ± 76 | I | Mazza et al. 2007 | |
| BM3.3 - pBM8/H2-Kbm8 | 8 ± 1 | −3.1 ± 0.4 | −5.5 ± 0.03 | −141 ± 7 | I | Mazza et al. 2007 | |
| BM3.3 - pBM8(Y4D)/H2−Kbm8 | 4 ± 1 | −5.4 ± 0.1 | −6.5 ± 0.1 | −108 ± 3.3 | I | Mazza et al. 2007 | |
| CMV - pp65/HLA-A2 | 13.89 ± 2.34 | −2.97 ± 0.5 | −7.1 | −190 ± 300 | I | Gakamsky et al. 2007 | |
| D3 - SL9/HLA-A2 | −10 ± 2 | −10.4 ± 0.6 | −7.5 | −363 ± 80 | I | Anikeeva et al. 2003 | |
| F5 - NP/H2-Db | −41 | −19 | −6.8 | -- | I | d | Willcox et al. 1999 |
| G10 - SLF/HLA-A2 | −10.7 ± 1.7 | −10.4 ± 0.4 | −7.2 | −620 ± 50 | I | Lee et al. 2004 | |
| G10 - SLY/HLA-A2 | −9.39 ± 1.3 | −10.5 ± 0.4 | −7.7 | −630 ± 50 | I | Lee et al. 2004 | |
| LC13 - FLR/HLA-B8 | 14 ± 8.7 | −2.4 ± 2.8 | −6.7 ± 0.05 | −620 ± 270 | I | Ely et al. 2006 | |
| 2C m6 - QL9/H2-Ld | −16.25 | −13.8 | −9.04 | -- | I | a | Colf et al. 2007 |
| P14 - gp33/H2-Db | −8 | −10.8 | −8.4 | −600 | I | Boulter et al. 2007 | |
| 172.1 - MBP/I-Au | −48 | −21.2 | −6.9 | −159 | II | e | Garcia et al. 2001 |
| JM22 - Flu/HLA-A2 | −50 ± 2 | −23 ± 0.6 | −7.1 ± 0.2 | −640 ± 100 | I | Willcox et al. 1999, Ishizuka et al. 2008 | |
| JM22(I53βV) - Flu/HLA-A2 | −22 ± 0.6 | −50 ± 2 | −7.0 | −630 ± 100 | I | Ishizuka et al. 2008 | |
| JM22(N55βA) - Flu/HLA−A2 | −18 ± 0.9 | −40 ± 3 | −6.1 | −330 ± 110 | I | Ishizuka et al. 2008 | |
| JM22(D56βA) - Flu/HLA−A2 | −24 ± 1.6 | −57 ± 5 | −7.1 | −710 ± 150 | I | Ishizuka et al. 2008 | |
| JM22(Q58βA) - Flu/HLA-A2 | −18 ± 0.8 | −37 ± 3 | −6.7 | −320 ± 70 | I | Ishizuka et al. 2008 | |
| JM22(Q58βE) - Flu/HLA-A2 | −20 ± 0.4 | −44 ± 1 | −7.2 | −340 ± 50 | I | Ishizuka et al. 2008 | |
| JM22(S99βA) – Flu/HLA-A2 | −18 ± 0.5 | −34 ± 2 | −7.2 | −420 ± 60 | I | Ishizuka et al. 2008 | |
| JM22(Y101βA) - Flu/HLA-A2 | −29 ± 0.8 | −74 ± 3 | −7.0 | −1100 ± 110 | I | Ishizuka et al. 2008 | |
| JM22(Y101βF) – Flu/HLA-A2 | −20 ± 0.3 | −44 ± 1 | −6.7 | −410 ± 40 | I | Ishizuka et al. 2008 | |
| JM22(S32βA) – Flu/HLA−A2 | −24 ± 0.8 | −60 ± 3 | −6.2 | −480 ± 70 | I | Ishizuka et al. 2008 | |
| JM22(Q34βA) – Flu/HLA-A2 | −23 ± 1.1 | −57 ± 4 | −6.2 | −1100 ± 130 | I | Ishizuka et al. 2008 | |
| 1934.4 – MBP/I-Au | −32 | −15.7 | −6.1 | −1248 | II | e | Garcia et al. 2001 |
| 2B4 - 102S/I-Ek | −23.0 ± 10.2 | −12.6 ± 1.8 | −5.7 ± 3.5 | −300 ± 300 | II | f | Krogsgaard et al. 2003 |
| 2B4 - K2/I-Ek | −22.2 ± 5.2 | −13.6 ± 1.3 | −7.0 ± 2.0 | −2100 ± 200 | II | f | Krogsgaard et al. 2003 |
| 2B4 - K3/I-Ek | −42.1 ± 16.8 | −18.5 ± 2.6 | −6.0 ± 5.7 | −4000 ± 500 | II | f | Krogsgaard et al. 2003 |
| 2B4 - K5/I-Ek | −54.9 ± 5.2 | −23.6 ± 1.6 | −7.2 ± 2.2 | −1200 ± 100 | II | f | Krogsgaard et al. 2003 |
| 2B4 - MCC88–103/I-Ek | −18.7 ± 0.6 | −12.7 ± 0.2 | −7.1 | −663 ± 53 | II | Boniface et al. 1999 | |
| 2B4 - MCC95–103/I-Ek | −16.0 ± 5.7 | −11.8 ± 1.8 | −7.0 ± 2.5 | −600 ± 800 | II | f | Krogsgaard et al. 2003 |
| 2B4 - PCC/I-Ek | 59.6 ± 41.0 | 11.5 ± 3.5 | −6.3 ± 12.7 | −1800 ± 200 | II | f | Krogsgaard et al. 2003 |
| 2B4 - PCC(A103K)/I-Ek | −25.1 ± 3.5 | −14.4 ± 1.1 | −6.9 ± 1.5 | −1000 ± 100 | II | f | Krogsgaard et al. 2003 |
Values reported at 20 °C, no heat capacity value to scale ΔH° and ΔS° to 25 °C.
Calorimetric measurement; values are the “intrinsic” binding thermodynamics corrected for the influence of linked protonation.
Calorimetric measurement; errors in ΔH° reported to be < 5%.
Van’t Hoff analysis without ΔCp term; F5 ΔH° reproduced via titration calorimetry.
Reference temperature not indicated, assumed to be 25 °C.
Values reported at temperatures ranging from 12 °C to 28 °C, scaled to 25 °C using reported ΔCp values.
Figure 2.

Diversity in TCR-pMHC binding enthalpy and entropy changes revealed by plotting ΔH° and ΔG° vs. ΔS° at 25 °C. A) Only data for interactions involving wild-type TCRs, wild-type MHCs, and native peptides. B) All data including mutant proteins and modified peptides. For both A and B, data involving recognition of class I pMHC are shown as red triangles, data involving recognition of class II MHC are shown as blue squares, and ΔG° values for recognition of both class I and class II pMHC are shown as black circles. Errors were included when available. The lines represent linear fits to the ΔH° vs. ΔS° data. The clear linearity reflects the presence of enthalpy/entropy compensation within the data, but this only arises because ΔG° is relatively invariant with respect to ΔH° as described in the text. For panel A, the slope and intercept are 291 K and −7.3 kcal/mol and R2 = 0.99. For panel B, the slope and intercept are 295 K and −7.1 kcal/mol and R2 = 0.99. All data are tabulated in Table 1, and unless otherwise indicated reported at a reference temperature of 298 K (25 °C).
Is there any distinction in the data between recognition of class I or class II MHC? The majority (17/20) of the interactions in Fig. 2A are for recognition of peptides presented by class I MHC molecules. The three interactions involving class II MHC are indeed characterized by unfavorable entropy changes offset by very favorable enthalpy changes, but these values do not by themselves distinguish recognition of class II from class I MHC molecules, as the values for the three class II interactions are bracketed by the values for the class I interactions. It remains possible that more thermodynamic data for class II will reveal more clustered enthalpy and entropy values, amounting to an MHC class II-specific thermodynamic signature; however, considering that the chemical variation in class II interfaces is no less than the chemical variation in class I interfaces, this would be unexpected. Overall, the data seem clear in that as far as enthalpy and entropy are concerned, it matters not how you form the TCR-pMHC complex, just that you do.
The trends in the TCR-pMHC thermodynamic data remain unchanged if thermodynamic data involving peptide variants, MHC mutants, and altered TCRs are included (Fig. 2B). While the class II data are still clustered in the favorable enthalpy/unfavorable entropy regime, this arises because of the large number of altered peptides examined with the 2B4 TCR [Krogsgaard et al., 2003], most which maintain the general overall thermodynamic trend of the wild-type interaction when compared at the common reference temperature of 25 °C.
The linearity of the plots in Figure 2 reveals a striking degree of enthalpy/entropy compensation in the TCR-pMHC thermodynamic binding data. Enthalpy/entropy compensation is often described with regard to compensating thermodynamics in molecular events such as flexibility vs. specificity, hydrogen bonding, etc. However, in the case of the TCR-pMHC data, the compensation arises solely because the range of binding free energies for the various interactions studied is small relative to the range of binding enthalpies: for all the data available, ΔH° spans 40 kcal/mol, whereas ΔG° spans only 3 kcal/mol. Thus, compared to the range in ΔH°, ΔG° is essentially constant. A plot of ΔH° as a function of ΔS° as in Fig. 2 consequently takes the form of ΔH° = TΔS° + 〈ΔG°〉, or the equation of a line with slope equal to the reference temperature of the data and a y-intercept equal to the average ΔG°. In the case of Figure 2, the slope and intercepts for Figs. 2A and 2B are 291 and 295 K and −7.3 and −7.1 kcal/mol, respectively, with an actual reference temperature of 298 K and average ΔG° values of −7.2 and −7.1 Results such as this are commonly seen in discussions of entropy/enthalpy compensation and are one of the main contributors to a vigorous debate regarding the phenomenon [Cooper et al., 2001, Jen-Jacobson et al., 2000, Sharp, 2001]. The appearance of enthalpy/entropy compensation within the entire TCR-pMHC thermodynamic database therefore indicates only that the measured interactions are all of very similar affinities and the underlying thermodynamics for the various TCR-pMHC interactions vary widely. Two questions that arise then are a) why are the affinities for the various interactions in Table 1 and Figure 2 so similar (i.e., why is there a narrow free energy window), and b) can the variation in enthalpy and entropy be related to properties of the individual interactions?
With regard to the first question, most of the interactions shown represent TCR recognition of efficiently activating ligands, the exceptions being recognition of p2Ca/H-2Kb by the 2C TCR and p1049/HLA-A2 by the K66A mutant of the AHIII TCR. Do the similar affinities reflect a biological requirement, perhaps reflecting the need to ensure efficient recognition while biasing against autoimmunity [Holler et al., 2003]? Is a tight window of binding free energy necessary for efficient TCR signaling, perhaps reflecting optimal kinetic parameters [McKeithan, 1995]? Or are the interactions in Figure 2 simply TCR-pMHC interactions which can easily be investigated biophysically, i.e. the “low-hanging fruit” of TCR interaction thermodynamics? The observation that none of the measured affinities are substantially stronger than 1 µM would seem to argue for a biological limit on how strong of an affinity a positively selected TCR can have towards a fully activating ligand (although T cells expressing receptors engineered for very high affinity can retain specificity and function; see Weber et al., 2005). At the other end of the scale, however, some very weak interactions can activate T cells (e.g., Gagnon et al., 2006). Further biophysical investigations, including those involving weak or partial agonists and pre-selection TCRs are needed to fully address this question. Emerging technologies for accurately measuring low affinities and calorimeters with enhanced sensitivity and substantially reduced sample requirements will be helpful in this regard.
With regard to the second question, so far there are no clear correlations between structural or dynamical features and TCR binding enthalpy or entropy changes. Table 2 summarizes features of the TCR-pMHC interactions whose thermodynamics have been characterized and for which structures of the ternary complexes are available. Binding enthalpy changes are not correlated with the number of hydrogen bonds or salt-bridges in the interface, nor are they well predicted by empirical prediction methods that account for buried polar and apolar surface area [Baker and Murphy, 1998, Murphy and Freire, 1992]. As discussed below, there may be multiple reasons for this, including not only conformational differences between free and bound TCRs, but also inaccuracies in van’t Hoff measurements and the potentially significant influence of linked equilibria. Importantly though, structural data is not available for all the TCR-pMHC interactions whose thermodynamics have been measured, and, excluding a single NMR study that examined dynamics on the picosecond timescale [Hare et al., 1999], there have been no direct assays of CDR loop dynamics with which to compare binding entropy changes.
Table 2.
Structural features and predicted thermodynamics for TCR-pMHC interactions characterized both structurally and thermodynamically
| TCR – pMHC Interaction | Buried Apolar SASA a | Buried Polar SASA a | Hydrogen bonds b | Salt bridges | ΔH° experimental c | ΔH° predicted d | ΔCpexperimental c | ΔCppredicted 1 e | ΔCppredicted 2 f | PDB ID |
|---|---|---|---|---|---|---|---|---|---|---|
| (Å2) | (Å2) | (kcal/mol) | (kcal/mol) | (cal/mol/K) | (cal/mol/K) | (cal/mol/K) | ||||
| 2C − dEV8/H−2Kb | 1139 | 841 | 4 | 1 | −22.7 | −6.8 | −1100 | −270 | −250 | 2CKB |
| 2C − QL9/H2-Ld | 1057 | 659 | 7 | 0 | −4.19 | −1.7 | -- | −280 | −250 | 2OI9 |
| 2C − SIYR/H2-Kb | 1074 | 773 | 5 | 0 | −8.4 | −5.6 | −1100 | −260 | −240 | 1G6R |
| A6 − Tax/HLA-A2 | 1259 | 817 | 11 | 4 | −4.2 ± 1.1 (−1.8 ± 0.3) g | −3.2 | −560 ± 120 (−520 ± 50) g | −330 | −290 | 1AO7 |
| AHIII – p1049/HLA-A2 | 1299 | 681 | 5 | 1 | −3.9 | +2.9 | -- | −380 | −320 | 1LP9 |
| AHIII − p1049/HLA-A2(K66A) | 1296 | 708 | 5 (3) | 4 (2) | −0.6 | +1.8 | -- | −370 | −320 | 2J8U |
| B7 − Tax/HLA-A2 | 1248 | 737 | 4 | 3 | −14.6 ± 0.9 | −0.3 | −750 ± 90 | −350 | −300 | 1BD2 |
| BM3.3 − pBM1/H2-Kb | 677 | 698 | 8 | 0 | −13.4 ± 0.4 | −11.6 | −535 ± 76 | −110 | −120 | 1FO0 |
| BM3.3 − pBM8/H2-Kbm8 | 880 | 657 | 6 | 1 | −3.1 ± 0.4 | −5.5 | −141 ± 7 | −210 | −190 | 2OL3 |
| 2C m6 − QL9/Ld | 1103 | 765 | 7 | 0 | −13.8 | −4.7 | -- | −280 | −250 | 2E7L |
| JM22 − Flu/HLA-A2 h | 932 / 897 / 934 | 633 / 610 / 648 | 8 | 0 | −23 ± 0.6 | −3.2 / −2.8 / −3.7 | −640 ± 100 | −250 | −210 / −210 / −200 | 1OGA / 2VLJ / 2VLK |
| JM22(S99βA) - Flu/HLA-A2 | 929 | 662 | 7 | 0 | −18 ± 0.5 | −4.1 | −420 ± 60 | −250 | −200 | 2VLR |
| LC13 – FLR/HLA-B8 | 1196 | 1040 | 8 | 1 | −2.4 ± 2.8 | −13.0 | −620 ± 270 | −270 | −240 | 1MI5 |
| 172.10 - MBP/I-Au | 1080 | 824 | 5 | 0 | −21.2 | −7.2 | −159 | −270 | −230 | 1U3H |
| 1934.4 - MBP/I-Au | 1055 | 938 | 8 | 2 | −15.7 | −12.4 | −1248 | −230 | −200 | 2PXY |
Buried apolar and polar solvent accessible surface area (SASA) calculated assuming a rigid body interaction, using a 1.4 Å probe radius and a 0.05 Å slice width using naccess (Hubbard and Thornton, 1993).
Hydrogen bonds calculated using HBPLUS (McDonald and Thornton, 1994), integrating the data tabulated in Rudolph et al., 2006.
Values from Table 1
Binding enthalpies predicted from buried apolar and polar solvent accessible surface area as described in Baker and Murphy, 1996. Scaled to 25 °C using predicted ΔCp values.
Binding heat capacity changes predicted from buried apolar and polar solvent accessible surface area as described in Baker and Murphy, 1997.
Binding heat capacity changes predicted from buried apolar and polar solvent accessible surface area as described in Spolar and Record, 1994
Values in parenthesis are the “intrinsic” binding thermodynamics removed from the influence of protonation (see Armstrong and Baker, 2007).
Three structures are available for the JM22-Flu/HLA-A2 complex (see Stewart-Jones, 2003 and Ishizuka et al. 2008).
As per phenomenological correlations with TCR binding thermodynamics, again, there are no clear correlations, but equivalent specificity data are not available for all the interactions that have been thermodynamically characterized. Interestingly, for the A6 and B7 TCRs, relaxed specificity is not correlated with a less favorable binding ΔS°. Binding of the A6 TCR is entropically favored, whereas binding of the B7 TCR is entropically opposed [Davis-Harrison et al., 2005]. Yet a detailed investigation of the fine specificity of the A6 and B7 TCRs indicated that A6 is considerably less specific than B7 [Hausmann et al., 1999]. Thus the A6 and B7 data are contrary to the general expectation that finer specificity arises from a “tightening” of conformational mobility, insofar as reported on by binding entropy changes.
Data quality and linked equilibria
An important issue when comparing binding thermodynamics for different interactions concerns the accuracy and precision of the data. All but two of the entries in Table 1 were collected via van’t Hoff analysis (i.e., analysis of measurements of affinities as a function of temperature). Although in all but one case a heat capacity term was included, van’t Hoff analysis requires a level of precision and accuracy in free energy measurements which can be difficult to achieve with weak or moderate affinity interactions, particularly when protein concentrations are limiting [Zhukov and Karlsson, 2007]. This point has been raised in discussions of differences between calorimetric and van’t Hoff enthalpies [Naghibi et al., 1995], where the discrepancy was eventually shown to be largely attributable to issues of accuracy, precision, error propagation, and data analysis [Chaires, 1997, Horn et al., 2002, Horn et al., 2001, Mizoue and Tellinghuisen, 2004]. Although some of the TCR binding data in Figure 2 were corroborated by calorimetric measurements, and in general the data in Figure 2 should be expected to be of high quality, it is worth appreciating that obtaining accurate thermodynamics via van’t Hoff analysis places high demands on data acquisition and analysis. On this note, although calorimetry may be preferable to van’t Hoff analyses, calorimetric measurements can likewise be inaccurate in the absence of a well-defined sigmoidal titration curve [Tellinghuisen, 2008, Wiseman et al., 1989], a problem which has limited the application of titration calorimetry in the studies of TCR-ligand interactions due to the need for very high protein concentrations. New instruments with higher sensitivity and reduced sample requirements should help obviate this concern (on a related note, due to concerns about the accuracies of both van’t Hoff and calorimetric data, the trend to publish thermodynamic values without showing relevant binding data should be strongly discouraged).
However, even if binding ΔH° and ΔS° values are highly accurate, equilibria linked to binding can cause the measured values to differ significantly from the true thermodynamics of binding. A frequently encountered form of linkage is proton linkage, which occurs when binding induces a shift in the pKa of an ionizable group [Baker and Murphy, 1996]. The contribution to the binding thermodynamics results from the proton release or uptake associated with the pKa shift: protons that are released due to a pKa decrease will be bound by the buffer, and protons taken up due to a pKa increase will be released by the buffer. As most biological buffers have very large enthalpies of ionization (e.g., 5 kcal/mol for HEPES at 25 °C), the contribution to the observed binding enthalpy change can be substantial. Further, because buffer ionization influences the binding ΔH° but not ΔG° [Baker and Murphy, 1996], there will be a compensatory shift in the binding ΔS°. Thus, proton linkage can dramatically influence both the enthalpy and entropies of binding. In extreme cases (or in cases where the intrinsic binding enthalpy is close to zero), the sign of ΔH° or ΔS° can vary with buffer choice [Baker and Murphy, 1997]. Although proton linkage is most commonly associated with calorimetric measurements, a pKa shift occurring upon binding will result in proton release/uptake regardless of which technique is used to monitor the process, and van’t Hoff measurements are just as susceptible to the influence of proton linkage as calorimetric measurements [Armstrong and Baker, 2007, Horn et al., 2002].
It remains to be seen how much influence proton linkage will have on the thermodynamics of TCR-pMHC interactions. However, because of its potentially large influence, as TCR-pMHC interactions are probed in more detail, measurements of binding thermodynamics in buffers with different ionization enthalpies will be an ever more important control. In the TCR-pMHC data summarized in Table 1, the influence of proton linkage has only been examined in two cases: recognition of p1049/HLA-A2 by the AHIII TCR and recognition of Tax/HLA-A2 by the A6 TCR. In the case off AHIII recognition, no evidence for proton linkage was found [Miller et al., 2007]. For A6 recognition of Tax/HLA-A2, proton linkage resulting from a pKa shift from 7.5 to 6.9 was found [Armstrong and Baker, 2007], resulting in a four-fold variation in binding enthalpy and a two-fold variation in binding entropy depending upon buffer choice. Although the overall thermodynamic profile of the reaction was not changed upon correcting for the influence of proton linkage (i.e., correcting for proton linkage still yielded a TCR-pMHC interaction with favorable enthalpy and entropy changes), the availability of the “intrinsic” thermodynamics removed from the influence of protonation allowed for a much more detailed interpretation of the binding thermodynamics in terms of interface structure and protein conformational shifts.
Heat capacity changes and molecular flexibility or conformational changes in TCR recognition
As noted above, interpretation of binding entropy changes in terms of conformational changes or reductions in molecular flexibility can be difficult. A clearer parameter for gauging the presence of changes in conformations is the heat capacity change, first applied to TCR-pMHC binding by Davis and colleagues in examining the binding of the 2B4 TCR to MCC/HLA-Ek [Boniface et al., 1999]. Heat capacity changes in protein binding reactions are strongly influenced by changes in solvation [Prabhu and Sharp, 2005], with the burial of hydrophobic surface contributing negatively to ΔCp and the burial of hydrophilic surface contributing positively to ΔCp [Murphy and Gill, 1991, Spolar et al., 1992]. Often the ΔCp for a rigid body interaction can be reliably estimated from the change in solvent exposed surface area upon binding, and it has become routine to conclude that binding reactions which have ΔCp values more negative than those estimated from the structure of the complex proceed with conformational changes that alter the solvent exposed surface area (although such conclusions are not uniformly accepted; see, for example, Henriques et al., 2000).
The reported heat capacity changes for TCR-pMHC interactions are generally large and negative, clustering between −400 and −800 cal/K/mol, although both larger [Ely et al., 2006, Garcia et al., 2001, Ishizuka et al., 2008, Krogsgaard et al., 2003] and smaller [Gakamsky et al., 2007, Garcia et al., 2001, Ishizuka et al., 2008, Krogsgaard et al., 2003, Mazza et al., 2007] values have been reported (Table 1). As shown in Table 2, many ΔCp values are substantially more negative than those calculated from the structures of the TCR-pMHC complexes. Thus, given the caveats that have been noted (particularly regarding the accuracy of van’t Hoff determined heat capacity changes), conformational differences between bound and free TCRs may be common, if not ubiquitous (see Chen et al., 2005 for a receptor that is nearly identical in the bound and free states).
But what are these conformational differences? Are they attributable to defined conformational changes or partial folding of CDR loops? As noted above, Davis and colleagues used heat capacity to dissect the binding entropy change for the recognition MCC/HLA-Ek by the 2B4 TCR, concluding that ~30 amino acids need to “fold” for binding to proceed [Boniface et al., 1999]. But as of yet there is little evidence for highly flexible CDR loops occurring with regularity – the electron density in most crystallographic structures of unligated TCRs has shown the various CDR loops in clearly defined positions, the two exceptions being the ELS4 and the 1.D9.B2 TCRs, for which missing electron density was observed in the crystal structures for CDR3α (ELS4) or CDR3β (1.D9.B2) [McBeth et al., 2008, Tynan et al., 2007]. Until detailed spectroscopic assays of CDR loop dynamics are available, we may be best advised by Garcia’s suggestion that TCR CDR loops are unlikely to be “easily accommodating limp noodles” [Garcia and Adams, 2005], instead adjusting their positions in more rigid conformational shifts. For the A6 TCR, analysis of the thermodynamic data suggest exactly this – after correcting for the influence of proton linkage, a thermodynamic dissection of the intrinsic binding thermodynamics showed that any TCR conformational rearrangements occurring in the A6 TCR upon binding Tax/HLA-A2 were likely to be entropically driven and enthalpically opposed, arguing against the ordering of highly flexible CDR loops upon binding [Armstrong and Baker, 2007].
Unusually large negative heat capacity changes (greater than −1 kcal/mol/K) have been measured for a few TCR-pMHC interactions [Ely et al., 2006, Garcia et al., 2001, Ishizuka et al., 2008, Krogsgaard et al., 2003], and these values have likewise been interpreted to result from conformational differences between bound and free receptor. However, using the two most widely used relationships between surface area and heat capacity [Baker and Murphy, 1998, Spolar and Record, 1994], a ΔCp of −1 kcal/mol would require burial of between 2000 and 3000 Å2 of hydrophobic surface area. Even more buried surface would be needed if we consider the concomitant need to bury at least some polar surface along with apolar surface. To put these values in perspective, a ΔCp of approximately −1 kcal/mol/K is on the order of that observed for the folding of small proteins. For example, cytochrome c, a 103 amino acid protein with a folding ΔCp of −1.3 kcal/mol, buries 5039 Å2 of apolar surface and 3726 Å2 of polar surface upon folding [Murphy and Freire, 1992]. While the very large TCR-pMHC binding heat capacity changes in Table 1 are provocative, it seems unlikely these can be attributed to changes in solvation resulting from small-scale conformational shifts in the antigen binding site or changes in domain orientation. It may be useful to consider other sources for large TCR-pMHC binding heat capacity changes such as linked equilibria, molecular strain, association/aggregation [Guinto and Di Cera, 1996, Jen-Jacobson et al., 2000, Prabhu and Sharp, 2005, Sturtevant, 1977], or as discussed below, the difficulties of measuring heat capacity changes for weak-to-moderate affinity interactions by van’t Hoff analysis, a point recently emphasized by Zhukov and Karlsson [Zhukov and Karlsson, 2007].
Indeed, when considering TCR-pMHC binding heat capacity changes, in all but one case the values have been determined by van’t Hoff analysis. As ΔCp is determined from the second derivative of ΔG° (or K) with respect to temperature, van’t Hoff heat capacity changes can vary with the exclusion of only a single data point or even a change in the error associated with a data point [Zhukov and Karlsson, 2007]. Given recent concerns regarding van’t Hoff enthalpies and the eventual attribution of discrepancies between van’t Hoff and calorimetric values to issues of data quality, statistics, and error analysis [Chaires, 1997, Horn et al., 2002, Horn et al., 2001, Mizoue and Tellinghuisen, 2004, Naghibi et al., 1995], van’t Hoff-determined heat capacity changes should be interpreted even more cautiously. At this time, calorimetrically measured heat capacity changes are available only for the A6-Tax/HLA-A2 interaction [Armstrong and Baker, 2007]. Notably, the calorimetric value of −330 cal/mol/K (uncorrected for linked protonation) is almost one-half of the van’t Hoff value of −560 cal/mol/K [Davis-Harrison et al., 2005] (although the agreement is closer when the influence of proton linkage is accounted for, this agreement is fortuitous as discussed in Armstrong and Baker, 2007).
Although direct assays of dynamics are needed to clearly gauge the flexibility of TCR CDR loops, thermodynamics may still provide further insight into conformational differences between free and bound TCRs, particularly if the conformational differences arise due to a pre-existing conformational equilibrium in the unbound receptor as hypothesized by Holler and Kranz and recently observed by James and Tawfik in the SPE7 antibody [Holler and Kranz, 2004, James et al., 2003, James and Tawfik, 2003]. As noted below, as a recognition mechanism distinct from induced-fit [Koshland, 1958], conformational selection from pre-existing equilibria have received much attention in recent years and can be traced back to the Monod, Wyman, and Changeux model of allosteric regulation [Monod et al., 1965].
Formally, we can describe a conformational selection binding reaction via the following scheme, where the horizontal reaction describes binding of pMHC to a binding competent state of a TCR (TCRc) and the vertical reaction describes a conformational equilibrium in the TCR between binding the competent state and at least one other binding incompetent state (termed TCRi). The terms Kb and are the equilibrium constant and enthalpy change for pMHC binding, and the terms Ki and are the equilibrium constant and enthalpy change for the TCR conformational shift (defined in the direction of TCRc to TCRi).
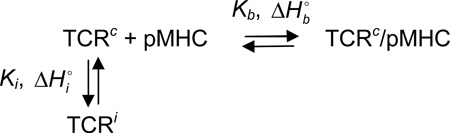 |
Taking into account the conformational equilibrium between TCRc and TCRi, the measured thermodynamics for pMHC binding the unligated TCR will be:
| (Eq. 1) |
| (Eq. 2) |
Equations 1 and 2 indicate that the observed affinity and binding enthalpy change are functions of not only the TCR-pMHC binding reaction, but also the TCRi to TCRc transition. If the temperature dependencies of these two processes differ, the result would be an observed binding enthalpy change that varies nonlinearly with temperature; i.e., a temperature dependent apparent heat capacity change1. The extent of this temperature dependence will depend upon the magnitude of the Ki equilibrium constant (i.e., how much of the TCR is incompetent vs. competent for binding pMHC) and the enthalpy and heat capacity changes associated with the conformational transition. If the conversion of TCRc to TCRi involves a significant conformational rearrangement, we would expect Ki to be greater than 1 (i.e., the binding competent state will not be overly dominant in the TCR conformational ensemble) and large values for . Provided sufficient enthalpy measurements are performed over a wide temperature range, the resulting nonlinearity in measurements of ΔH° vs. temperature may be detectable in calorimetric measurements. A complete analysis of the data according to the equations above could allow for a full characterization of the binding reaction, including the equilibrium constant and enthalpy/entropy changes of the transition between the binding incompetent and binding competent states of the TCR.
The scheme described above does not account for motions occurring upon binding after initial association. In its simplest form, this mechanism can be represented as:
where the bracketed term represents an initial encounter complex that isomerizes to a higher affinity, fully bound state. This is a classical “induced-fit” mechanism as hypothesized by Davis and colleagues in the “two-step” binding model for TCR recognition [Wu et al., 2002]. Recently Gakamsky and colleagues provided kinetic evidence for the operation of an induced-fit mechanism in TCR recognition of the pp65 peptide presented by HLA-A2 [Gakamsky et al., 2007]. Rapid kinetic experiments such as those employed by Gakamsky et al. can best identify the existence of such mechanisms in protein binding reactions, as thermodynamic measurements report only on the differences between the free and most stable bound states. Thus, the temperature-dependent thermodynamic studies described above could not rule out the presence of induced-fit binding. This highlights the importance of using complementary approaches to investigate binding, particularly in the study of conformational dynamics and its role in recognition. Importantly, a priori, there is no reason why conformational selection from a pre-existing equilibrium and induced-fit could not both be operating in any given TCR-pMHC interaction, particularly if conformational dynamics and structural changes are not limited to the TCR as noted below. Notably, James and Tawfik recently demonstrated that the SPE7 antibody can recognize some ligands through a combination of both mechanisms [James and Tawfik, 2005], and recent computational studies suggest such hybrid recognition mechanisms may be common in protein-protein interactions [Grunberg et al., 2004]. Several recent studies and reviews address pre-existing conformational equilibria and induced-fit in protein-protein interactions in more depth [Goh et al., 2004, Gunasekaran and Nussinov, 2007, James and Tawfik, 2003, Keskin, 2007, Kumar et al., 2000, Tobi and Bahar, 2005, Tsai et al., 1999].
Importantly, structural changes occurring upon TCR recognition of pMHC may not be confined to the T cell receptor. At least three studies have shown conformational differences in the peptide between the free and bound complex. While two of these are small conformational shifts [Garboczi et al., 1996, Lee et al., 2004], recognition of an extensively-bulged Epstein-Barr virus peptide presented by HLA-B35 by the ELS4 TCR results in a dramatic “flattening” of the peptide [Tynan et al., 2007]. Other structural studies have found peptides that adopt multiple conformations in MHC peptide binding groove or disordered peptide side chains or backbones that in some cases become ordered upon TCR binding [Dessen et al., 1997, Fremont et al., 2002, Gagnon et al., 2006, Hillig et al., 2001, Hulsmeyer et al., 2004, Kuhns et al., 1999, Sharma et al., 2001, Speir et al., 2001, Wucherpfennig, 2004]. Pohlman et al. directly observed significant conformational dynamics in a peptide presented by HLA-B*2709 [Pohlmann et al., 2004] that presumably are frozen out upon receptor binding. While it may be tempting to dismiss many of these peptide motions as inconsequential, Borbulevych et al. observed via both experiment and simulation that dynamics in a modified MART-1 peptide directly influence T cell recognition [Borbulevych et al., 2007]. Importantly, many of the peptide conformational changes seen in peptide/MHC structures are of similar magnitude to those observed for TCR CDR loops. Thus, conclusions that complex binding data (whether thermodynamic or kinetic) result from conformational changes occurring solely in the T cell receptor should be made cautiously in the absence of supporting structural information.
Thermodynamic comparisons among more closely related TCR-pMHC interactions
The wide range of binding enthalpy, entropy, and heat capacity changes seen in Table 1 and Figure 2 reflects the diversity in TCR-pMHC interactions, and indicates that broad comparisons between very different interactions provides little information beyond highlighting the differences. Comparisons between more closely related interactions, on the other hand, can be more revealing. Two studies have compared the recognition of the same pMHC ligand by different T cell receptors: recognition of the MBP1-11 peptide presented by the class II MHC I-Au by the 172.10 and 1934.4 TCRs [Garcia et al., 2001] and recognition of the Tax peptide presented by the class I MHC HLA-A2 by the A6 and B7 TCRs [Davis-Harrison et al., 2005]. Both studies found considerable differences in the binding thermodynamics, revealing that a given pMHC molecule does not dictate any one TCR recognition mechanism. Colf et al. found similar results in comparing recognition of different pMHC by the same TCR: recognition of the QL9 peptide presented by H-2Ld and the dEV8 peptide presented by H-2Kb by the 2C TCR proceeded with opposing thermodynamics [Colf et al., 2007, Krogsgaard et al., 2003], indicating that a given TCR can recognize different ligands via distinct thermodynamic mechanisms. Malissen and colleagues observed the same when comparing recognition of pBM1/H-2Kb and pBM8/H-2Kbm8 by the BM3.3 TCR [Mazza et al., 2007].
More detailed results are available from studies comparing recognition by the same TCR of related or modified peptides presented by the same MHC. The first such study by Krogsgaard et al. revealed that subtle modifications to the MCC peptide could have unpredictable thermodynamic consequences for recognition by the 2B4 TCR [Krogsgaard et al., 2003]. The most dramatic reported was an unprecedented −3 kcal/mol/K shift in ΔCp for a proline to phenylalanine substitution in a peptide variant (surprisingly, the changes in ΔS° and ΔH° were much more modest). These results were related to peptide immunological potency and the possibility of TCR flexibility and conformational change. In a second study, Lee et al. identified a modified HIV gag epitope incorporating a Phe→Tyr substitution that, although being recognized by the G10 TCR with binding thermodynamics almost identical to the native peptide, adopted a different structure in the unligated MHC molecule, HLA-A2 [Lee et al., 2004]. These results imply compensatory changes in the activation energetics for TCR association and dissociation, which were related to the timing of the peptide conformational change along the receptor binding pathway.
Miller et al. recently measured the thermodynamic consequences of the loss of a positive charge on the α1 helix in the interface between the AHIII TCR and the p1049 peptide presented by HLA-A2 [Miller et al., 2007]. Although complicated by the presence of a conformational shift in the CDR3β loop, the calorimetrically measured loss in binding enthalpy was consistent with the loss of hydrogen bonds within the TCR-pMHC interface, providing insight into the distribution of energy within the AHIII-p1049/HLA-A2 interface. The work of Miller et al. is a good example of the use of relative binding thermodynamics to dissect a TCR-pMHC interaction. In addition to providing insight into individual interfaces, the approach of measuring the thermodynamic consequences of small changes can also be used to guide the engineering of TCR-pMHC interfaces, perhaps through the introduction of favorable interactions, elimination of unfavorable interactions, or the biasing of conformational equilibria.
By van’t Hoff analysis, Ishizuka et al. recently examined the thermodynamic effects of 10 separate substitutions in the interface between the JM22 TCR and the influenza MP58–66 peptide presented by HLA-A2 [Ishizuka et al., 2008]. Although the thermodynamic measurements were not discussed in detail, the mutations all retain the overall thermodynamics of the wild-type interaction, perhaps not surprisingly as the mutants characterized all affected the binding free energy by ≤1 kcal/mol.
Finally, there is considerable interest in using thermodynamics to optimize affinity and specificity in drug design, perhaps the best published examples being inhibitors of HIV protease [Lafont et al., 2007, Ohtaka and Freire, 2005]. Similar approaches may be used in optimization of affinity or specificity in TCR-pMHC interactions, perhaps for generating altered peptides designed to activate certain T cell subsets or modifying T cell receptors to either direct immune responses against particular antigens or recognize antigens with high affinity for imaging or drug delivery purposes. Colf et al. have provided some initial data towards these goals, demonstrating that the m6 variant of the 2C TCR, generated via directed evolution [Holler et al., 2000], achieves an approximately 100-fold enhancement in binding affinity though entirely enthalpic gains, offset by a shift from a favorable binding entropy change to an unfavorable binding entropy change [Colf et al., 2007]. This result is in contrast with recent data indicating that the affinity maturation process can enhance antibody binding affinity by reducing the entropic cost for binding [Thorpe and Brooks, 2007, Zimmermann et al., 2006], presumably by pre-optimizing the antigen combining site towards the structure of the antigen. Thus thermodynamics may provide a means to guide the design of TCRs with enhanced affinity in a fashion that mimics that used naturally by the humoral immune system.
Summary
From the first measurements in 1999 [Willcox et al., 1999], the database of binding thermodynamics for TCR-pMHC interactions has grown to include 41 interactions as of this writing. Although early measurements suggested a thermodynamic “signature” for TCR recognition consisting of a favorable enthalpy change and an unfavorable entropy change, the collective data clearly indicate that this is not the case. Rather, the binding thermodynamics vary considerably, reflecting the diversity in TCRs, pMHCs, and their interfaces. There is insufficient data to distinguish recognition of class I from class II pMHC, although if the class I data are a guide, we might expect recognition of class II pMHC to vary as broadly as class I. Although early thermodynamic data were interpreted as indicating a need for TCR CDR loops to organize or “fold” upon recognition of pMHC, the accumulation of more thermodynamic and structural data have led to a more refined view, where although CDR loop adjustments may occur, and these most certainly contribute to TCR cross-reactivity, the adjustments are not always of similar magnitude and seem more likely to consist of more defined structural shifts rather than the ordering of highly flexible backbones.
The variation in binding thermodynamics highlights one of the most remarkable aspects of TCR-pMHC interactions: despite the diversity in the molecules and interfaces, the interactions proceed with similar structural topologies, and, for the majority of activating ligands that have been investigated thus far, similar affinities and kinetics. Whether this is due to selection mechanisms operating on a pre-selection repertoire [Buslepp et al., 2003, Huseby et al., 2006], a deeper self-recognition code not yet discerned from structural, physical, or genetic data [Feng et al., 2007], or some combination of both is still unclear. As individual interactions are probed in more detail, thermodynamic measurements will provide further insights into the molecular driving forces behind the remarkable molecular recognition properties of T cell receptors. As the field evolves, calorimetric experiments should be strongly encouraged over van’t Hoff measurements; new calorimeters with higher sensitivity and reduced sample requirements should facilitate this. As more probing experiments are performed, investigating and controlling for the influence of linked equilibria will be crucial. Application of other techniques such as rapid kinetics [Gakamsky et al., 2007], computational chemistry [Gagnon et al., 2005, Michielin and Karplus, 2002, Zoete and Michielin, 2007], and spectroscopic assays of loop dynamics in conjunction with thermodynamics and structural biology will be further illuminating.
Acknowledgments
We thank Olivier Michielin for the invitation, Oleg Borbulevych for analysis of TCR-pMHC structures, and Ed Collins for helpful comments. Supported by grant number R01GM067079 from NIGMS, NIH. FKI is supported by grant number T32GM075762 from NIGMS, NIH.
Abbreviations
- TCR
T cell receptor
- MHC
major histocompatibility complex
- pMHC
peptide/MHC complex
- CDR
complementarity determining region
Footnotes
References
- Anikeeva N, Lebedeva T, Krogsgaard M, Tetin SY, Martinez-Hackert E, Kalams SA, Davis MM, Sykulev Y. Distinct Molecular Mechanisms Account for the Specificity of Two Different T-Cell Receptors. Biochemistry. 2003;42:4709–4716. doi: 10.1021/bi026864+. [DOI] [PubMed] [Google Scholar]
- Armstrong KM, Baker BM. A Comprehensive Calorimetric Investigation of an Entropically Driven T Cell Receptor-Peptide/Major Histocompatibility Complex Interaction. Biophys. J. 2007;93:597–609. doi: 10.1529/biophysj.107.104570. [DOI] [PMC free article] [PubMed] [Google Scholar]
- Baker BM, Murphy KP. Evaluation of linked protonation effects in protein binding reactions using isothermal titration calorimetry. Biophys J. 1996;71:2049–2055. doi: 10.1016/S0006-3495(96)79403-1. [DOI] [PMC free article] [PubMed] [Google Scholar]
- Baker BM, Murphy KP. Dissecting the energetics of a protein-protein interaction: the binding of ovomucoid third domain to elastase. J Mol Biol. 1997;268:557–569. doi: 10.1006/jmbi.1997.0977. [DOI] [PubMed] [Google Scholar]
- Baker BM, Murphy KP. Prediction of binding energetics from structure using empirical parameterization. Methods Enzymol. 1998;295:294–315. doi: 10.1016/s0076-6879(98)95045-5. [DOI] [PubMed] [Google Scholar]
- Benzhuo Lu CFW. Direct estimation of entropy loss due to reduced translational and rotational motions upon molecular binding. Biopolymers. 2005;79:277–285. doi: 10.1002/bip.20344. [DOI] [PubMed] [Google Scholar]
- Bhardwaj V, Kumar V, Geysen HM, Sercarz EE. Degenerate recognition of a dissimilar antigenic peptide by myelin basic protein-reactive T cells. Implications for thymic education and autoimmunity. J Immunol. 1993;151:5000–5010. [PubMed] [Google Scholar]
- Boniface JJ, Reich Z, Lyons DS, Davis MM. Thermodynamics of T cell receptor binding to peptide-MHC: evidence for a general mechanism of molecular scanning. Proc Natl Acad Sci U S A. 1999;96:11446–11451. doi: 10.1073/pnas.96.20.11446. [DOI] [PMC free article] [PubMed] [Google Scholar]
- Borbulevych OY, Insaidoo FK, Baxter TK, Powell DJ, Jr, Johnson LA, Restifo NP, Baker BM. Structures of MART-1(26/27-35) Peptide/HLA-A2 Complexes Reveal a Remarkable Disconnect between Antigen Structural Homology and T Cell Recognition. J Mol Biol. 2007;372:1123–1136. doi: 10.1016/j.jmb.2007.07.025. [DOI] [PMC free article] [PubMed] [Google Scholar]
- Boulter Jonathan M, Schmitz N, Sewell Andrew K, Godkin Andrew J, Bachmann Martin F, Gallimore Awen M. Potent T cell agonism mediated by a very rapid TCR/pMHC interaction. European Journal of Immunology. 2007;37:798–806. doi: 10.1002/eji.200636743. [DOI] [PMC free article] [PubMed] [Google Scholar]
- Brady GP, Sharp KA. Entropy in protein folding and in protein--protein interactions. Current Opinion in Structural Biology. 1997;7:215–221. doi: 10.1016/s0959-440x(97)80028-0. [DOI] [PubMed] [Google Scholar]
- Buslepp J, Wang H, Biddison WE, Appella E, Collins EJ. A Correlation between TCR Va Docking on MHC and CD8 Dependence: Implications for T Cell Selection. Immunity. 2003;19:595–606. doi: 10.1016/s1074-7613(03)00269-3. [DOI] [PubMed] [Google Scholar]
- Chaires JB. Possible origin of differences between van't Hoff and calorimetric enthalpy estimates. Biophysical Chemistry. 1997;64:15–23. doi: 10.1016/s0301-4622(96)02205-3. [DOI] [PubMed] [Google Scholar]
- Chen J-L, Stewart-Jones G, Bossi G, Lissin NM, Wooldridge L, Choi EML, Held G, Dunbar PR, Esnouf RM, Sami M, Boulter JM, Rizkallah P, Renner C, Sewell A, van der Merwe PA, Jakobsen BK, Griffiths G, Jones EY, Cerundolo V. Structural and kinetic basis for heightened immunogenicity of T cell vaccines. J Exp Med. 2005;201:1243–1255. doi: 10.1084/jem.20042323. [DOI] [PMC free article] [PubMed] [Google Scholar]
- Colf LA, Bankovich AJ, Hanick NA, Bowerman NA, Jones LL, Kranz DM, Garcia KC. How a Single T Cell Receptor Recognizes Both Self and Foreign MHC. Cell. 2007;129:135–146. doi: 10.1016/j.cell.2007.01.048. [DOI] [PubMed] [Google Scholar]
- Cooper A, Johnson CM, Lakey JH, Nollmann M. Heat does not come in different colours: entropy-enthalpy compensation, free energy windows, quantum confinement, pressure perturbation calorimetry, solvation and the multiple causes of heat capacity effects in biomolecular interactions. Biophysical Chemistry. 2001;93:215–230. doi: 10.1016/s0301-4622(01)00222-8. [DOI] [PubMed] [Google Scholar]
- Davis-Harrison RL, Armstrong KM, Baker BM. Two Different T Cell Receptors use Different Thermodynamic Strategies to Recognize the Same Peptide/MHC Ligand. Journal of Molecular Biology. 2005;346:533–550. doi: 10.1016/j.jmb.2004.11.063. [DOI] [PubMed] [Google Scholar]
- Davis MM, Boniface JJ, Reich Z, Lyons D, Hampl J, Arden B, Chien Y. Ligand recognition by alpha beta T cell receptors. Annu Rev Immunol. 1998;16:523–544. doi: 10.1146/annurev.immunol.16.1.523. [DOI] [PubMed] [Google Scholar]
- Dessen A, Lawrence CM, Cupo S, Zaller DM, Wiley DC. X-ray crystal structure of HLA-DR4 (DRA*0101, DRB1*0401) complexed with a peptide from human collagen II. Immunity. 1997;7:473–481. doi: 10.1016/s1074-7613(00)80369-6. [DOI] [PubMed] [Google Scholar]
- Ding YH, Baker BM, Garboczi DN, Biddison WE, Wiley DC. Four A6-TCR/peptide/HLA-A2 structures that generate very different T cell signals are nearly identical. Immunity. 1999;11:45–56. doi: 10.1016/s1074-7613(00)80080-1. [DOI] [PubMed] [Google Scholar]
- Ely LK, Beddoe T, Clements CS, Matthews JM, Purcell AW, Kjer-Nielsen L, McCluskey J, Rossjohn J. Disparate thermodynamics governing T cell receptor-MHC-I interactions implicate extrinsic factors in guiding MHC restriction. PNAS. 2006;103:6641–6646. doi: 10.1073/pnas.0600743103. [DOI] [PMC free article] [PubMed] [Google Scholar]
- Evavold BD, Sloan-Lancaster J, Wilson KJ, Rothbard JB, Allen PM. Specific T cell recognition of minimally homologous peptides: evidence for multiple endogenous ligands. Immunity. 1995;2:655–663. doi: 10.1016/1074-7613(95)90010-1. [DOI] [PubMed] [Google Scholar]
- Fayos R, Melacini G, Newlon MG, Burns L, Scott JD, Jennings PA. Induction of Flexibility through Protein-Protein Interactions. J. Biol. Chem. 2003;278:18581–18587. doi: 10.1074/jbc.M300866200. [DOI] [PubMed] [Google Scholar]
- Feng D, Bond CJ, Ely LK, Maynard J, Garcia KC. Structural evidence for a germline-encoded T cell receptor-major histocompatibility complex interaction 'codon'. Nat Immunol. 2007;8:975–983. doi: 10.1038/ni1502. [DOI] [PubMed] [Google Scholar]
- Freire E. Thermal denaturation methods in the study of protein folding. Energetics of Biological Macromolecules. 1995;259:144–168. doi: 10.1016/0076-6879(95)59042-0. [DOI] [PubMed] [Google Scholar]
- Fremont DH, Dai S, Chiang H, Crawford F, Marrack P, Kappler J. Structural basis of cytochrome c presentation by IE(k) J Exp Med. 2002;195:1043–1052. doi: 10.1084/jem.20011971. [DOI] [PMC free article] [PubMed] [Google Scholar]
- Gagnon SJ, Borbulevych OY, Davis-Harrison RL, Baxter TK, Clemens JR, Armstrong KM, Turner RV, Damirjian M, Biddison WE, Baker BM. Unraveling a Hotspot for TCR Recognition on HLA-A2: Evidence Against the Existence of Peptide-independent TCR Binding Determinants. Journal of Molecular Biology. 2005;353:556. doi: 10.1016/j.jmb.2005.08.024. [DOI] [PubMed] [Google Scholar]
- Gagnon SJ, Borbulevych OY, Davis-Harrison RL, Turner RV, Damirjian M, Wojnarowicz A, Biddison WE, Baker BM. T Cell Receptor Recognition via Cooperative Conformational Plasticity. Journal of Molecular Biology. 2006;363:228–243. doi: 10.1016/j.jmb.2006.08.045. [DOI] [PubMed] [Google Scholar]
- Gakamsky DM, Lewitzki E, Grell E, Saulquin X, Malissen B, Montero-Julian F, Bonneville M, Pecht I. Kinetic evidence for a ligand-binding-induced conformational transition in the T cell receptor. Proceedings of the National Academy of Sciences. 2007:0707061104. doi: 10.1073/pnas.0707061104. [DOI] [PMC free article] [PubMed] [Google Scholar]
- Garboczi DN, Ghosh P, Utz U, Fan QR, Biddison WE, Wiley DC. Structure of the complex between human T-cell receptor, viral peptide and HLA-A2. Nature. 1996;384:134–141. doi: 10.1038/384134a0. [DOI] [PubMed] [Google Scholar]
- Garcia KC, Adams EJ. How the T cell receptor sees antigen - A structural view. Cell. 2005;122:333–336. doi: 10.1016/j.cell.2005.07.015. [DOI] [PubMed] [Google Scholar]
- Garcia KC, Degano M, Pease LR, Huang M, Peterson PA, Teyton L, Wilson IA. Structural basis of plasticity in T cell receptor recognition of a self peptide-MHC antigen. Science. 1998;279:1166–1172. doi: 10.1126/science.279.5354.1166. [DOI] [PubMed] [Google Scholar]
- Garcia KC, Degano M, Stanfield RL, Brunmark A, Jackson MR, Peterson PA, Teyton L, Wilson IA. An alphabeta T cell receptor structure at 2.5 A and its orientation in the TCR-MHC complex [see comments] Science. 1996;274:209–219. doi: 10.1126/science.274.5285.209. [DOI] [PubMed] [Google Scholar]
- Garcia KC, Radu CG, Ho J, Ober RJ, Ward ES. Kinetics and thermodynamics of T cell receptor- autoantigen interactions in murine experimental autoimmune encephalomyelitis. PNAS. 2001;98:6818–6823. doi: 10.1073/pnas.111161198. [DOI] [PMC free article] [PubMed] [Google Scholar]
- Goh C-S, Milburn D, Gerstein M. Conformational changes associated with protein-protein interactions. Current Opinion in Structural Biology. 2004;14:104–109. doi: 10.1016/j.sbi.2004.01.005. [DOI] [PubMed] [Google Scholar]
- Grunberg R, Leckner J, Nilges M. Complementarity of Structure Ensembles in Protein-Protein Binding. Structure. 2004;12:2125–2136. doi: 10.1016/j.str.2004.09.014. [DOI] [PubMed] [Google Scholar]
- Grunberg R, Nilges M, Leckner J. Flexibility and conformational entropy in protein-protein binding. Structure. 2006;14:683–693. doi: 10.1016/j.str.2006.01.014. [DOI] [PubMed] [Google Scholar]
- Guinto ER, Di Cera E. Large Heat Capacity Change in a Protein-Monovalent Cation Interaction. Biochemistry. 1996;35:8800–8804. doi: 10.1021/bi9608828. [DOI] [PubMed] [Google Scholar]
- Gunasekaran K, Nussinov R. How Different are Structurally Flexible and Rigid Binding Sites? Sequence and Structural Features Discriminating Proteins that Do and Do not Undergo Conformational Change upon Ligand Binding. Journal of Molecular Biology. 2007;365:257–273. doi: 10.1016/j.jmb.2006.09.062. [DOI] [PubMed] [Google Scholar]
- Hare BJ, Wyss DF, Osburne MS, Kern PS, Reinherz EL, Wagner G. Structure, specificity and CDR mobility of a class II restricted single-chain T-cell receptor. Nat Struct Biol. 1999;6:574–581. doi: 10.1038/9359. [DOI] [PubMed] [Google Scholar]
- Hausmann S, Biddison WE, Smith KJ, Ding YH, Garboczi DN, Utz U, Wiley DC, Wucherpfennig KW. Peptide recognition by two HLA-A2/Tax11-19-specific T cell clones in relationship to their MHC/peptide/TCR crystal structures. J Immunol. 1999;162:5389–5397. [PubMed] [Google Scholar]
- Henriques D, Ladbury J, Jackson R. Comparison of binding energies of SrcSH2-phosphotyrosyl peptides with structure-based prediction using surface area based empirical parameterization [In Process Citation] Protein Sci. 2000;9:1975–1985. doi: 10.1110/ps.9.10.1975. [DOI] [PMC free article] [PubMed] [Google Scholar]
- Hillig RC, Coulie PG, Stroobant V, Saenger W, Ziegler A, Hulsmeyer M. High-resolution structure of HLA-A*0201 in complex with a tumour-specific antigenic peptide encoded by the MAGE-A4 gene. J Mol Biol. 2001;310:1167–1176. doi: 10.1006/jmbi.2001.4816. [DOI] [PubMed] [Google Scholar]
- Holler PD, Chlewicki LK, Kranz DM. TCRs with high affinity for foreign pMHC show self-reactivity. Nat Immunol. 2003;4:55–62. doi: 10.1038/ni863. [DOI] [PubMed] [Google Scholar]
- Holler PD, Holman PO, Shusta EV, O'Herrin S, Wittrup KD, Kranz DM. In vitro evolution of a T cell receptor with high affinity for peptide/MHC. Proc Natl Acad Sci U S A. 2000;97:5387–5392. doi: 10.1073/pnas.080078297. [DOI] [PMC free article] [PubMed] [Google Scholar]
- Holler PD, Kranz DM. T cell receptors: affinities, cross-reactivities, and a conformer model. Molecular Immunology. 2004;40:1027–1031. doi: 10.1016/j.molimm.2003.11.013. [DOI] [PubMed] [Google Scholar]
- Horn JR, Brandts JF, Murphy KP. van't Hoff and calorimetric enthalpies II: effects of linked equilibria. Biochemistry. 2002;41:7501–7507. doi: 10.1021/bi025626b. [DOI] [PubMed] [Google Scholar]
- Horn JR, Russell D, Lewis EA, Murphy KP. Van't Hoff and calorimetric enthalpies from isothermal titration calorimetry: are there significant discrepancies? Biochemistry. 2001;40:1774–1778. doi: 10.1021/bi002408e. [DOI] [PubMed] [Google Scholar]
- Hulsmeyer M, Fiorillo MT, Bettosini F, Sorrentino R, Saenger W, Ziegler A, Uchanska-Ziegler B. Dual, HLA-B27 Subtype-dependent Conformation of a Self-peptide. J Exp Med. 2004;199:271–281. doi: 10.1084/jem.20031690. [DOI] [PMC free article] [PubMed] [Google Scholar]
- Huseby ES, Crawford F, White J, Marrack P, Kappler JW. Interface-disrupting amino acids establish specificity between T cell receptors and complexes of major histocompatibility complex and peptide. Nat Immunol. 2006;7:1191–1199. doi: 10.1038/ni1401. [DOI] [PubMed] [Google Scholar]
- Ishizuka J, Stewart-Jones GBE, van der Merwe A, Bell JI, McMichael AJ, Jones EY. The Structural Dynamics and Energetics of an Immunodominant T Cell Receptor Are Programmed by Its V[beta] Domain. Immunity. 2008;28:171–182. doi: 10.1016/j.immuni.2007.12.018. [DOI] [PubMed] [Google Scholar]
- James LC, Roversi P, Tawfik DS. Antibody Multispecificity Mediated by Conformational Diversity. Science. 2003;299:1362–1367. doi: 10.1126/science.1079731. [DOI] [PubMed] [Google Scholar]
- James LC, Tawfik DS. Conformational diversity and protein evolution--a 60-year-old hypothesis revisited. Trends Biochem Sci. 2003;28:361–368. doi: 10.1016/S0968-0004(03)00135-X. [DOI] [PubMed] [Google Scholar]
- James LC, Tawfik DS. Structure and kinetics of a transient antibody binding intermediate reveal a kinetic discrimination mechanism in antigen recognition. PNAS. 2005;102:12730–12735. doi: 10.1073/pnas.0500909102. [DOI] [PMC free article] [PubMed] [Google Scholar]
- Janin J. The kinetics of protein-protein recognition. Proteins. 1997;28:153–161. doi: 10.1002/(sici)1097-0134(199706)28:2<153::aid-prot4>3.0.co;2-g. [DOI] [PubMed] [Google Scholar]
- Jen-Jacobson L, Engler LE, Jacobson LA. Structural and Thermodynamic Strategies for Site-Specific DNA Binding Proteins. Structure. 2000;8:1015–1023. doi: 10.1016/s0969-2126(00)00501-3. [DOI] [PubMed] [Google Scholar]
- Keskin O. Binding induced conformational changes of proteins correlate with their intrinsic fluctuations: a case study of antibodies. BMC Structural Biology. 2007;7:1–11. doi: 10.1186/1472-6807-7-31. [DOI] [PMC free article] [PubMed] [Google Scholar]
- Koshland DE. Application of a Theory of Enzyme Specificity to Protein Synthesis. Proceedings of the National Academy of Sciences. 1958;44:98–104. doi: 10.1073/pnas.44.2.98. [DOI] [PMC free article] [PubMed] [Google Scholar]
- Krogsgaard M, Prado N, Adams EJ, He X, Chow DC, Wilson DB, Garcia KC, Davis MM. Evidence that Structural Rearrangements and/or Flexibility during TCR Binding Can Contribute to T Cell Activation. Mol Cell. 2003;12:1367–1378. doi: 10.1016/s1097-2765(03)00474-x. [DOI] [PubMed] [Google Scholar]
- Kuhns JJ, Batalia MA, Yan S, Collins EJ. Poor binding of a HER-2/neu epitope (GP2) to HLA-A2.1 is due to a lack of interactions with the center of the peptide. J Biol Chem. 1999;274:36422–36427. doi: 10.1074/jbc.274.51.36422. [DOI] [PubMed] [Google Scholar]
- Kumar S, Ma B, Tsai CJ, Sinha N, Nussinov R. Folding and binding cascades: dynamic landscapes and population shifts. Protein Sci. 2000;9:10–19. doi: 10.1110/ps.9.1.10. [DOI] [PMC free article] [PubMed] [Google Scholar]
- Lafont V, Armstrong AA, Ohtaka H, Kiso Y, Mario Amzel L, Freire E. Compensating Enthalpic and Entropic Changes Hinder Binding Affinity Optimization. Chemical Biology & Drug Design. 2007;69:413–422. doi: 10.1111/j.1747-0285.2007.00519.x. [DOI] [PubMed] [Google Scholar]
- Lee JK, Stewart-Jones G, Dong T, Harlos K, Di Gleria K, Dorrell L, Douek DC, van der Merwe PA, Jones EY, McMichael AJ. T Cell Cross-Reactivity and Conformational Changes during TCR Engagement. J Exp Med. 2004;200:1455–1466. doi: 10.1084/jem.20041251. [DOI] [PMC free article] [PubMed] [Google Scholar]
- Mason D. A very high level of crossreactivity is an essential feature of the T-cell receptor. Immunology Today. 1998;19:395–404. doi: 10.1016/s0167-5699(98)01299-7. [DOI] [PubMed] [Google Scholar]
- Matsui K, Boniface JJ, Steffner P, Reay PA, Davis MM. Kinetics of T-cell receptor binding to peptide/I-Ek complexes: correlation of the dissociation rate with T-cell responsiveness. Proc Natl Acad Sci U S A. 1994;91:12862–12866. doi: 10.1073/pnas.91.26.12862. [DOI] [PMC free article] [PubMed] [Google Scholar]
- Mazza C, Auphan-Anezin N, Gregoire C, Guimezanes A, Kellenberger C, Roussel A, Kearney A, van der Merwe PA, Schmitt-Verhulst AM, Malissen B. How much can a T-cell antigen receptor adapt to structurally distinct antigenic peptides? EMBO J. 2007;26:1972–1983. doi: 10.1038/sj.emboj.7601605. [DOI] [PMC free article] [PubMed] [Google Scholar]
- McBeth C, Seamons A, Pizarro JC, Fleishman SJ, Baker D, Kortemme T, Goverman JM, Strong RK. A New Twist in TCR Diversity Revealed by a Forbidden [alpha][beta] TCR. Journal of Molecular Biology. 2008;375:1306–1319. doi: 10.1016/j.jmb.2007.11.020. [DOI] [PMC free article] [PubMed] [Google Scholar]
- McKeithan TW. Kinetic proofreading in T-cell receptor signal transduction. Proc Natl Acad Sci U S A. 1995;92:5042–5046. doi: 10.1073/pnas.92.11.5042. [DOI] [PMC free article] [PubMed] [Google Scholar]
- Michielin O, Karplus M. Binding Free Energy Differences in a TCR-Peptide-MHC Complex Induced by a Peptide Mutation: A Simulation Analysis. Journal of Molecular Biology. 2002;324:547–569. doi: 10.1016/s0022-2836(02)00880-x. [DOI] [PubMed] [Google Scholar]
- Miller PJ, Pazy Y, Conti B, Riddle D, Appella E, Collins EJ. Single MHC mutation eliminates enthalpy associated with T cell receptor binding. J Mol Biol. 2007;373:315–327. doi: 10.1016/j.jmb.2007.07.028. [DOI] [PMC free article] [PubMed] [Google Scholar]
- Mizoue LS, Tellinghuisen J. Calorimetric vs. van't Hoff binding enthalpies from isothermal titration calorimetry: Ba2+-crown ether complexation. Biophysical Chemistry. 2004;110:15–24. doi: 10.1016/j.bpc.2003.12.011. [DOI] [PubMed] [Google Scholar]
- Monod J, Wyman J, Changeux JP. On the Nature of Allosteric Transitions: A Plausible Model. J Mol Biol. 1965;12:88–118. doi: 10.1016/s0022-2836(65)80285-6. [DOI] [PubMed] [Google Scholar]
- Murphy KP, Freire E. Thermodynamics of structural stability and cooperative folding behavior in proteins. Adv Protein Chem. 1992;43:313–361. doi: 10.1016/s0065-3233(08)60556-2. [DOI] [PubMed] [Google Scholar]
- Murphy KP, Gill SJ. Solid model compounds and the thermodynamics of protein unfolding. J Mol Biol. 1991;222:699–709. doi: 10.1016/0022-2836(91)90506-2. [DOI] [PubMed] [Google Scholar]
- Naghibi H, Tamura A, Sturtevant JM. Significant Discrepancies Between van't Hoff and Calorimetric Enthalpies. Proceedings of the National Academy of Sciences. 1995;92:5597–5599. doi: 10.1073/pnas.92.12.5597. [DOI] [PMC free article] [PubMed] [Google Scholar]
- Ohtaka H, Freire E. Adaptive inhibitors of the HIV-1 protease. Progress in Biophysics and Molecular Biology. 2005;88:193–208. doi: 10.1016/j.pbiomolbio.2004.07.005. [DOI] [PubMed] [Google Scholar]
- Pohlmann T, Bockmann RA, Grubmuller H, Uchanska-Ziegler B, Ziegler A, Alexiev U. Differential peptide dynamics is linked to MHC polymorphism. J. Biol. Chem. 2004;279:28197–28201. doi: 10.1074/jbc.C400128200. [DOI] [PubMed] [Google Scholar]
- Prabhu NV, Sharp KA. HEAT CAPACITY IN PROTEINS. Annual Review of Physical Chemistry. 2005;56:521–548. doi: 10.1146/annurev.physchem.56.092503.141202. [DOI] [PubMed] [Google Scholar]
- Reiser JB, Darnault C, Gregoire C, Mosser T, Mazza G, Kearney A, van der Merwe PA, Fontecilla-Camps JC, Housset D, Malissen B. CDR3 loop flexibility contributes to the degeneracy of TCR recognition. Nat Immunol. 2003;4:241–247. doi: 10.1038/ni891. [DOI] [PubMed] [Google Scholar]
- Reiser JB, Gregoire C, Darnault C, Mosser T, Guimezanes A, Schmitt-Verhulst AM, Fontecilla-Camps JC, Mazza G, Malissen B, Housset D. A T cell receptor CDR3beta loop undergoes conformational changes of unprecedented magnitude upon binding to a peptide/MHC class I complex. Immunity. 2002;16:345–354. doi: 10.1016/s1074-7613(02)00288-1. [DOI] [PubMed] [Google Scholar]
- Rosette C, Werlen G, Daniels MA, Holman PO, Alam SM, Travers PJ, Gascoigne NRJ, Palmer E, Jameson SC. The Impact of Duration versus Extent of TCR Occupancy on T Cell Activation: A Revision of the Kinetic Proofreading Model. Immunity. 2001;15:59–70. doi: 10.1016/s1074-7613(01)00173-x. [DOI] [PubMed] [Google Scholar]
- Rudolph MG, Stanfield RL, Wilson IA. How TCRs Bind MHCs, Peptides, and Coreceptors. Annu Rev Immunol. 2006;24:419–466. doi: 10.1146/annurev.immunol.23.021704.115658. [DOI] [PubMed] [Google Scholar]
- Sharma AK, Kuhns JJ, Yan S, Friedline RH, Long B, Tisch R, Collins EJ. Class I Major Histocompatibility Complex Anchor Substitutions Alter the Conformation of T Cell Receptor Contacts. J. Biol. Chem. 2001;276:21443–21449. doi: 10.1074/jbc.M010791200. [DOI] [PubMed] [Google Scholar]
- Sharp K. Entropy--enthalpy compensation: Fact or artifact? Protein Sci. 2001;10:661–667. doi: 10.1110/ps.37801. [DOI] [PMC free article] [PubMed] [Google Scholar]
- Speir JA, Stevens J, Joly E, Butcher GW, Wilson IA. Two different, highly exposed, bulged structures for an unusually long peptide bound to rat MHC class I RT1-Aa. Immunity. 2001;14:81–92. doi: 10.1016/s1074-7613(01)00091-7. [DOI] [PubMed] [Google Scholar]
- Spolar RS, Livingstone JR, Record MT. Use of liquid hydrocarbon and amide transfer data to estimate contributions to thermodynamic functions of protein folding from the removal of nonpolar and polar surface from water. Biochemistry. 1992;31:3947–3955. doi: 10.1021/bi00131a009. [DOI] [PubMed] [Google Scholar]
- Spolar RS, Record MT., Jr Coupling of local folding to site-specific binding of proteins to DNA. Science. 1994;263:777–784. doi: 10.1126/science.8303294. [DOI] [PubMed] [Google Scholar]
- Stewart-Jones GB, McMichael AJ, Bell JI, Stuart DI, Jones EY. A structural basis for immunodominant human T cell receptor recognition. Nat Immunol. 2003;4:657–663. doi: 10.1038/ni942. [DOI] [PubMed] [Google Scholar]
- Stites WE. Protein-Protein Interactions: Interface Structure, Binding Thermodynamics, and Mutational Analysis. Chem. Rev. 1997;97:1233–1250. doi: 10.1021/cr960387h. [DOI] [PubMed] [Google Scholar]
- Sturtevant JM. Heat capacity and entropy changes in processes involving proteins. Proc Natl Acad Sci U S A. 1977;74:2236–2240. doi: 10.1073/pnas.74.6.2236. [DOI] [PMC free article] [PubMed] [Google Scholar]
- Tellinghuisen J. Isothermal titration calorimetry at very low c. Analytical Biochemistry. 2008;373:395–397. doi: 10.1016/j.ab.2007.08.039. [DOI] [PubMed] [Google Scholar]
- Thorpe IF, Brooks CL., 3rd Molecular evolution of affinity and flexibility in the immune system. Proc Natl Acad Sci U S A. 2007;104:8821–8826. doi: 10.1073/pnas.0610064104. [DOI] [PMC free article] [PubMed] [Google Scholar]
- Tian S, Maile R, Collins EJ, Frelinger JA. CD8+ T Cell Activation Is Governed by TCR-Peptide/MHC Affinity, Not Dissociation Rate. J Immunol. 2007;179:2952–2960. doi: 10.4049/jimmunol.179.5.2952. [DOI] [PubMed] [Google Scholar]
- Tobi D, Bahar I. Structural changes involved in protein binding correlate with intrinsic motions of proteins in the unbound state. Proceedings of the National Academy of Sciences. 2005;102:18908–18913. doi: 10.1073/pnas.0507603102. [DOI] [PMC free article] [PubMed] [Google Scholar]
- Tsai C, Kumar S, Ma B, Nussinov R. Folding funnels, binding funnels, and protein function. Protein Sci. 1999;8:1181–1190. doi: 10.1110/ps.8.6.1181. [DOI] [PMC free article] [PubMed] [Google Scholar]
- Tynan FE, Reid HH, Kjer-Nielsen L, Miles JJ, Wilce MCJ, Kostenko L, Borg NA, Williamson NA, Beddoe T, Purcell AW, Burrows SR, McCluskey J, Rossjohn J. A T cell receptor flattens a bulged antigenic peptide presented by a major histocompatibility complex class I molecule. Nat Immunol. 2007;8:268–276. doi: 10.1038/ni1432. [DOI] [PubMed] [Google Scholar]
- Vijayakumar M, Wong K-Y, Schreiber G, Fersht AR, Szabo A, Zhou H-X. Electrostatic enhancement of diffusion-controlled protein-protein association: comparison of theory and experiment on barnase and barstar1. Journal of Molecular Biology. 1998;278:1015–1024. doi: 10.1006/jmbi.1998.1747. [DOI] [PubMed] [Google Scholar]
- Weber KS, Donermeyer DL, Allen PM, Kranz DM. Class II-restricted T cell receptor engineered in vitro for higher affinity retains peptide specificity and function. PNAS. 2005;102:19033–19038. doi: 10.1073/pnas.0507554102. [DOI] [PMC free article] [PubMed] [Google Scholar]
- Willcox BE, Gao GF, Wyer JR, Ladbury JE, Bell JI, Jakobsen BK, van der Merwe PA. TCR binding to peptide-MHC stabilizes a flexible recognition interface. Immunity. 1999;10:357–365. doi: 10.1016/s1074-7613(00)80035-7. [DOI] [PubMed] [Google Scholar]
- Wiseman T, Williston S, Brandts JF, Lin L-N. Rapid measurement of binding constants and heats of binding using a new titration calorimeter. Analytical Biochemistry. 1989;179:131–137. doi: 10.1016/0003-2697(89)90213-3. [DOI] [PubMed] [Google Scholar]
- Wu LC, Tuot DS, Lyons DS, Garcia KC, Davis MM. Two-step binding mechanism for T-cell receptor recognition of peptide MHC. Nature. 2002;418:552–556. doi: 10.1038/nature00920. [DOI] [PubMed] [Google Scholar]
- Wucherpfennig KW. Presentation of a self-peptide in two distinct conformations by a disease-associated HLA-B27 subtype. J Exp Med. 2004;199:151–154. doi: 10.1084/jem.20032050. [DOI] [PMC free article] [PubMed] [Google Scholar]
- Wucherpfennig KW, Allen PM, Celada F, Cohen IR, De Boer R, Garcia KC, Goldstein B, Greenspan R, Hafler D, Hodgkin P, Huseby ES, Krakauer DC, Nemazee D, Perelson AS, Pinilla C, Strong RK, Sercarz EE. Polyspecificity of T cell and B cell receptor recognition. Seminars in Immunology. 2007;19:216–224. doi: 10.1016/j.smim.2007.02.012. [DOI] [PMC free article] [PubMed] [Google Scholar]
- Wucherpfennig KW, Strominger JL. Molecular mimicry in T cell-mediated autoimmunity: viral peptides activate human T cell clones specific for myelin basic protein. Cell. 1995;80:695–705. doi: 10.1016/0092-8674(95)90348-8. [DOI] [PMC free article] [PubMed] [Google Scholar]
- Zhukov A, Karlsson R. Statistical aspects of van't Hoff analysis: a simulation study. Journal of molecular recognition. 2007;20:379–385. doi: 10.1002/jmr.845. [DOI] [PubMed] [Google Scholar]
- Zidek L, Novotny MV, Stone MJ. Increased protein backbone conformational entropy upon hydrophobic ligand binding. Nature Structural Biology. 1999;6:1118–1121. doi: 10.1038/70057. [DOI] [PubMed] [Google Scholar]
- Zimmermann J, Oakman EL, Thorpe IF, Shi X, Abbyad P, Brooks CL, 3rd, Boxer SG, Romesberg FE. Antibody evolution constrains conformational heterogeneity by tailoring protein dynamics. Proc Natl Acad Sci U S A. 2006;103:13722–13727. doi: 10.1073/pnas.0603282103. [DOI] [PMC free article] [PubMed] [Google Scholar]
- Zoete V, Michielin O. Comparison between computational alanine scanning and per-residue binding free energy decomposition for protein-protein association using MM-GBSA: Application to the TCR-p-MHC complex. Proteins: Structure, Function, and Bioinformatics. 2007;67:1026–1047. doi: 10.1002/prot.21395. [DOI] [PubMed] [Google Scholar]