

Abstract
Previous neuroimaging research has documented that patterns of intrinsic (resting-state) functional connectivity (FC) among brain regions covary with individual measures of cognitive performance. Here, we examined the relation between intrinsic FC and a reaction time (RT) measure of performance, as a function of both age group and task demands. We obtained filtered, event-related functional magnetic resonance imaging (fMRI) data, and RT measures of visual search performance, from 21 younger adults (19–29 years) and 21 healthy, older adults (60–87 years). Age-related decline occurred in the connectivity strength in multiple brain regions, consistent with previous findings. Among eight pairs of regions, across somatomotor, orbitofrontal, and subcortical networks, increasing FC was associated with faster responding (lower RT). Relative to younger adults, older adults exhibited a lower strength of this RT-connectivity relation and greater disruption of this relation by a salient but irrelevant display item (color singleton distractor). Age-related differences in the covariation of intrinsic FC and cognitive performance vary as a function of task demands.
Keywords: brain connectivity, fMRI, resting state, default mode, behavior-based connectivity analysis, aging, attention, cognition, visual search, reaction time
1. Introduction
Event-related functional magnetic resonance imaging (fMRI) studies measure the brain activation associated with a behavioral task by contrasting the blood-oxygen-level-dependent (BOLD) signal during on-task periods with the BOLD signal during a baseline or control condition. Over the past decade, researchers have directed increased attention to the baseline activity of the brain that can be measured without requiring participants to perform a perceptual or behavioral task. During an awake but resting state, spontaneous, low-frequency (less than 0.08 Hz) fluctuations in the BOLD signal occur that are temporally coherent among spatially distinct brain regions (Biswal, et al., 1995). The inter-regional temporal correlations, referred to as intrinsic functional connectivity (FC) represent neuronal activity that is intrinsically generated by the brain (Shmuel and Leopold, 2008, Shmuel, et al., 2002). Reliable measures of intrinsic FC can be obtained both from “pure” resting-state periods (i.e., those without a behavioral task) and from task-related BOLD data in which the higher frequency temporal components have been attenuated (Fair, et al., 2007, Van Dijk, et al., 2010).
Using either pre-defined regions of interest (Biswal, et al., 1995, Greicius, et al., 2003) or whole-brain methods such as independent component analysis (Esposito, et al., 2008, Greicius, et al., 2004, McKeown, et al., 1998), researchers have identified a default mode network (DMN), which includes a set of brain regions (in particular, medial prefrontal, posterior cingulate, lateral parietal, and parahippocampal cortex) that consistently show highly correlated brain activity during resting state and a reduced level of task-related activation, with BOLD signal level often below baseline, across a wide range of tasks (Biswal, et al., 2010, Buckner, et al., 2008, Fox and Raichle, 2007, Greicius, et al., 2003, Raichle and Snyder, 2007, van den Heuvel and Hulshoff Pol, 2010). Other networks of brain regions, however, outside of the default mode network, also exhibit coherent intrinsic connectivity, and these networks appear to support specific domains of cognitive performance (Allen, et al., 2011, Anderson, et al., 2011, Dosenbach, et al., 2007, Fox, et al., 2007, Laird, et al., 2011, Vincent, et al., 2008). For example, Salvador et al. (2005) used hierarchical clustering to analyze resting-state data and obtained six large clusters corresponding approximately to four neo-cortical systems, plus temporal lobe and subcortical systems. A recent, seminal study by Yeo et al. (2011) characterized the organization of large-scale distributed networks, based on analyses of resting-state data from 1,000 healthy, young adults. These authors applied clustering algorithms to the resting-state data that yielded either 7 or 17 networks of functionally connected regions, depending on the level of resolution. Resting-state network structure is constrained by anatomical connectivity (Damoiseaux and Greicius, 2009, He, et al., 2012, Ystad, et al., 2011), and aspects of intrinsic FC may be predictive of specific forms of neurodegenerative disease (Bano, et al., 2011, Greicius, et al., 2004, Hafkemeijer, et al., 2012, Hedden, et al., 2009, Zhou, et al., 2012).
In this experiment, we investigated age-related differences in intrinsic FC for healthy, community-dwelling adults. Research on aging and the brain has focused primarily on atrophy and related tissue-integrity measures from structural imaging (Fjell and Walhovd, 2010, Madden, et al., 2012, Raz, 2005, Salat, 2011) and task-related cortical activation from functional imaging (Dennis and Cabeza, 2008, Grady, 2008). Recent studies have also demonstrated that age-related differences in cognitive performance (typically, worse performance by older adults) are associated with the balance in the overall level of activity in the DMN relative to one or more task-related networks (Grady, et al., 2012, Grady, et al., 2010, Lustig, et al., 2003, Park, et al., 2010). The degree of intrinsic FC, both within the DMN and within other resting-state networks, exhibits age-related differences, predominantly decreased connectivity strength for older adults relative to younger adults (Allen, et al., 2011, Andrews-Hanna, et al., 2007, Biswal, et al., 2010, Damoiseaux, et al., 2008, Ferreira and Busatto, 2013, Meier, et al., 2012a, Tomasi and Volkow, 2012). For younger adults, an increasing degree of intrinsic FC, either within the DMN or within other, task-relevant networks, is generally associated with better cognitive performance (Baldassarre, et al., 2012, Meier, et al., 2012b, Seeley, et al., 2007). This principle holds true for older adults also (Andrews-Hanna, et al., 2007, Campbell, et al., 2012, Chen, et al., 2009, Dong, et al., 2012), but few direct assessments have been conducted of potential differences between younger and older adults in the relation between intrinsic FC and cognitive performance.
This research extends previous work by Chen et al. (2009), who developed a whole-brain, behavior-based connectivity analysis (BBCA) to identify sets of regions whose level of intrinsic FC covaries with behavioral performance. The BBCA method integrates behavioral data at an early stage of processing and evaluates the covariation between performance and intrinsic FC between regions across the complete data set, without a priori selection. Thus, rather than relating a behavioral measure to FC from a pre-defined network or seed region (Andrews-Hanna, et al., 2007, Campbell, et al., 2012, Meier, et al., 2012b), BBCA identifies all pairs of regions whose connectivity covaries with the behavioral measure, regardless of whether the regions are located within the same or different networks.
Chen et al. (2009) found that a widely distributed group of regions, comprised primarily of orbitofrontal regions, exhibited intrinsic FC that covaried with one measure of perceptual motor speed, choice reaction time (RT), but that the relation between RT and connectivity varied significantly across two adult age groups: The older adults, but not the younger adults, exhibited significantly increased FC in relation to faster responses (i.e., a negative correlation between RT and connectivity). Further, within the older adult group, individual differences in FC accounted for 87% of the variance in RT associated with age, suggesting that FC of these regions has an important role in age-related cognitive slowing.
The outcome measure in the BBCA analysis of Chen et al. (2009) was a single measure of elementary perceptual speed (choice RT). Other previous studies of age-related differences in the connectivity-performance relation have also relied on a univariate measure of cognitive performance (Andrews-Hanna, et al., 2007, Dong, et al., 2012)but cf. (Campbell, et al., 2012, Grady, et al., 2012, Grady, et al., 2010). In the present study, we sought to extend these previous findings by using BBCA to investigate age-related differences in the connectivity-performance relation, in the context of task-dependent changes in RT. Specifically, we sought to identify age-related differences in the relation between intrinsic FC and RT, across different task conditions involving visual search for a target shape among non-target (distractor) shapes. Behavioral studies of visual search and discrimination tasks have demonstrated that age-related decline occurs in some aspects of the information processing mechanisms underlying visual search, particularly those related to the efficiency of perceptual encoding and motor control (Hommel, et al., 2004, Madden, et al., 1999, Madden and Whiting, 2004, McAvinue, et al., 2012). Other aspects of visual search performance, however, related to the ability to guide visual search based on task goals and context (i.e., top-down attention) demonstrate substantial preservation as a function of adult age (Madden, 2007, Madden, et al., 2007). In this experiment, we sought to examine whether we could detect variations in the relation between intrinsic FC and RT, in relation to both age group and the task demands of visual search.
We investigated a form of visual search in which target detection is typically highly efficient, a feature search task in which the target is always a shape that is different from all of the distractor shapes (e.g., search for a vertical bar among circles). Reaction time in feature search is usually constant as a function of the number of items in the display, indicating efficient target detection (Leber and Egeth, 2006, Wolfe, et al., 2003), and this pattern holds for both younger and older adults (Plude and Doussard-Roosevelt, 1989, Whiting, et al., 2005). The search task included elements of both top-down attention, in terms of the predictability of the target shape, and distraction, in terms of the presence of a visually salient non-target display item. Our goal was to determine, for those brain regions exhibiting covariation between intrinsic FC and search RT, whether this covariation changed as a function of the search task conditions.
The analyses proceeded from three general predictions. First, we hypothesized that older adults would show reduced strength in intrinsic FC, independently of behavior, relative to the younger adults (Allen, et al., 2011, Andrews-Hanna, et al., 2007, Biswal, et al., 2010, Damoiseaux, et al., 2008, Ferreira and Busatto, 2013, Meier, et al., 2012a, Tomasi and Volkow, 2012). Second, we predicted that, overall, increased FC would be associated with improved behavioral performance (Baldassarre, et al., 2012, Meier, et al., 2012b, Seeley, et al., 2007), in this case lower RT. Our third hypothesis was that, for those regions exhibiting a relation between FC and RT, the relation would vary in response to both age group and task demands. In particular, in view of age-related decline in the efficiency of perceptual encoding and motor control (Hommel, et al., 2004, Madden, et al., 1999, Madden and Whiting, 2004, McAvinue, et al., 2012), the demands of target detection and avoiding distraction from salient non-targets should influence the RT-connectivity relation more for older adults than for younger adults.
2. Methods
2.1 Participants
Forty-two right-handed participants included 21 younger adults between 19 and 29 years of age (M = 21.70, SD = 2.89 years; 12 women) and 21 older adults between 60 and 87 years of age (M =69.24, SD = 5.62 years; 11 women). Participants scored a minimum of 27 points on the Mini Mental State Exam (Folstein, et al., 1975), a maximum of 9 on the Beck Depression Inventory (Beck, 1978), had a minimum corrected visual acuity for near point of 20/40, and had normal color vision with a score of at least 12 (out of 14) on the Dvorine color plates (Dvorine, 1963). Younger adults and older adults did not differ significantly with regard to either the number of years of education (younger adults’ M = 14.9, SD = 1.4 years; older adults’ M = 16.2, SD = 2.6 years) or raw scores on the Vocabulary subtest of the Wechsler Adult Intelligence Scale-Revised (younger adults’ M = 63.1, SD = 3.7; older adults’ M = 64.4, SD = 3.2) (Wechsler, 1981). Percentage correct responses on the digit-symbol test was high for both age groups (younger adults’ M = 97.5, SD = 2.2; older adults’ M = 95.8, SD = 2.9), but the mean RT per item was higher for older adults (M = 1841, SD = 276 ms) than for younger adults (M = 1241, SD = 243 ms), t(40) = 7.5, p < 0.0001. All participants were free from significant health problems (including hypertension, atherosclerosis, neurological and psychiatric disorders), as determined by a screening questionnaire, and none reported taking medications known to affect cognitive function or cerebral blood flow. Participants gave written informed consent for a protocol approved by the Duke University Institutional Review Board.
2.2 Task and procedure
During fMRI scanning, participants were required to respond manually to make a yes/no decision regarding whether one target shape (hexagon, trapezoid, or vertical bar) was present among distractor shapes (diamonds, horizontal bars, ovals, circles, or triangles). As illustrated in Figure 1, each display contained five items, either one target and four distractors or five distractors. In the display, the shape of the target was always different from that of the distractors (i.e., a shape singleton), and all of the distractors had the same shape. Display items were approximately equidistant from central fixation, in a circular arrangement, and the placement of the items was displaced slightly within individual locations, across trials. A target was present on half of the trials, and the target location varied across the five display locations. The target and distractors were green outline shapes on a black background except that, on half of the trials (both target-present and target-absent), one of the distractors was displayed as a red outline shape, thus making this distractor salient (i.e., a color singleton). Note that the (green) target was always a shape singleton but never a color singleton.
Figure 1.
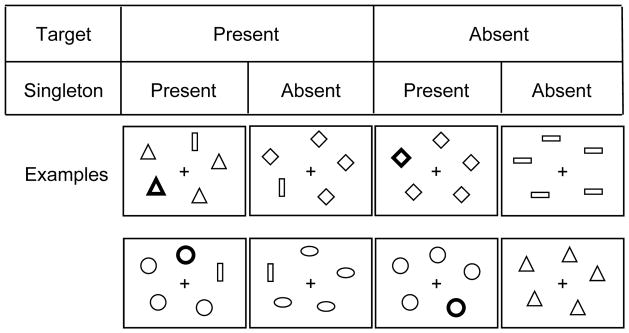
Illustration of the visual search task. On each trial, participants made a yes/no decision regarding whether one target shape (hexagon, trapezoid or vertical bar) was present among distractor shapes. The target (in this example, a vertical bar) was present on half of the trials, distributed randomly. The distractor shapes were always homogeneous (i.e., the target was a shape singleton). Display items were outline green on a black background, except for a red color singleton, illustrated in the figure by the bold outline shape, which occurred on half of the trials, distributed randomly, for both the target-present and target-absent trials. Two task conditions varied the predictability of the target. These were alternated, within each fMRI run, across on-task periods of 32 consecutive trials: In the varied condition, the target was unpredictable and, on each trial, could be either a hexagon, trapezoid, or vertical bar. In the constant condition, the shape was pre-defined, at the beginning of the on-task period, to be one of the three target shapes and was constant across the sequence of 32 trials.
Participants performed two task conditions (varied and constant) that differed in the degree to which knowledge of the task structure could influence the ability to ignore the color singleton distractor. In the varied condition, target shape was unpredictable and varied among three target shapes: hexagon, trapezoid and vertical bar, whereas in the constant condition, the shape of the target was pre-defined at the beginning of the task and remained constant for all on-task periods across all fMRI runs for that participant. Thus, the difference between the conditions was that in the constant condition participants knew exactly what the target shape would be, whereas in the varied condition any one of three shapes could be the target. But in each condition, within each display the target shape differed from the surrounding distractors. The particular target shape associated with the constant condition was counterbalanced across the hexagon, trapezoid, and vertical bar shapes, across participants. As noted previously, the distractor shapes were homogeneous within each display, but the distractor shape varied across trials.
Each of five functional imaging runs comprised two on-task blocks (one constant and one varied block), with each block consisting of 32 trials, yielding a total of 64 trials per run. With five runs of two blocks each, all participants completed 10 blocks, for a total of 320 trials. Within each run, three off-task periods were interleaved with the on-task blocks (i.e., an off-task period occurred at both the beginning and end of each scanner run, as well as between the two on-task blocks). Two run orders, balanced across participants, were used, which varied whether the participant started with a constant or varied block. Within a block, the 32 trials represented eight instances for each combination of target condition (present, absent) and singleton condition (present, absent), distributed pseudorandomly. Participants held an fMRI-compatible response box and used the left and right index fingers to respond to the presence or absence of the target shape. Participants were instructed to respond as quickly as possible while still being correct, and the assignment of target presence to the response buttons was balanced across participants within each age group.
At the beginning of the on-task blocks, an instruction screen informed participants as to whether the target would be constant or varied. Following the instruction screen, each trial started with stimuli displayed for 250 ms, followed by a 2750 ms post-display response period, during which the display was black. We measured the RT from display onset, but the screen remained black during the 2750 ms response period regardless of when the participant responded (i.e., the total time available for a response was 3000 ms). Following the response period, a white center fixation cross was displayed on the black screen, for a variable time period (jitter, 1500–7500 ms). Thus, the fixation cross signaled an upcoming trial. These jitter durations were distributed within blocks based upon an approximately exponential decrease in frequency, with the shortest (1500 ms) durations most heavily sampled, and the longest (7500 ms) durations least sampled. Jitter durations were distributed evenly across blocks. No feedback regarding response accuracy was provided. During the off-task periods, three white center fixation crosses remained onscreen for 13 TRs, or 19.5 seconds. Participants were instructed to relax during this period, although to remain awake, with eyes open, and in preparation for the upcoming task.
2.3 MRI data acquisition
Imaging was conducted on a 3 T GE Signa Excite MRI scanner (GE Healthcare, Waukesha, WI) with an eight-channel head coil. Participants wore earplugs during scanning to reduce scanner noise, and head motion was minimized with foam pads and headband. The imaging sequence included a 3 plane localizer, followed by T1-weighted, T2-weighted, five runs of T2*-weighted (functional) and two runs of diffusion tensor imaging (DTI; not reported here). Slice orientation was near-axial, parallel to the anterior-posterior commissure (AC-PC) plane.
The T1-weighted anatomical images were 60 contiguous slices acquired with a high-resolution, 3D fast inverse-recovery-prepared spoiled gradient recalled (SPGR) sequence, with repetition time (TR) = 7.3 ms, echo time (TE) = 2.97 ms, inversion recovery time (TI) = 450 ms, field of view (FOV) = 256 mm, 2 mm slice thickness, flip angle = 12°, voxel size = 2 × 2 × 2 mm, 256 × 256 matrix, and a parallel imaging with a selection factor of 2.
The proton density (PD)/T2-weighted anatomical images were 60 contiguous slices acquired with an echo-planar (gradient-echo) sequence, with TR = 4000 ms, TE = 7.4 and 120 ms, FOV = 256 mm, 2 mm slice thickness, flip angle = 90°, voxel size = 2 × 2 × 2 mm, and 256 × 256 matrix.
The T2*-weighted echo-planar, functional images were sensitive to the blood oxygen level dependent (BOLD) signal. These were 30 contiguous slices acquired using an inverse spiral sequence, with TR = 1500 ms, TE = 30 ms, FOV = 256 mm, 4 mm slice thickness, flip angle = 60°, voxel size = 4 × 4 × 4 mm, and 64 × 64 matrix.
2.4 Data preprocessing
The fMRI data were preprocessed using tools from the Oxford Centre for Functional MRI of the Brain’s Software Library (FSL version 4.0, www.fmrib.ox.ac.uk/fsl) and locally developed Matlab codes (MathWorks, Natick, MA). The first four volumes were discarded in order to allow for equilibration of the magnetic field. The data were realigned to correct for head movements within runs. The data were then registered to the Montreal Neurological Institute (MNI) 152 template using a 12 degrees of freedom affine transformation implemented in FSL’s Linear Image Registration Tool (FLIRT). All subsequent analyses were conducted in the MNI standard space. Prior to the FC analysis, we removed constant offsets and linear drift over each run and eliminated the task-related effects (Fair, et al., 2007). We also regressed out six-parameter rigid body head motion (obtained from motion correction), the signal averaged over the white matter, and the signal averaged over the cerebrospinal fluid regions in order to reduce non-neuronal contributions to BOLD correlations (Van Dijk, et al., 2010). Frequencies below 0.08 Hz were retained. The global negative index (Chen, et al., 2012) was above the critical value of 0.03 for each participant (younger adults’ M = 0.07, SD = 0.02; older adults’ M = 0.07, SD = 0.03), suggesting that global signal regression would not be advantageous, and thus we performed the analysis of FC without global signal regression.
2.5 Analysis of functional connectivity
Figure 2 illustrates the two major stages of the FC analysis. The first stage was defining the matrix of functionally connected brain regions. For each participant, we parceled the preprocessed low-frequency fMRI data into a set of 90 regions (45 within each left/right hemisphere) in the anatomical template of Tzourio-Mazoyer et al. (2002) (Figure 2, panel A). Each participant’s BOLD time series was averaged within each brain region. Connectivity between regions was represented by the Pearson correlation coefficient r between the time series for each pair of brain regions, in the combined matrix of 8100 (i.e., 90 × 90) region pairs. This connectivity matrix has 4005 [(90 × 89)/2] unique cells, and the associated r values were the raw data for the connectivity analyses. Correlations within the matrix of the 4005 regional r values were transformed to Zr values (Zrlinki, i = link number, from 1 to 4005) with Fisher’s r-to-z transformation (Fisher, 1921).
Figure 2.

Overview of the two major stages of the analysis of functional connectivity (FC). Panel A: First, for each participant, the preprocessed data were parceled into a set of 90 regions (45 within each left/right hemisphere) in the Automated Anatomical Labeling (AAL) Template (Tzourio-Mazoyer, et al., 2002). The individual regions are listed in Supplementary Table 1. A FC matrix for each participant was generated, with each cell containing the Fisher Zr-transformed correlation coefficient between each pair of brain regions. The regions were further categorized into six systems based on the Salvador et al. (2005) multidimensional scaling of resting-state data. Panel B: Second, we applied behavior-based connectivity analysis (BBCA) to correlate the connectivity strength of each link, from the matrix illustrated in Panel A, with averaged log-transformed reaction time (RT) across eight task conditions. The RRT-linki (i = the link number) represents the across-participant correlations between the regional Zr values and RT across age groups.
The second major analytic stage was thresholding the FC matrix on the basis of the regional relation to RT (i.e., BBCA) (Chen, et al., 2009). We used the absolute value of Zrlinki for each cell of the connectivity matrix. To define those functionally connected regions most relevant for performance in this search task, we averaged the log-transformed RT across the eight task conditions (i.e., 2 constant/varied search conditions x 2 target present/absent x 2 singleton present/absent conditions) and then applied BBCA to correlate the averaged log-transformed RT with the connectivity strength of each link across both age groups (Figure 2, panel B). The RRT-linki (i = link number, from 1 to 4005) shown in Figure 2, panel B represents the across-participant correlations between the Zrlinki value of each link and the averaged log transformed RT. All of the RRT-linki values were Fisher-transformed to Zr values (ZrRT-linki). Once the task-relevant links were identified, in the data set combining the age groups and task conditions, further analyses were conducted on the strength of these links across the combination of the individual task conditions and age groups.
For interpretation of results, we grouped the 90 regions into six brain region categories based on a hierarchical clustering analysis of resting-state fMRI data reported by Salvador et al. (2005), who also parcellated their functional data on the basis of the Tzourio-Mazoyer et al. (2002) anatomical template. Salvador et al. described six large clusters of resting state data corresponding approximately to four neo-cortical systems, plus temporal lobe and subcortical systems. These six systems could be decomposed further into anatomically and functionally plausible subsystems. The individual anatomical regions within each of the six systems are listed in Supplementary Table 1. The frontal system contains orbitofrontal, prefrontal, and anterior cingulate cortices implicated in diverse strategic or executive functions. The parietal-(pre)motor system are regions specialized for motor and spatial attentional functions. The temporal system comprises regions related to auditory-verbal functions. The anterior/medial temporal system are regions related to mnemonic and affective processing, whereas the occipital system contains visual sensory and association cortex. The subcortical system contains several subcortical nuclei.
3. Results
3.1 Visual search performance
In the visual search task, the percentage correct detection of the target (hit rate) was high for both age groups, but was significantly better for younger adults (96%) than for older adults (92%), F(1, 40) = 5.23, p < .05. The false alarm rate was higher for older adults (8%) than for younger adults (2%), F(1, 40) = 12.58, p < .001, indicating that the hit rate data were not the result of more conservative detection criteria on the part of older adults.
The behavioral data of primary interest for visual search were the RTs for correct responses. Individual RTs were eliminated from the analysis if they were either less than 200 ms or greater than 3000 ms (< 2% of the trials per age group). For each participant, median RT for correct responses was obtained for each combination of block (constant/varied), target (present/absent), and singleton (present/absent). The means of these median RTs, across participants, are presented in Table 1. An analysis of variance (ANOVA) of the RT data, with age group as a between-subjects variable and block type, target presence, and singleton presence as within-subject variables yielded significant main effects for age group, F(1, 40) = 6.85, p < 0.01, constant versus varied block, F(1, 40) = 7.57, p < 0.01, and singleton distractor presence, F(1, 40) = 81.67, p < 0.0001. These effects represent, respectively, 105 ms higher RTs for older adults than for younger adults, 18 ms higher RTs for the varied block than for the constant block, and 55 ms higher RTs when the color singleton distractor was present relative to when it was absent.
Table 1.
Reaction Time as a Function of Block Type, Age Group, Target Presence, and Singleton Distractor Presence
| Condition | Younger Adults | Older Adults |
|---|---|---|
| Constant-Target | ||
| Target-present/Singleton-absent | 729 (142) | 829 (125) |
| Target-present/Singleton-present | 752 (154) | 906 (161) |
| Target-absent/Singleton-absent | 743 (112) | 804 (123) |
| Target-absent/Singleton-present | 774 (155) | 900 (169) |
| Varied-Target | ||
| Target-present/Singleton-absent | 756 (139) | 836 (127) |
| Target-present/Singleton-present | 781 (134) | 903(166) |
| Target-absent/Singleton-absent | 761 (126) | 832 (140) |
| Target-absent/Singleton-present | 793 (141) | 922 (156) |
Note. n = 21 for each age group. Reaction times are means (across participants) of median values, in ms, for correct responses. Standard deviations are in parentheses.
The only interaction that was significant was the Age Group x Singleton Distractor interaction, F(1, 40) = 20.38, p < 0.0001, which occurred because the absolute magnitude of the increase in RT associated with the color singleton distractor was greater for older adults (83 ms) than for younger adults (28 ms). To take into account any task complexity or scaling effects associated with the overall higher RT values for the older adults, we also applied a logarithmic transformation to the RT values, which treats equal ratios as equal intervals (Madden, 2001, Salthouse, 1985). The Age Group x Singleton Distractor interaction remained significant in the log-transformed data, F(1, 40) = 18.20, p < 0.0001, indicating that the age-related difference in the singleton distractor effect was a disproportionate increase in the older adults’ RTs, beyond what would be expected on the basis of a generalized age-related slowing. Expressed as a percentage increase in RT, relative to when the singleton distractor was not present, the distraction slowed responding by 10.06% for older adults and by 3.75% for younger adults.
3.2 Age group differences in functional connectivity
The averaged FC Zr matrix across participants within each age group is presented in Figure 3, panel A, showing the younger adults below the diagonal and the older adults above the diagonal. Two-sample t-tests on each Zrlinki value of the combined connectivity matrix, yielded 123 regions (matrix cells) with a significantly higher Zrlinki value for younger adults than for older adults, corrected for multiple comparisons at a false discovery rate (FDR) of 0.05 (Benjamini and Hochberg, 1995) (Figure 3, panel B). All of the 123 significant age group differences were in the direction of higher connectivity for younger adults than for older adults. Age group differences were prominent within the anterior/medial temporal system (61% of all age group differences), although the occipital, subcortical, and parietal-(pre)motor systems also exhibited age-related effects (Figure 3, panel B). Additional details of the regional distribution of the age group differences are presented in Supplementary Figure 1.
Figure 3.

Panel A: Averaged FC Zr matrix across participants within each age group, with the younger group below the diagonal and the older group above the diagonal. In this 90 × 90 square matrix, the x and y axes represent the 90 regions of the Automated Anatomical Labeling (AAL) Template (Tzourio-Mazoyer, et al., 2002), and each matrix element is colored to represent the FC (Zr value) between a pair of listed brain regions. The regions were further categorized into six systems based on the Salvador et al. (2005) multidimensional scaling of resting-state data. Panel B: Distribution of age group differences in connectivity strength. All age group differences were in the direction of younger > older. Each matrix element is colored to represent the p value of the younger > older effect (corrected for multiple comparisons at a false discovery rate of 0.05).
Because age-related decline in connectivity of the DMN has been reported (Andrews-Hanna, et al., 2007, Damoiseaux, et al., 2008, Grady, et al., 2010), we also selected four regions (in each hemisphere) that are typically categorized within the DMN: medial prefrontal, posterior cingulate, lateral parietal, and parahippocampal cortex. The mean Zrlinki value across these default mode regions was significantly lower for older adults, 0.55 ± 0.11, than for younger adults, 0.67 ± 0.17, t(40) = 2.7, p < 0.001. In addition, as a control measure, we compared the FC between the left and right primary visual areas (calcarine sulcus and cuneus) in the older group to that in the younger groups. Andrews-Hanna et al. (2007) found that intrinsic FC between left and right hemisphere-visual cortical regions was comparable for younger and older adults (but cf., Yan, et al., 2011). In the present data, consistent with Andrews-Hanna et al. (2007), we found that the interhemispheric FC between visual regions did not differ significantly between the age groups (mean Zrlinki = 1.11 ± 0.24 for older adults and 1.14 ± 0.25 for younger adults; p > .05).
3.3 BBCA-identified links associated with reaction time
We first used BBCA to identify the RT-connectivity correlations that were significant, averaged across the age groups and task conditions, to estimate, in the least biased manner, those functionally connected regions that were also related to search task performance. This analysis yielded eight significant links (p < 0.00001, corrected, with a cluster-size threshold of 3). Here we corrected for multiple comparisons using a cluster-size thresholding approach (Forman, et al., 1995). Although none of the RT-connectivity correlations would be significant following a Bonferroni or the false discovery rate (FDR) correction (Benjamini and Hochberg, 1995), the cluster-size thresholding approach provides Type I error protection equivalent to a Bonferroni-type adjustment by appropriately combining alpha level and cluster size without the equivalent loss of power (Forman, et al., 1995).
Figure 4 illustrates the set of eight functional connections that were correlated significantly with RT. Individual links are listed in Table 2. Seven of these eight links included the paracentral lobule from the parietal lobe, which, in the Salvador et al. (2005) nomenclature, is included in the parietal-(pre)motor cluster associated with spatial attention and motor functioning. Broadly, the eight links represent functional connections between regions in this parietal-(pre)motor cluster and those in frontal and subcortical clusters (seven links), plus a link between the anterior/medial temporal cluster and the subcortical cluster. All of the RT-connectivity correlations were negative, representing higher connectivity strength associated with faster responses (i.e., lower RT values).
Figure 4.

Links between regions exhibiting a significant association between FC strength and visual search RT (Table 2). Spheres represent the centroids of the AAL regions as estimated by the BrainNet Viewer (http://www.nitrc.org/projects/bnv/). R = right; L = left; PCL = paracentral lobule; ORBsup =superior frontal gyrus, orbital part; REC = gyrus rectus; OLF = olfactory cortex; CAU = caudate nucleus; GPA = globus pallidus; MCG = middle cingulate gyrus; PHG = parahippocampal gyrus.
Table 2.
Links with a Significant Correlation with Reaction Time
| Region 1 | Region 2 | RT-Connectivity Correlation |
|---|---|---|
| R-PCL [Parietal-(Pre)Motor] | L-ORBsup [Frontal] | −0.46 |
| R-PCL [Parietal-(Pre)Motor] | R-ORBsup [Frontal] | −0.43 |
| R-PCL [Parietal-(Pre)Motor] | R-REC [Frontal] | −0.44 |
| R-PCL [Parietal-(Pre)Motor] | R-OLF [Subcortical] | −0.42 |
| R-PCL [Parietal-(Pre)Motor] | R-CAU [Subcortical] | −0.45 |
| R-PCL [Parietal-(Pre)Motor] | R-GPA [Subcortical] | −0.49 |
| R-GPA [Subcortical] | R-MCG [Parietal-(Pre)Motor] | −0.46 |
| R-GPA [Subcortical] | L-PHG [Anterior/Medial Temporal] | −0.43 |
Note. Listed links are those significant from behavior-based connectivity analysis (BBCA). The BBCA was performed across age groups and task conditions. All the RT-connectivity correlations listed in the Table were significant at p < 0.00001, corrected, with a cluster-size threshold of 3 (Forman, et al., 1995). Correlations are not significant by conventional Bonferroni or false discovery rate (FDR) correction for multiple comparisons (Benjamini and Hochberg, 1995). Region abbreviations are from the anatomical template of Tzourio-Mazoyer et al. (2002). For each region, the associated cluster, as reported by Salvador et al. (2005), is presented in brackets.
Key: CAU = caudate nucleus; GPA = globus pallidus; L = left; MCG = middle cingulate gyrus; OLF = olfactory cortex; ORBsup =superior frontal gyrus, orbital part; PCL = paracentral lobule; PHG = parahippocampal gyrus; R = right; REC = gyrus rectus; RT = reaction time.
3.5 Variation in the connectivity Effects of age and task condition on correlations between functional connectivity and reaction time
The RT-connectivity correlation matrices that included 90 cortical and subcortical regions for each combination of age group and task condition are presented in Supplementary Figure 2. To assess whether age group and task condition modulated the RT-connectivity correlations, we focused on the eight links that were significantly identified by BBCA across age groups and task conditions (Section 3.4), and considered them as the “reference connections.” Across participants, the connectivity strength of each link was correlated with RT in each of the eight task conditions for each age group, yielding 64 (8 links × 2 blocks × 2 target presence/absence × 2 singleton distractor presence/absence) observations for each age group. Thus, the eight reference links in Table 2, rather than participants, were treated as individual observations. The means of the Zr values are illustrated in Figure 5.
Figure 5.

Correlation (Zr) between FC and reaction time as a function of age group, block type, target presence, and singleton distractor presence.
An ANOVA of the Zr data, with age group as a between-links variable and block type, target presence, and singleton distractor presence as within-links variables yielded significant main effects for age group, F(1, 14) = 90.60, p < 0.0001, constant versus varied block, F(1, 14) = 9.24, p < 0.01, singleton distractor presence, F(1, 14) = 38.64, p < 0.0001, and target presence, F(1, 14) = 37.87, p < 0.0001. These main effects represent, respectively, a stronger negative correlation for younger adults than for older adults, for the constant block than for the varied block, for the absence of the color singleton distractor relative to its presence, and for the absence of the target relative to its presence. Two interaction effects, not involving age group, were significant: Block x Singleton Distractor, F(1, 14) = 5.71, p < 0.05, and Block x Singleton Distractor x Target, F(1, 14) = 10.25, p < 0.01. Four interaction effects involving age group were significant: Age x Block, F(1, 14) = 8.27, Age x Block x Target, F(1, 14) = 14.89, p < 0.01, p < 0.01, Age x Singleton Distractor, F(1, 14) = 42.83, p < 0.0001, and Age x Block x Singleton Distractor, F(1, 14) = 5.97, p < 0.05.
The two interactions not involving age group represent a pattern in which the degree of connectivity with RT was disrupted (i.e., moved closer to zero) by the presence of a color singleton distractor. The distractor-related disruption was greater in magnitude within the varied target condition than the constant target condition, but the disruption was significant for both conditions, with F(1, 14) > 17.0, p < .001, in each case. This interaction between the distractor and search condition, however, was significant only when the target was absent, F(1, 14) = 37.27, p < .0001, and not when the target was present, leading to the significant Block x Singleton Distractor x Target effect.
The four age-related interactions represent a pattern in which, for older adults considered separately, the degree of connectivity with RT was disrupted (i.e., moved closer to zero) by the presence of either a target, F(1, 7) = 52.87, p < .001, or a singleton distractor, F(1, 7) = 64.76, p < .0001. For the older adults, the effect of the target interacted with block, F(1, 7) = 6.35, p < .05, such that the disruptive effect of target presence, on the RT-connectivity relation, was significant within the constant search condition, F(1, 7) = 46.94, p < .001, but not the varied condition. The singleton distractor effect did not interact with any other variables for the older adults. In contrast, for the younger adults, the overall disruption of the RT-connectivity relation was significant for target presence, F(1, 7) = 6.28, p < .05, but not for distractor presence. The younger adults also exhibited a significant effect of block, reflecting connectivity disruption in the varied condition relative to the constant condition, F(1, 7) = 44.88, p < .001, as well as interactions of Block x Target and Block x Singleton Distractor. The Block x Target effect for younger adults occurred because the disruptive effect of target presence was significant for the varied condition, F(1, 7) = 8.08, p < .05, but not the constant condition. The Block x Singleton Distractor interaction, for the younger adults, occurred because a disruptive effect of the singleton distractor was significant within the varied block, F(1, 7) = 12.50, p < .01, but not within the constant block.
4. Discussion
These analyses of intrinsic FC yielded three main findings relevant to our initial hypotheses. First, we observed age-related decline in the strength of intrinsic FC, including the default mode network, consistent with previous studies. Second, the BBCA method identified eight pairs of functionally linked regions for which FC covaried with visual search RT, and all of these pairs exhibited an association between increasing FC and faster responding. Third, the relation between intrinsic FC and RT varied as a function of both adult age and task condition, reflecting the influences of visual target detection and distraction from salient non-targets.
4.1. Age group differences in functional connectivity
Our whole-brain analyses revealed age-related differences in intrinsic FC throughout the brain, and specifically within the DMN. We found that older adults exhibited decreased connectivity strength in default mode regions compared to the younger adults, but also in other links, particularly those involving anterior/medial temporal regions (Figure 3; Supplementary Figure 1). These regions, though overlapping with some default mode regions, were the system that Salvador et al. (2005) characterized as representing mnemonic and affective processing. In contrast, younger and older adults were comparable in the degree of connectivity between left and right visual sensory cortex, consistent with Andrews-Hanna et al. (2007, but cf., Yan, et al., 2011). The central trend of previous findings regarding age-related differences in intrinsic FC is a widespread decrease throughout the brain for older adults (Allen, et al., 2011, Andrews-Hanna, et al., 2007, Damoiseaux, et al., 2008, Ferreira and Busatto, 2013), though some regions with age-related increases in connectivity have also been observed (Biswal, et al., 2010, Meier, et al., 2012a, Tomasi and Volkow, 2012). Thus, when correlations with behavior are not considered, the pattern of age-related decline in intrinsic FC generally conforms to previous findings, particularly the age-related decrease in DMN connectivity combined with preserved visual cortical connectivity (Andrews-Hanna, et al., 2007).
4.2. Connectivity-performance relation
In the BBCA analyses relating FC to visual search RT, collating the data across age group and task condition, we identified a set of eight functional connections (pairs of regions) that were correlated significantly with RT (Figure 4 and Table 2). All of these correlations were in the negative direction, representing a decrease in search RT (i.e., faster responding) as a function of increasing connectivity. This pattern confirms previous investigations and our hypothesis of improved behavioral performance associated with increases in intrinsic FC (Baldassarre, et al., 2012, Meier, et al., 2012b, Seeley, et al., 2007).
Six of these eight pairs of regions included the paracentral lobule, which is the medial portion of the superior frontal gyrus, continuous with the precentral and postcentral gyri on the lateral surface. Salvador et al. (2005) found that intrinsic FC for the paracentral lobule clustered statistically with the resting-state activity of other frontal and parietal regions associated with spatial attention and motor functioning (e.g., precentral and postcentral gyri, middle cingulate gyrus, supplementary motor area, and superior parietal lobule). The Salvador et al. parietal-(pre)motor cluster is similar to the set of regions that Yeo et al. (2011) characterize as an intrinsic FC network for somatomotor functioning. Laird et al. (2011) found that a closely corresponding network, which they label intrinsic connectivity network (ICN) 8, including ventral precentral and postcentral gyri, was associated with action and somesthesis for hand movements. In the present data, it is likely that the functionally connected pairs of regions are related to the manual button-press from which we recorded RT on each trial. Five of the eight pairs of regions associated with RT included a subcortical region (e.g., caudate, globus pallidus), further supporting the critical role of manual response selection and related motor control in this task.
The predominant theme of somatomotor functioning associated with the eight pairs of regions linked to RT (Figure 4 and Table 2) is surprising, given that the behavioral goal of the visual search task is a shape discrimination, the detection of the presence of a target shape among non-target shapes. When, however, the non-target shapes are all similar, as in the present case, the exact shape of the target need not be determined; the participant only needs to detect the presence of a shape that is different from the distractors. Under these conditions, both younger and older adults can respond quickly and accurately regardless of the number of non-target items (Leber and Egeth, 2006, Whiting, et al., 2005, Wolfe, et al., 2003). Some degree of attentional control is required, because in selecting the target-present/absent response, participants must attempt to ignore a distractor that is highly salient (the red color singleton), and the target shape was more predictable in the constant block than in the varied block.
Consistent with an attentional contribution, three of the eight FC links involve orbitofrontal regions (e.g., orbital part of the superior frontal gyrus, gyrus rectus). These regions are in the frontal cluster that Salvador et al. (2005) describe as relating to diverse strategic or executive functions. Laird et al. (2011) define these orbitofrontal regions (their ICN 4) as a network associated with RT tasks such as Stroop, go/no-go, and Flanker. The eight links identified by BBCA have a pronounced right-hemispheric laterality, which is often observed in event-related fMRI activation for visual search and detection tasks (Corbetta and Shulman, 2002, Shulman, et al., 2003). Thus, the present FC links related to RT represent regions from different intrinsic FC networks, primarily those representing the attentional demands of response selection and motor control, in the context of visual detection.
4.3 Differences in functional connectivity networks in relation to adult age and task demands
Our analyses demonstrated, as hypothesized, that reliable changes occur in the relation between intrinsic FC and RT as a function of adult age and task demands. Across the different task conditions, the correlation between FC and RT (i.e., mean Zr) remained below zero(Figure 5), consistent with the overall improvement in response speed as a function of increasing connectivity between regions (Baldassarre, et al., 2012, Meier, et al., 2012b, Seeley, et al., 2007). The main effect of age group was significant, as a result of mean Zr values that were lower (i.e., higher in absolute value) for younger adults than for older adults, reflecting a stronger association between regional connectivity (primarily between somatomotor and orbitofrontal regions) and search RT for younger adults, relative to older adults. This pattern of age-related decline in the covariation of intrinsic FC and behavioral performance complements previous findings of age-related decline in FC, based on predefined brain regions (Andrews-Hanna, et al., 2007, Campbell, et al., 2012). The behaviorally relevant connectivity, between somatomotor and orbitofrontal networks, is consistent with the age-related decline in behavioral measures of the efficiency of perceptual encoding and motor control during visual tasks (Hommel, et al., 2004, Madden, et al., 1999, Madden and Whiting, 2004, McAvinue, et al., 2012). In the Chen et al. (2009) data, though, BBCA-identified regions exhibited a stronger relation with choice RT for older adults than for younger adults. In the Chen et al. study, the RT-dependent orbitofrontal regions were linked to visual sensory regions rather than to the somatosensory regions as in the present data, and RT was limited to a single task condition (left/right button press corresponding to arrow direction).
Other findings in the present analyses that are evidence for the task-dependent nature of the RT-connectivity relation are the significant main effects for constant versus varied block, singleton distractor presence versus absence, and target presence versus absence. The RT-connectivity relation was relatively stronger (i.e., lower Zr values) when the display did not contain a visually salient display item, either a target or a color singleton distractor, and when the task context was one in which the target shape (if present) was more predictable. These main effects were qualified by two groups of interaction effects, one of which did not involve age group and one that did. The interactions are complex and should not be over-interpreted, because the entire data set was only 128 observations. But the general pattern is relatively clear, in that, independently of age group, when the target was absent, the RT-connectivity relation was disrupted (i.e., moved closer to zero) by the presence of a color singleton distractor, particularly when the target was less predictable.
The age-related interactions reflect, as hypothesized, a more pronounced influence of the task demands on the RT-connectivity relation for older adults than for younger adults. The older adults exhibited significant disruption of connectivity when either a target or singleton distractor was present. The older adults’ distractor-related disruption was substantial within both the constant and varied search conditions, although target-related disruption occurred only with the more predictable targets (constant condition). In contrast, the younger adults’ disruption of the RT-connectivity relation was more limited: The overall effect of singleton distractor presence was not significant for younger adults. Some degree of distractor-related disruption of the RT-connectivity relation did occur with less predictable targets (varied condition), and target presence also led to a disruption of younger adults’ connectivity in the varied condition. Relative to older adults, younger adults exhibited less disruption of the RT-connection relation, associated with the presence of the color singleton, and were better than older adults in maintaining the connectivity when the target was predictable (constant condition). Thus, the covariation of intrinsic FC and behavioral performance, across different resting-state networks, may have a role in age-related decline in the resistance to distraction by salient but task-irrelevant information (Campbell, et al., 2012).
4.4 Limitations
The present analyses were conducted using the Tzourio-Mazoyer (2002) template, which uses anatomically defined regions, but converging analyses using a higher spatial resolution, voxelwise approach would be desirable. Reliability and validity would be enhanced by increased sample size and a more complete range of adult age, which would allow the consideration of age as a continuous rather than categorical variable (i.e., age group). Our significance threshold for the RT-connectivity relation, in the BBCA analyses, while providing appropriate Type I error protection (Forman, et al., 1995), is not as strict as a conventional Bonferroni or the FDR-correction (Benjamini and Hochberg, 1995), which must be considered in interpreting the results. Several of the task-relevant FC links (Figure 4 and Table 2) include orbitofrontal regions, and thus the data for these regions may be less reliable due to signal loss and spatial distortion (Yeo, et al., 2011). The analyses conducted here, while identifying covariation between intrinsic FC and behavioral performance, should be supplemented by other techniques that allow inferences regarding the causal relations among the various FC links and behavior.
5. Conclusions
Intrinsic FC is lower for older adults than younger adults in many brain regions, particularly the DMN, but in regions related to cognitive performance as well. We identified eight pairs of regions, connecting across somatomotor, orbitofrontal, and subcortical networks, for which intrinsic FC covaried with a RT measure of visual search performance. For younger and older adults combined, increasing connectivity among these regions was associated with improved visual search performance, in the form of decreased RT. Behavioral analyses of the RT data indicated that older adults were more vulnerable than younger adults to distraction by a highly salient but task-irrelevant display item (color singleton distractor). Analyses of the RT-connectivity relation demonstrated that this relation varied significantly as a function of age group and the search task condition. The covariation between intrinsic FC an RT was overall stronger for younger adults than for older adults, and older adults exhibited greater vulnerability to disruption of the RT-connectivity relation, as a function of the presence of a salient distractor item. Thus, low-frequency fluctuations in distributed brain networks may contribute, in ways as yet unexplored, to visual search and other forms of cognitive performance.
Supplementary Material
Acknowledgments
This research was supported by NIH research grants R01 AG039684 (DJM) R01-NS074045 (NkC) and training grant T32 AG000029. We are grateful to Anne Shepler, Matthew Costello, Simon Davis, and Allen Song for assistance.
References
- Allen EA, Erhardt EB, Damaraju E, Gruner W, Segall JM, Silva RF, Havlicek M, Rachakonda S, Fries J, Kalyanam R, Michael AM, Caprihan A, Turner JA, Eichele T, Adelsheim S, Bryan AD, Bustillo J, Clark VP, Feldstein Ewing SW, Filbey F, Ford CC, Hutchison K, Jung RE, Kiehl KA, Kodituwakku P, Komesu YM, Mayer AR, Pearlson GD, Phillips JP, Sadek JR, Stevens M, Teuscher U, Thoma RJ, Calhoun VD. A baseline for the multivariate comparison of resting-state networks. Front Syst Neurosci. 2011;5:2. doi: 10.3389/fnsys.2011.00002. [DOI] [PMC free article] [PubMed] [Google Scholar]
- Anderson JS, Ferguson MA, Lopez-Larson M, Yurgelun-Todd D. Connectivity gradients between the default mode and attention control networks. Brain Connect. 2011;1:147–157. doi: 10.1089/brain.2011.0007. [DOI] [PMC free article] [PubMed] [Google Scholar]
- Andrews-Hanna JR, Snyder AZ, Vincent JL, Lustig C, Head D, Raichle ME, Buckner RL. Disruption of large-scale brain systems in advanced aging. Neuron. 2007;56:924–935. doi: 10.1016/j.neuron.2007.10.038. [DOI] [PMC free article] [PubMed] [Google Scholar]
- Baldassarre A, Lewis CM, Committeri G, Snyder AZ, Romani GL, Corbetta M. Individual variability in functional connectivity predicts performance of a perceptual task. Proc Natl Acad Sci U S A. 2012;109:3516–3521. doi: 10.1073/pnas.1113148109. [DOI] [PMC free article] [PubMed] [Google Scholar]
- Bano D, Agostini M, Melino G, Nicotera P. Ageing, neuronal connectivity and brain disorders: an unsolved ripple effect. Mol Neurobiol. 2011;43:124–130. doi: 10.1007/s12035-011-8164-6. [DOI] [PubMed] [Google Scholar]
- Beck AT. The Beck depression inventory. Psychological Corporation; New York: 1978. [Google Scholar]
- Benjamini Y, Hochberg Y. Controlling the false discovery rate: A practical and powerful approach to multiple testing. J Roy Stat Soc B Met. 1995;57:289–300. [Google Scholar]
- Biswal B, Yetkin FZ, Haughton VM, Hyde JS. Functional connectivity in the motor cortex of resting human brain using echo-planar MRI. Magn Reson Med. 1995;34:537–541. doi: 10.1002/mrm.1910340409. [DOI] [PubMed] [Google Scholar]
- Biswal BB, Mennes M, Zuo XN, Gohel S, Kelly C, Smith SM, Beckmann CF, Adelstein JS, Buckner RL, Colcombe S, Dogonowski AM, Ernst M, Fair D, Hampson M, Hoptman MJ, Hyde JS, Kiviniemi VJ, Kotter R, Li SJ, Lin CP, Lowe MJ, Mackay C, Madden DJ, Madsen KH, Margulies DS, Mayberg HS, McMahon K, Monk CS, Mostofsky SH, Nagel BJ, Pekar JJ, Peltier SJ, Petersen SE, Riedl V, Rombouts SA, Rypma B, Schlaggar BL, Schmidt S, Seidler RD, Siegle GJ, Sorg C, Teng GJ, Veijola J, Villringer A, Walter M, Wang L, Weng XC, Whitfield-Gabrieli S, Williamson P, Windischberger C, Zang YF, Zhang HY, Castellanos FX, Milham MP. Toward discovery science of human brain function. Proc Natl Acad Sci U S A. 2010;107:4734–4739. doi: 10.1073/pnas.0911855107. [DOI] [PMC free article] [PubMed] [Google Scholar]
- Buckner RL, Andrews-Hanna JR, Schacter DL. The brain’s default network: anatomy, function, and relevance to disease. Ann N Y Acad Sci. 2008;1124:1–38. doi: 10.1196/annals.1440.011. [DOI] [PubMed] [Google Scholar]
- Campbell KL, Grady CL, Ng C, Hasher L. Age differences in the frontoparietal cognitive control network: implications for distractibility. Neuropsychologia. 2012;50:2212–2223. doi: 10.1016/j.neuropsychologia.2012.05.025. [DOI] [PMC free article] [PubMed] [Google Scholar]
- Chen G, Xie C, Ward BD, Li W, Antuono P, Li SJ. A method to determine the necessity for global signal regression in resting-state fMRI studies. Magn Reson Med. 2012;68:1828–1835. doi: 10.1002/mrm.24201. [DOI] [PMC free article] [PubMed] [Google Scholar]
- Chen NK, Chou YH, Song AW, Madden DJ. Measurement of spontaneous signal fluctuations in fMRI: adult age differences in intrinsic functional connectivity. Brain Struct Funct. 2009;213:571–585. doi: 10.1007/s00429-009-0218-4. [DOI] [PMC free article] [PubMed] [Google Scholar]
- Corbetta M, Shulman GL. Control of goal-directed and stimulus-driven attention in the brain. Nat Rev Neurosci. 2002;3:201–215. doi: 10.1038/nrn755. [DOI] [PubMed] [Google Scholar]
- Damoiseaux JS, Beckmann CF, Arigita EJ, Barkhof F, Scheltens P, Stam CJ, Smith SM, Rombouts SA. Reduced resting-state brain activity in the “default network” in normal aging. Cereb Cortex. 2008;18:1856–1864. doi: 10.1093/cercor/bhm207. [DOI] [PubMed] [Google Scholar]
- Damoiseaux JS, Greicius MD. Greater than the sum of its parts: a review of studies combining structural connectivity and resting-state functional connectivity. Brain Struct Funct. 2009;213:525–533. doi: 10.1007/s00429-009-0208-6. [DOI] [PubMed] [Google Scholar]
- Dennis NA, Cabeza R. Neuroimaging of healthy cognitive aging. In: Craik FIM, Salthouse TA, editors. The handbook of aging and cognition. Psychology Press; New York: 2008. pp. 1–54. [Google Scholar]
- Dong L, Shen Y, Lei X, Luo C, Li QW, Wu WY, Yao DZ, Li CB. The heterogeneity of aging brain: altered functional connectivity in default mode network in older adults during verbal fluency tests. Chin Med J (Engl) 2012;125:604–610. [PubMed] [Google Scholar]
- Dosenbach NU, Fair DA, Miezin FM, Cohen AL, Wenger KK, Dosenbach RA, Fox MD, Snyder AZ, Vincent JL, Raichle ME, Schlaggar BL, Petersen SE. Distinct brain networks for adaptive and stable task control in humans. Proc Natl Acad Sci U S A. 2007;104:11073–11078. doi: 10.1073/pnas.0704320104. [DOI] [PMC free article] [PubMed] [Google Scholar]
- Dvorine I. Dvorine pseudo-isochromatic plates. 2. Harcourt; New York: 1963. [Google Scholar]
- Esposito F, Aragri A, Pesaresi I, Cirillo S, Tedeschi G, Marciano E, Goebel R, Di Salle F. Independent component model of the default-mode brain function: combining individual-level and population-level analyses in resting-state fMRI. Magn Reson Imaging. 2008;26:905–913. doi: 10.1016/j.mri.2008.01.045. [DOI] [PubMed] [Google Scholar]
- Fair DA, Schlaggar BL, Cohen AL, Miezin FM, Dosenbach NU, Wenger KK, Fox MD, Snyder AZ, Raichle ME, Petersen SE. A method for using blocked and event-related fMRI data to study “resting state” functional connectivity. Neuroimage. 2007;35:396–405. doi: 10.1016/j.neuroimage.2006.11.051. [DOI] [PMC free article] [PubMed] [Google Scholar]
- Ferreira LK, Busatto GF. Resting-state functional connectivity in normal brain aging. Neuroscience & Biobehavioral Reviews. 2013 doi: 10.1016/j.neubiorev.2013.01.017. [DOI] [PubMed] [Google Scholar]
- Fisher RA. On the “probable error” of a coefficient of correlation deduced from a small sample. Metron. 1921;1:3–32. [Google Scholar]
- Fjell AM, Walhovd KB. Structural brain changes in aging: courses, causes and cognitive consequences. Rev Neurosci. 2010;21:187–221. doi: 10.1515/revneuro.2010.21.3.187. [DOI] [PubMed] [Google Scholar]
- Folstein MF, Folstein SE, McHugh PR. “Mini-mental state”. A practical method for grading the cognitive state of patients for the clinician. J Psychiatr Res. 1975;12:189–198. doi: 10.1016/0022-3956(75)90026-6. [DOI] [PubMed] [Google Scholar]
- Forman SD, Cohen JD, Fitzgerald M, Eddy WF, Mintun MA, Noll DC. Improved assessment of significant activation in functional magnetic resonance imaging (fMRI): use of a cluster-size threshold. Magn Reson Med. 1995;33:636–647. doi: 10.1002/mrm.1910330508. [DOI] [PubMed] [Google Scholar]
- Fox MD, Raichle ME. Spontaneous fluctuations in brain activity observed with functional magnetic resonance imaging. Nat Rev Neurosci. 2007;8:700–711. doi: 10.1038/nrn2201. [DOI] [PubMed] [Google Scholar]
- Fox MD, Snyder AZ, Vincent JL, Raichle ME. Intrinsic fluctuations within cortical systems account for intertrial variability in human behavior. Neuron. 2007;56:171–184. doi: 10.1016/j.neuron.2007.08.023. [DOI] [PubMed] [Google Scholar]
- Grady CL. Cognitive neuroscience of aging. Ann N Y Acad Sci. 2008;1124:127–144. doi: 10.1196/annals.1440.009. [DOI] [PubMed] [Google Scholar]
- Grady CL, Grigg O, Ng C. Age differences in default and reward networks during processing of personally relevant information. Neuropsychologia. 2012;50:1682–1697. doi: 10.1016/j.neuropsychologia.2012.03.024. [DOI] [PMC free article] [PubMed] [Google Scholar]
- Grady CL, Protzner AB, Kovacevic N, Strother SC, Afshin-Pour B, Wojtowicz M, Anderson JA, Churchill N, McIntosh AR. A multivariate analysis of age-related differences in default mode and task-positive networks across multiple cognitive domains. Cereb Cortex. 2010;20:1432–1447. doi: 10.1093/cercor/bhp207. [DOI] [PMC free article] [PubMed] [Google Scholar]
- Greicius MD, Krasnow B, Reiss AL, Menon V. Functional connectivity in the resting brain: a network analysis of the default mode hypothesis. Proc Natl Acad Sci USA. 2003;100:253–258. doi: 10.1073/pnas.0135058100. [DOI] [PMC free article] [PubMed] [Google Scholar]
- Greicius MD, Srivastava G, Reiss AL, Menon V. Default-mode network activity distinguishes Alzheimer’s disease from healthy aging: evidence from functional MRI. Proc Natl Acad Sci U S A. 2004;101:4637–4642. doi: 10.1073/pnas.0308627101. [DOI] [PMC free article] [PubMed] [Google Scholar]
- Hafkemeijer A, van der Grond J, Rombouts SA. Imaging the default mode network in aging and dementia. Biochim Biophys Acta. 2012;1822:431–441. doi: 10.1016/j.bbadis.2011.07.008. [DOI] [PubMed] [Google Scholar]
- He J, Carmichael O, Fletcher E, Singh B, Iosif AM, Martinez O, Reed B, Yonelinas A, Decarli C. Influence of functional connectivity and structural MRI measures on episodic memory. Neurobiol Aging. 2012;33:2612–2620. doi: 10.1016/j.neurobiolaging.2011.12.029. [DOI] [PMC free article] [PubMed] [Google Scholar]
- Hedden T, Van Dijk KR, Becker JA, Mehta A, Sperling RA, Johnson KA, Buckner RL. Disruption of functional connectivity in clinically normal older adults harboring amyloid burden. J Neurosci. 2009;29:12686–12694. doi: 10.1523/JNEUROSCI.3189-09.2009. [DOI] [PMC free article] [PubMed] [Google Scholar]
- Hommel B, Li KZ, Li SC. Visual search across the life span. Dev Psychol. 2004;40:545–558. doi: 10.1037/0012-1649.40.4.545. [DOI] [PubMed] [Google Scholar]
- Laird AR, Fox PM, Eickhoff SB, Turner JA, Ray KL, McKay DR, Glahn DC, Beckmann CF, Smith SM, Fox PT. Behavioral interpretations of intrinsic connectivity networks. J Cogn Neurosci. 2011;23:4022–4037. doi: 10.1162/jocn_a_00077. [DOI] [PMC free article] [PubMed] [Google Scholar]
- Leber AB, Egeth HE. It’s under control: Top-down search strategies can override attentional capture. Psychon Bull Rev. 2006;13:132–138. doi: 10.3758/bf03193824. [DOI] [PubMed] [Google Scholar]
- Lustig C, Snyder AZ, Bhakta M, O’Brien KC, McAvoy M, Raichle ME, Morris JC, Buckner RL. Functional deactivations: change with age and dementia of the Alzheimer type. Proc Natl Acad Sci U S A. 2003;100:14504–14509. doi: 10.1073/pnas.2235925100. [DOI] [PMC free article] [PubMed] [Google Scholar]
- Madden DJ. Speed and timing of behavioral processes. In: Birren JE, Schaie KW, editors. Handbook of the psychology of aging. Academic Press; San Diego, CA: 2001. pp. 288–312. [Google Scholar]
- Madden DJ. Aging and visual attention. Curr Dir Psychol Sci. 2007;16:70–74. doi: 10.1111/j.1467-8721.2007.00478.x. [DOI] [PMC free article] [PubMed] [Google Scholar]
- Madden DJ, Bennett IJ, Burzynska A, Potter GG, Chen NK, Song AW. Diffusion tensor imaging of cerebral white matter integrity in cognitive aging. Biochim Biophys Acta. 2012;1822:386–400. doi: 10.1016/j.bbadis.2011.08.003. [DOI] [PMC free article] [PubMed] [Google Scholar]
- Madden DJ, Gottlob LR, Allen PA. Adult age differences in visual search accuracy: attentional guidance and target detectability. Psychol Aging. 1999;14:683–694. doi: 10.1037//0882-7974.14.4.683. [DOI] [PubMed] [Google Scholar]
- Madden DJ, Spaniol J, Bucur B, Whiting WL. Age-related increase in top-down activation of visual features. Q J Exp Psychol (Colchester) 2007;60:644–651. doi: 10.1080/17470210601154347. [DOI] [PMC free article] [PubMed] [Google Scholar]
- Madden DJ, Whiting WL. Age-related changes in visual attention. In: Costa PT, Siegler IC, editors. Recent advances in psychology and aging. Elsevier; Amsterdam: 2004. pp. 41–88. [Google Scholar]
- McAvinue LP, Habekost T, Johnson KA, Kyllingsbaek S, Vangkilde S, Bundesen C, Robertson IH. Sustained attention, attentional selectivity, and attentional capacity across the lifespan. Atten Percept Psychophys. 2012 doi: 10.3758/s13414-012-0352-6. [DOI] [PubMed] [Google Scholar]
- McKeown MJ, Makeig S, Brown GG, Jung TP, Kindermann SS, Bell AJ, Sejnowski TJ. Analysis of fMRI data by blind separation into independent spatial components. Hum Brain Mapp. 1998;6:160–188. doi: 10.1002/(SICI)1097-0193(1998)6:3<160::AID-HBM5>3.0.CO;2-1. [DOI] [PMC free article] [PubMed] [Google Scholar]
- Meier TB, Desphande AS, Vergun S, Nair VA, Song J, Biswal BB, Meyerand ME, Birn RM, Prabhakaran V. Support vector machine classification and characterization of age-related reorganization of functional brain networks. Neuroimage. 2012a;60:601–613. doi: 10.1016/j.neuroimage.2011.12.052. [DOI] [PMC free article] [PubMed] [Google Scholar]
- Meier TB, Wildenberg JC, Liu J, Chen J, Calhoun VD, Biswal BB, Meyerand ME, Birn RM, Prabhakaran V. Parallel ICA identifies sub-components of resting state networks that covary with behavioral indices. Front Hum Neurosci. 2012b;6:281. doi: 10.3389/fnhum.2012.00281. [DOI] [PMC free article] [PubMed] [Google Scholar]
- Park DC, Polk TA, Hebrank AC, Jenkins LJ. Age differences in default mode activity on easy and difficult spatial judgment tasks. Front Hum Neurosci. 2010;3:75. doi: 10.3389/neuro.09.075.2009. [DOI] [PMC free article] [PubMed] [Google Scholar]
- Plude DJ, Doussard-Roosevelt JA. Aging, selective attention, and feature integration. Psychol Aging. 1989;4:98–105. doi: 10.1037/0882-7974.4.1.98. [DOI] [PubMed] [Google Scholar]
- Raichle ME, Snyder AZ. A default mode of brain function: a brief history of an evolving idea. Neuroimage. 2007;37:1083–1090. doi: 10.1016/j.neuroimage.2007.02.041. discussion 1097–1089. [DOI] [PubMed] [Google Scholar]
- Raz N. The aging brain observed in vivo: Differential changes and their modifiers. In: Cabeza R, Nyberg L, Park D, editors. Cognitive neuroscience of aging: Linking cognitive and cerebral aging. Oxford University Press; Oxford: 2005. pp. 19–57. [Google Scholar]
- Salat DH. The declining infrastructure of the aging brain. Brain Connect. 2011;1:279–293. doi: 10.1089/brain.2011.0056. [DOI] [PMC free article] [PubMed] [Google Scholar]
- Salthouse TA. Speed of behavior and its implications for cognition. In: Birren JE, Schaie KW, editors. Handbook of the psychology of aging. Van Nostrand Reinhold; New York: 1985. pp. 400–426. [Google Scholar]
- Salvador R, Suckling J, Coleman MR, Pickard JD, Menon D, Bullmore E. Neurophysiological architecture of functional magnetic resonance images of human brain. Cereb Cortex. 2005;15:1332–1342. doi: 10.1093/cercor/bhi016. [DOI] [PubMed] [Google Scholar]
- Seeley WW, Menon V, Schatzberg AF, Keller J, Glover GH, Kenna H, Reiss AL, Greicius MD. Dissociable intrinsic connectivity networks for salience processing and executive control. J Neurosci. 2007;27:2349–2356. doi: 10.1523/JNEUROSCI.5587-06.2007. [DOI] [PMC free article] [PubMed] [Google Scholar]
- Shmuel A, Leopold DA. Neuronal correlates of spontaneous fluctuations in fMRI signals in monkey visual cortex: Implications for functional connectivity at rest. Hum Brain Mapp. 2008;29:751–761. doi: 10.1002/hbm.20580. [DOI] [PMC free article] [PubMed] [Google Scholar]
- Shmuel A, Yacoub E, Pfeuffer J, Van de Moortele PF, Adriany G, Hu X, Ugurbil K. Sustained negative BOLD, blood flow and oxygen consumption response and its coupling to the positive response in the human brain. Neuron. 2002;36:1195–1210. doi: 10.1016/s0896-6273(02)01061-9. [DOI] [PubMed] [Google Scholar]
- Shulman GL, McAvoy MP, Cowan MC, Astafiev SV, Tansy AP, d’Avossa G, Corbetta M. Quantitative analysis of attention and detection signals during visual search. J Neurophysiol. 2003;90:3384–3397. doi: 10.1152/jn.00343.2003. [DOI] [PubMed] [Google Scholar]
- Tomasi D, Volkow ND. Aging and functional brain networks. Mol Psychiatry. 2012;17:549–558. doi: 10.1038/mp.2011.81. [DOI] [PMC free article] [PubMed] [Google Scholar]
- Tzourio-Mazoyer N, Landeau B, Papathanassiou D, Crivello F, Etard O, Delcroix N, Mazoyer B, Joliot M. Automated anatomical labeling of activations in SPM using a macroscopic anatomical parcellation of the MNI MRI single-subject brain. Neuroimage. 2002;15:273–289. doi: 10.1006/nimg.2001.0978. [DOI] [PubMed] [Google Scholar]
- van den Heuvel MP, Hulshoff Pol HE. Exploring the brain network: a review on resting-state fMRI functional connectivity. Eur Neuropsychopharmacol. 2010;20:519–534. doi: 10.1016/j.euroneuro.2010.03.008. [DOI] [PubMed] [Google Scholar]
- Van Dijk KR, Hedden T, Venkataraman A, Evans KC, Lazar SW, Buckner RL. Intrinsic functional connectivity as a tool for human connectomics: theory, properties, and optimization. J Neurophysiol. 2010;103:297–321. doi: 10.1152/jn.00783.2009. [DOI] [PMC free article] [PubMed] [Google Scholar]
- Vincent JL, Kahn I, Snyder AZ, Raichle ME, Buckner RL. Evidence for a frontoparietal control system revealed by intrinsic functional connectivity. J Neurophysiol. 2008;100:3328–3342. doi: 10.1152/jn.90355.2008. [DOI] [PMC free article] [PubMed] [Google Scholar]
- Wechsler D. Wechsler adult intelligence scale-revised. 1981. [Google Scholar]
- Whiting WL, Madden DJ, Pierce TW, Allen PA. Searching from the top down: ageing and attentional guidance during singleton detection. Q J Exp Psychol A. 2005;58:72–97. doi: 10.1080/02724980443000205. [DOI] [PMC free article] [PubMed] [Google Scholar]
- Wolfe JM, Butcher SJ, Lee C, Hyle M. Changing your mind: on the contributions of top-down and bottom-up guidance in visual search for feature singletons. J Exp Psychol Hum Percept Perform. 2003;29:483–502. doi: 10.1037/0096-1523.29.2.483. [DOI] [PubMed] [Google Scholar]
- Yan L, Zhuo Y, Wang B, Wang DJ. Loss of coherence of low frequency fluctuations of BOLD fMRI in visual cortex of healthy aged subjects. Open Neuroimag J. 2011;5:105–111. doi: 10.2174/1874440001105010105. [DOI] [PMC free article] [PubMed] [Google Scholar]
- Yeo BT, Krienen FM, Sepulcre J, Sabuncu MR, Lashkari D, Hollinshead M, Roffman JL, Smoller JW, Zollei L, Polimeni JR, Fischl B, Liu H, Buckner RL. The organization of the human cerebral cortex estimated by intrinsic functional connectivity. J Neurophysiol. 2011;106:1125–1165. doi: 10.1152/jn.00338.2011. [DOI] [PMC free article] [PubMed] [Google Scholar]
- Ystad M, Hodneland E, Adolfsdottir S, Haasz J, Lundervold AJ, Eichele T, Lundervold A. Cortico-striatal connectivity and cognition in normal aging: A combined DTI and resting state fMRI study. Neuroimage. 2011;55:24–31. doi: 10.1016/j.neuroimage.2010.11.016. [DOI] [PubMed] [Google Scholar]
- Zhou J, Gennatas ED, Kramer JH, Miller BL, Seeley WW. Predicting regional neurodegeneration from the healthy brain functional connectome. Neuron. 2012;73:1216–1227. doi: 10.1016/j.neuron.2012.03.004. [DOI] [PMC free article] [PubMed] [Google Scholar]
Associated Data
This section collects any data citations, data availability statements, or supplementary materials included in this article.