

Abstract
Cognitive control is a critical executive function of the human brain. Many studies have combined general linear modeling and the stop signal task (SST) to delineate the component processes of cognitive control. For instance, by contrasting stop success (SS) and stop error (SE) trials in the SST, investigators examined the neural processes underlying stop signal inhibition (SS > SE) and error processing (SE > SS). To complement this parameterized approach, here, we employed a data‐driven method—independent component analysis (ICA)—to elucidate neural networks and the relationship between neural networks subserving cognitive control. In 59 adults performing the SST during fMRI, we characterized six independent components with ICA. These functional networks, temporally sorted for go success, SS, and SE trials as the events of interest, included a motor cortical network for motor preparation and execution; a right fronto‐parietal network for attentional monitoring; a left fronto‐parietal network for response inhibition; a midline cortico‐subcortical network for error processing; a cuneus–precuneus network for behavioral engagement; and a “default” network for self‐referential processing. Across subjects the event‐associated weights of these functional networks showed a distinct pattern of correlation. These results provide new insight into the component processes of cognitive control. Hum Brain Mapp, 2012. © 2011 Wiley Periodicals, Inc.
Keywords: fMRI, neuroimaging, stop signal, nogo, inhibitory control, neural network, ICA
INTRODUCTION
The neural bases of cognitive control have long been a focus of attention in cognitive neuroscience. Many behavioral tasks are used to examine regional brain activations related to the component processes of cognitive control [Egner,2008]. For instance, in a stop signal task (SST), participants override a prepotent motor response, monitor error, and adjust the speed of response after encountering an error. Our previous functional magnetic resonance imaging (fMRI) studies of the SST attempted to elucidate regional brain activations involved in these component processes [Hendrick et al., 2010; Ide and Li, 2011; Li et al.,2006,2008a,b,c,2009a].
These earlier findings are obtained with general linear modeling (GLM) of the time series of blood oxygenation level–dependent (BOLD) signals evoked by events of interest in the SST. For instance, by contrasting stop error (SE) and stop success (SS) trials, we observed greater activation in the dorsal anterior cingulate cortex (ACC) and the supplementary motor area (SMA) and attributed these regional activations to error processing [Li et al.,2008c]. On the other hand, many human imaging studies and unit recordings of nonhuman primates have suggested a role of the SMA in motor preparation and execution [Colebatch,2007; Connolly et al.,2007; Dum and Strick,2002]. The SMA would thus show greater activation during SE as compared to SS trials because of increased motor preparation/execution rather than error detection. An additional possibility is that the SMA is involved in both of these processes. The difficulty in ascertaining a specific role for regional brain activations on the basis of the “subtraction scheme” of GLM is well‐known in the literature [Friston et al.,1996; Logothetis,2008; Poeppel,1996; Price and Friston,1997]. For instance, in summarizing the inconsistency between imaging studies of phonological processing, Poeppel [1996] noted that one fundamental issue was related to the assumption that all cognitive processes other than the one of interest were constant between the experiment and control conditions.
A related limitation of a parameterized approach is that the observed patterns of regional brain activation only reflect the psychological constructs that investigators include in the model. Processes that are not overtly represented cannot be observed. For instance, our recent work suggested a role of the precuneus in mediating behavioral engagement [Zhang and Li,2010]. The fractional amplitude of low‐frequency fluctuation of the precuneus accounted for ∼10% of the variance in prefrontal activations during attentional monitoring and response inhibition as identified from GLM. Since behavioral engagement is not a psychological construct that could be built into the model, its cerebral processes would remain undetectable.
Independent component analysis (ICA) represents a potential tool to provide new information on these issues. As a data‐driven method, ICA discovers hidden factors from a set of measurements such that the sources of the observed data are maximally independent [Calhoun and Adali,2006; Calhoun et al.,2001a,2002,2009; Lange et al.,1999; McKeown et al.,1998a,b,2003]. In contrast to GLM, which requires the assumption of regional hemodynamic responses and a design matrix (set of regressors), ICA decomposes the time series into explanatory variables with a single assumption that these variables are independent. Because it requires no prior knowledge, ICA is potentially helpful in identifying nontrivial neural networks or components of interest. For instance, in the first application of ICA to fMRI, McKeown et al. [1998b] separated task‐related activities from confounding activities that represented physiological pulsations, head motion, or machine noise. In particular, ICA identified not only task‐related component activities during a task block but also transient components, which activated only at the onset of the task blocks. By comparing the performance of nine analytic methods applied to simulated and real fMRI data, Lange et al. [1999] demonstrated that “multivoxel” procedures such as ICA could identify loci of activation that eluded “single‐voxel” procedures. Another study reported that component hemodynamic responses varied substantially across sessions, subjects, and brain areas, posing a potential problem for GLM [Duann et al.,2002]. Calhoun et al. [2001a] reported that ICA but not GLM could detect activation of the primary motor cortex (PMC) in a visual perception task, potentially because the hemodynamic responses of the PMC did not follow the canonical profile as implemented in GLM. Taken together, these studies suggested the utility of ICA in complementing GLM in fMRI data analysis.
In this study, we used ICA to identify independent networks of brain regions and aimed to characterize how different events—go success (G), SS, and SE—partake in these functional networks. We further characterized the relationships between these functional networks by examining the temporal profile of the activity during different trial types and crosscorrelating their event associations across subjects. An auxiliary aim is to address the role of the SMA in stop signal performance. We hypothesized that if greater activation of the SMA during SE as compared to SS trials resulted solely from motor preparation and execution, the SMA would belong to a cortical motor network with positive association both with G and SE trials. Alternatively, if SMA is involved in error processing, it will belong to a component with negative association with the G but positive association with SE trials.
MATERIALS AND METHODS
Subjects and Behavioral Tasks
Fifty‐nine adult healthy subjects (30 males, 22–42 years of age, all right‐handed and using their right hand to respond) from an earlier cohort participated in this study [Li et al.,2009b]. All subjects signed a written consent after details of the study were explained, in accordance to institute guidelines and procedures approved by the Yale Human Investigation Committee.
We employed a simple reaction time (RT) task in this stop signal paradigm, as described in detail in our previous studies [Li et al.,2006,2008b,2009b]. Briefly, there were two trial types, “go” and “stop,” randomly intermixed. A small dot appeared on the screen to engage attention at the beginning of a go trial. After a randomized time interval (fore period) anywhere between 1 and 5 s, the dot turned into a circle, prompting the subjects to quickly press a button. The circle vanished at button press or after 1 s had elapsed, whichever came first, and the trial terminated. A premature button press prior to the appearance of the circle also terminated the trial. Three quarters of all trials were go trials. In a stop trial, an additional “X,” the “stop” signal, appeared after the go signal. The subjects were told to withhold button press upon seeing the stop signal. Likewise, a trial terminated at button press or when 1 s had elapsed since the appearance of the stop signal. The stop trials constituted the remaining one quarter of the trials. There was an intertrial interval of 2 s. The stop signal delay (SSD) started at 200 ms and varied from one stop trial to the next according to a staircase procedure: if the subject succeeded in withholding the response, the SSD increased by 64 ms, making it more difficult to succeed again in the next stop trial; conversely, if a subject failed, SSD decreased by 64 ms [De Jong et al.,1990; Levitt,1971], making it easier for the next stop trial. With the staircase procedure, a “critical” SSD could be computed that represents the time delay required for the subject to succeed in withholding a response half of the time in the stop trials [Levitt,1971]. Subjects were instructed to respond to the go signal quickly while keeping in mind that a stop signal could come up in a small number of trials. Prior to the fMRI study, each subject had a practice session outside the scanner. Each subject completed four 10‐min runs of the task with the SSD updated manually across runs. Depending on the actual stimulus timing (e.g., trials varied in fore‐period duration) and speed of response, the total number of trials varied slightly across subjects in an experiment. With the staircase procedure, we anticipated that the subjects would succeed in withholding their response in ∼50% of the stop trials. We describe the algorithm to compute the stop signal RT and summarize behavioral performance in the Supporting Information.
Imaging Protocol
Conventional T1‐weighted spin echo sagittal anatomical images were acquired for slice localization using a 3T scanner (Siemens Trio). Anatomical images of the functional slice locations were next obtained with spin echo imaging in the axial plane parallel to the AC–PC line with TR = 300 ms, TE = 2.5 ms, bandwidth = 300 Hz/pixel, flip angle = 60°, field of view = 220 × 220 mm2, matrix = 256 × 256, 32 slices with slice thickness = 4 mm, and no gap. Functional, blood oxygen level–dependent (BOLD) signals were then acquired with a single‐shot gradient echo echoplanar imaging (EPI) sequence. Thirty‐two axial slices parallel to the AC–PC line covering the whole brain were acquired with TR = 2,000 ms, TE = 25 ms, bandwidth = 2,004 Hz/pixel, flip angle = 85°, field of view = 220 × 220 mm2, matrix = 64 × 64, slice thickness = 4 mm, and no gap.
Spatial Preprocessing
Data were analyzed with Statistical Parametric Mapping (SPM2, Wellcome Department of Imaging Neuroscience, University College London, United Kingdom). Images from the first five TRs at the beginning of each trial were discarded to enable the signal to achieve steady‐state equilibrium between RF pulsing and relaxation. Images of each individual subject were first corrected for slice timing, realigned (motion‐corrected), and unwarped [Andersson et al.,2001; Hutton et al.,2002]. A mean functional image volume was constructed for each subject for each run from the realigned image volumes. These mean images were normalized to an Montreal Neurological Institute EPI template with affine registration followed by nonlinear transformation [Ashburner and Friston,1999; Friston et al.,1995]. The normalization parameters determined for the mean functional volume were then applied to the corresponding functional image volumes for each subject. Finally, images were smoothed with a Gaussian kernel of 10 mm at full width at half maximum.
ICA and Temporal Sorting
Preprocessed time series were analyzed with a group ICA algorithm (GIFT, http://icatb.sourceforge.net/, version 1.3g) to identify spatially independent and temporally coherent networks [Calhoun et al.,2001b,2009]. ICA is a data‐driven multivariate method that identifies distinct groups of brain regions with the same temporal pattern of hemodynamic signal change. Briefly, consider an observed series of brain images x = [x 1,x 1,…,x m]T, which can be “decomposed” by ICA as
| (1) |
where s = [s 1,s 1,…,s n]T is a series of brain images that refer to the independent sources and A M×N is an unknown mixing matrix. ICA is to estimate a demixing matrix W N×M such that estimated brain images y given by
| (2) |
is a good approximation to the sources s. In comparison, in GLM, the observed brain images x can be described as
| (3) |
where G M×N is the design matrix based on a priori information. Therefore, compared to GLM, ICA does not require any prior knowledge, with the demixing matrix estimated based only on the “independence” assumption.
The data for all participants were reduced through principal component analysis [Calhoun et al.,2001b] and separated into 24 maximally independent components with an infomax algorithm [Bell and Sejnowski,1995]. The dimensionality was determined by the modified minimal description length criteria as implemented in GIFT and averaged across subjects [Li et al.,2007a]. A time course for each component and its corresponding spatial map, which represents a real contribution to this component time course, was obtained. Finally, component time courses and spatial maps, which captured individual differences in the expression of the ICA‐derived component, were back‐reconstructed for each participant [Calhoun et al.,2001b; Meda et al.,2009b].
In order to examine the task relevance of each component, the component time courses were temporally sorted for G, SS, and SE trials, according to the strength of correlation between the component time courses and the time course of each of these events as embodied in the GLM. Briefly, a linear regression was applied to participants' session data (four sessions per subject), with y = reference time course (event onsets convolved with the canonical hemodynamic response):
| (4) |
where X is the time course of the component to be sorted and beta weight (β) is the estimated parameter. Thus, this association estimate—beta weight—which represented the degree of synchrony between the component and reference time courses, indicated the extent of engagement of the network during the task event [Meda et al.,2009b]. Positive and negative beta weights each indicated positive and negative correlation with the event. We averaged the beta weights across all four sessions each for G, SS, and SE for individual subjects. Then the components were sorted according to the R‐square statistic, which represented the overall association to each component time course. These beta weights were examined with one‐sample t test against zero. Component loadings that differed significantly from zero indicated an association with that event. To examine the relationship of component networks under different conditions, linear regressions were applied to beta weights across all the participants between components.
We also computed the event‐related averages (Z scores) over a window of 32 s of the component time course. Each event‐related average depicts the level of activation for that particular component over the course of a typical hemodynamic response. We computed single trial amplitude to verify these results on event averages [Eichele et al.,2008]. Details of the method are presented in the Supporting Information.
RESULTS
Brain Networks of Cognitive Control
We ran group ICA 50 times using ICASSO [Himberg et al.,2004] and used cluster quality index (I q) of the selected components to assess the repeatability of ICA components (Supporting Information Fig. 1). We identified 24 independent components, each depicting a distinct network of brain regions that have the same pattern of hemodynamic change over time (Supporting Information Results, Supporting Information Table I, and Supporting Information Figs. 2–5). Following previous studies, we relied on visualization and/or prior knowledge [Calhoun et al.,2002,2004a,b] as well as the level of statistical significance [Kim et al.,2009; McKeown et al.,1998b; Meda et al.,2009a] to select task‐related components for further investigation. We first discarded noise‐related components which showed spatial correlation greater than r 2 = 0.02 for white matter or r 2 = 0.05 for the space of cerebrospinal fluid. We then tested the significance level of beta weights for each remaining component under each condition. For components surviving P < 0.05, we selected those that were among the top two rank ordered components for G, SS, and SE trials. These five independent components were motor cortical network (no. 11), right fronto‐parietal network (no. 4), left fronto‐parietal network (no. 8), midline cortical–subcortical network (no. 20), and cuneus–precuneus network (no. 3). On the basis of prior knowledge, a sixth component—the “default” network (no. 10)—was also selected. The six components all showed an I q greater than 0.9 (Supporting Information Fig. 1).
Figures 1, 2, 3, 4, 5, 6 showed the components' spatial structures (a), associated beta weights (b), and event averages of G, SS, and SE trials (c) as computed from the component time courses. Table I shows the results of one‐sample t test of the beta weights for each trial condition, separately for each of the six components. We tentatively named each of the components according to the areas that showed a positive “activation,” with brain areas identified by references to an atlas [Duvernoy,1999].
Figure 1.

(a) Motor cortical network (no. 11) identified from ICA, with regions with positive (warm color) and negative (cool color) signal change. Regions shown are thresholded at P < 0.000001 (n = 59), corrected for familywise error (FWE) of multiple comparisons. (b) and (c) show the beta weights and event averages of G, SS, and SE trials for this component network. [Color figure can be viewed in the online issue, which is available at wileyonlinelibrary.com.]
Figure 2.

(a) Right fronto‐parietal network (no. 4) identified from ICA, with regions with positive (warm color) and negative (cool color) signal change. Regions shown are thresholded at P < 0.000001 (n = 59), corrected for FWE of multiple comparisons. (b) and (c) show the beta weights and event averages of G, SS, and SE trials for this component network. [Color figure can be viewed in the online issue, which is available at wileyonlinelibrary.com.]
Figure 3.

(a) Left fronto‐parietal network (no. 8) identified from ICA, with regions with positive (warm color) and negative (cool color) signal change. Regions shown are thresholded at P < 0.000001 (n = 59), corrected for FWE of multiple comparisons. (b) and (c) show the beta weights and event averages of G, SS, and SE trials for this component network. [Color figure can be viewed in the online issue, which is available at wileyonlinelibrary.com.]
Figure 4.
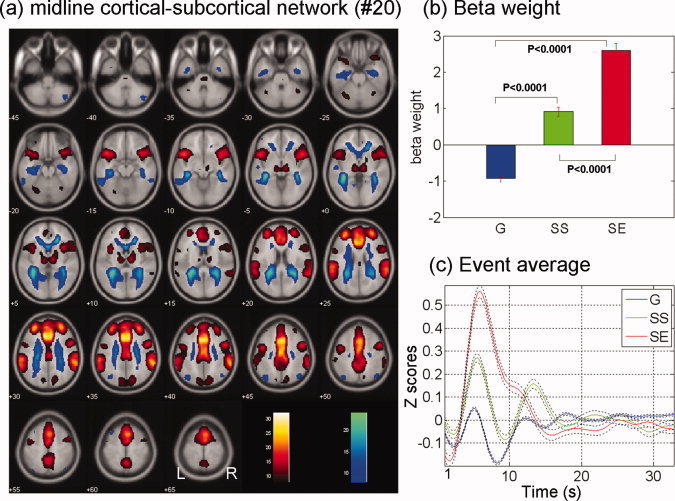
(a) Midline cortico‐subcortical network (no. 20) identified from ICA, with regions with positive (warm color) and negative (cool color) signal change. Regions shown are thresholded at P < 0.000001 (n = 59), corrected for FWE of multiple comparisons. (b) and (c) show the beta weights and event averages of G, SS, and SE trials for this component network. [Color figure can be viewed in the online issue, which is available at wileyonlinelibrary.com.]
Figure 5.
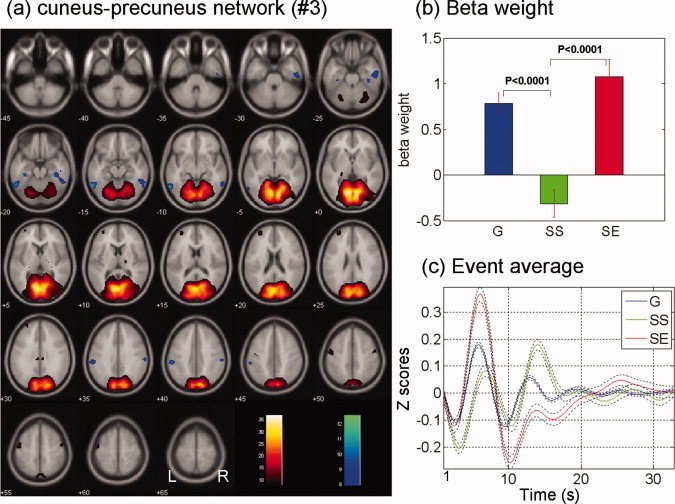
(a) Cuneus–precuneus network (no. 3) identified from ICA, with regions with positive (warm color) and negative (cool color) signal change. Regions shown are thresholded at P < 0.000001 (n = 59), corrected for FWE of multiple comparisons. (b) and (c) show the beta weights and event averages of G, SS, and SE trials for this component network. [Color figure can be viewed in the online issue, which is available at wileyonlinelibrary.com.]
Figure 6.
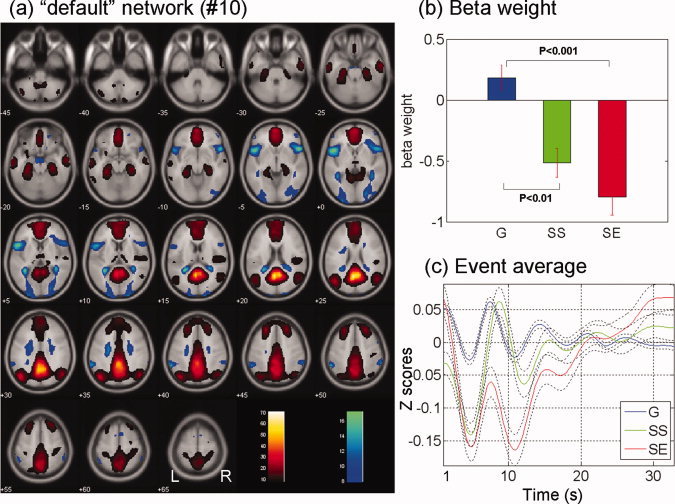
(a) Default network (no. 10) identified from ICA, with regions with positive (warm color) and negative (cool color) signal change. Regions shown are thresholded at P < 0.000001 (n = 59), corrected for FWE of multiple comparisons. (b) and (c) show the beta weights and event averages of G, SS, and SE trials for this component network. [Color figure can be viewed in the online issue, which is available at wileyonlinelibrary.com.]
Table I.
Temporal sorting for G, SS, and SE trials: Beta weights (β)
| Component | β: Mean ± SD | One‐sample t test: P value* | ||||
|---|---|---|---|---|---|---|
| G | SS | SE | G | SS | SE | |
| Motor cortical network (no. 11) | 1.46 ± 0.78 | −1.21 ± 1.04 | −0.51 ± 1.43 | <0.0001 | <0.0001 | 0.009 |
| Right fronto‐parietal network (no. 4) | −1.33 ± 0.78 | 1.91 ± 1.01 | 0.55 ± 1.27 | <0.0001 | <0.0001 | 0.002 |
| Left fronto‐parietal network (no. 8) | −1.01 ± 0.91 | 1.06 ± 1.08 | −0.23 ± 1.20 | <0.0001 | <0.0001 | 0.1 |
| Midline cortico‐subcortical network (no. 20) | −0.92 ± 0.82 | 0.91 ± 0.99 | 2.59 ± 1.51 | <0.0001 | <0.0001 | <0.0001 |
| Cuneus–precuneus network (no. 3) | 0.78 ± 0.91 | −0.32 ± 1.15 | 1.08 ± 1.42 | <0.0001 | 0.04 | <0.0001 |
| Default network (no. 10) | 0.18 ± 0.81 | −0.52 ± 0.90 | −0.79 ± 1.15 | 0.09 | <0.0001 | <0.0001 |
One‐sample t test to determine whether these beta weights are statistically different from zero. All P values were uncorrected. We did not correct for the total number of comparisons because the beta weights were not all independent between trial conditions in the same component or between components for the same trial condition.
Motor Cortical Network (Component No. 11)
Accounting for the most variance of the G trials, the motor cortical network included activation of the left/right precentral gyrus, left/right postcentral gyrus, and left/right SMA and “deactivation” of the precuneus, bilateral fronto‐parieto‐temporal cortex, bilateral insula, and the ventromedial prefrontal cortex. This network showed positive correlation with G trials as well as negative correlation with SS and SE trials, although the association with SE trials was only marginally significant (Fig. 1; Table I). During the SS trials, in which subjects withheld the button press successfully, motor cortical activity went down from the beginning, while during the SE trials, in which subjects failed to withhold the response, the motor cortical network had an initial activation followed by deactivation. Note that SE trials showed a negative beta weight despite its involving a motor response.
The Right (Component No. 4) and Left (Component No. 8) fronto‐parietal Network
The right fronto‐parietal network (no. 4, Fig. 2), accounting for the most variance for the SS trials, included bilateral inferior parietal lobules including the angular and supramarginal gyri, right superior, middle, and inferior frontal cortices, right middle temporal gyrus, medial superior frontal cortex including the anterior pre‐SMA, and part of the precuneus. The deactivated component of this network included the left visual and anterolateral frontal cortices, as well as the part of the rostral and dorsal anterior cingulate cortices and part of the posterior cingulate cortex. This network showed a positive correlation with SS trials as well as a negative correlation with G trials. The network also showed a positive but only marginally significant correlation with SE trials (Table I). As can be observed from the event averages, the network deactivated from the beginning during G trials. Although SS and SE trials were both positively correlated with the right fronto‐parietal network, SE trials involved an initial deactivation followed by activation of a lesser magnitude, as compared to SS trials.
The left fronto‐parietal network (no. 8, Fig. 3) appeared to be a left‐hemipheric mirror image of the right frontoparietal network (no. 4), including a positive component in the left inferior parietal lobule, superior temporal gyrus, middle frontal and dorsolateral prefrontal cortices, and caudate head. The deactivated component included the right anterolateral prefrontal cortex, rostral and dorsal ACC, as well as the midcingulate and posterior cingulate cortices and the precuneus. This network is negatively and positively associated with G and SS trials, respectively, as with the right fronto‐parietal network. However, unlike the latter, the left fronto‐parietal network is associated with a marginally significant negative beta weight during SE trials (Table I). Compared to the right fronto‐parietal network, the event average of the left fronto‐parietal network significantly lagged for both SS (peak time of no. 8: 8.54 ± 4.95 s, mean ± standard deviation, across subjects; peak time of no. 4: 6.44 ± 2.33 s; P = 0.003, two‐tailed paired t test) and SE (peak time of no. 8: 13.23 ± 7.12 s and peak time of no. 4: 9.79 ± 4.75 s, P = 0.0007, two‐tailed paired t test) trials.
Midline Cortico‐subcortical Network (Component No. 20)
The midline cortico‐subcortical network (no. 20, Fig. 4), accounting for most variance of the SE trials, included rostral and dorsal anterior cingulate cortices and SMA, bilateral anterolateral frontal cortices, inferior parietal and superior temporal cortices, and insula, as well as right middle/inferior frontal cortices. This network also included the regions in the thalamus and midbrain, putatively in the area of ventral tegmental area and substantia nigra. The deactivated component included bilateral dorsolateral prefrontal and visual cortices. This network showed a high positive temporal correlation with the SE trials and a positive but significantly smaller correlation with the SS trials, as compared to the SE trials. The network showed a negative correlation with the G trials.
Cuneus–Precuneus (Component No. 3) and the “Default” (Component No. 10) Network
The cuneus–precuneus network (no. 3), including bilateral lingual gyrus, cuneus, and precuneus, was positively associated with G and SE trials but not significantly associated with SS trials (Fig. 5; Table I). Its deactivated component included small restricted areas in the middle and superior temporal cortices.
The default network (no. 10) included the posterior cingulate cortex, precuneus, ventromedial prefrontal cortex, and inferior parietal lobule as the “activation” component (Fig. 6). Its deactivated component included bilateral occipital gyri, insula, and inferior frontal gyri. The network showed a negative association with SS and SE trials, but was not significantly associated with the G trials, consistent with an extensive body of literature that the default network activate and deactivate, respectively, when participants were engaged in self‐referential processing and in responding to events posed externally [Andrews‐Hanna et al.,2010; Fox and Raichle,2007; Raichle et al.,2001].
Single Trials Amplitude Analyses and Correlations With Behavioral Performance
We also performed Single Trial Amplitude analysis to confirm the results on event averages for each of the six components (Supporting Information Methods and Supporting Information Figs. 6–11). We correlated behavioral data in SST with the beta weights of each component across 59 subjects and did not observe any significant associations after correcting for multiple comparisons (Supporting Information Table II). We also compared between individuals grouped with a median split for all of the behavioral parameters [GO%, SS%, median GO RT, stop signal RT (SSRT), posterror slowing, and FP effect] as in a previous study [Li et al.,2006] and did not observe any significant differences in any of the beta weights of the six components (all Ps >0.1, uncorrected).
Interactions Between Functional Networks During Stop Signal Performance
We crosscorrelated beta weights between different component networks for the same event and between different events for the same component network in linear regressions. The statistics of correlation were shown in Supporting Information Tables 3–8. Figure 7 shows those correlations that were significant at an arbitrary threshold of P < 0.01, uncorrected, highlighting those significant at P < 0.001 and P < 0.0001. Several findings were noteworthy. First, the beta weights of G trials were correlated across component networks. For instance, individuals who showed a high temporal association of G trials with the right fronto‐parietal network (no. 4) also did so with the midline cortico‐subcortical network (no. 20), although these networks appear to involve distinct functions. These correlations did not reflect the extent of spatial overlap between the networks. For instance, the midline cortico‐subcortical network overlapped substantially both with the motor cortical and with the default networks, but the correlations between them did not survive P < 0.01. Furthermore, a positive correlation was obtained between networks that showed positive and negative beta weights for G trials (e.g., cuneus–precuneus and midline cortico‐subcortical networks). Thus, these positive correlations between different components perhaps suggested that the G trials represent a baseline of stop signal performance and that individuals partake in one network to a larger extent will do so in all other networks. Engagement during the SS and SE trials would reflect deviation from this baseline; for instance, those who showed greater association with midline cortico‐subcortical network during G trials would show less association with the same network during SS or SE trials. Figure 7 shows that, indeed, with the exception of the motor cortical network, these components were all associated with a negative correlation between G and SS/SE trials across subjects.8
Figure 7.

Pairwise linear regressions across all 59 subjects between beta weights of different components and different trial types. Correlations that were significant at P < 0.01 uncorrected were highlighted here with * denoting those with a P < 0.001 and ** those with a P < 0.0001, uncorrected. Red line and blue line indicate a positive and negative correlation, respectively. The numbers on the lines are the R values of linear regression. Supporting Information Tables 3–8 list the R and P values of all correlations. [Color figure can be viewed in the online issue, which is available at wileyonlinelibrary.com.]
Figure 8.

Group ICA analysis under current version of GIFT using intensity normalization, GICA3, and centering. [Color figure can be viewed in the online issue, which is available at wileyonlinelibrary.com.]
An additional observation was that these pairwise G trial–associated correlations among components did not appear to be random. Although the G trial beta weights were correlated between the right fronto‐parietal network (no. 4) and the midline cortical–subcortical network (no. 20) as well as between the midline cortical–subcortical network (no. 20) and the cuneus–precuneus network (no. 3), they were not correlated between the right fronto‐parietal network (no. 4) and the cuneus–precuneus network (no. 3) (Fig. 7; Supporting Information Table III). Similarly, the correlations between the motor cortical network (no. 11) and the cuneus–precuneus network (no. 3) and between the cuneus–precuneus network (no. 3) and the midline cortical–subcortical network (no. 20) but not between the motor cortical network (no. 11) and the midline cortical–subcortical network (no. 20) were significant. More studies are required to examine the implications of these correlations between functional components.
DISCUSSION
fronto‐parietal Networks: Attentional Monitoring Versus Response Inhibition
Showing a highly positive association with the SS trials, the right (no. 4) and left (no. 8) fronto‐parietal network both play an important role in stop signal inhibition. The right and left fronto‐parietal network are each positively and negatively associated with the SE trials, suggesting that these two components were related to different aspects of stop signal inhibition. One possibility is that the right fronto‐parietal network is involved in saliency detection, as both SS and SE trials were salient, as compared to the G trials. On the other hand, since SE trials were more salient and yet less strongly associated with this network, as compared to SS trials, saliency alone is unlikely to account for the function of the right fronto‐parietal network. As suggested by a large body of studies, an alternative explanation is that the right fronto‐parietal network is involved in attentional monitoring for the stop signal. Thus, greater activation led to SS, as compared to SE trials. For instance, Corbetta and Shulman [2002] demonstrated in numerous studies that the right inferior frontal and parietal cortices respond to infrequent and yet behaviorally relevant signals. Recent work by Hampshire et al. [2009, 2010] further indicated that these right fronto‐parietal regions activated in response to the stop signals even when motor response inhibition was not instantiated. As part of the right fronto‐parietal network, the right inferior frontal cortex (IFC) increased activation to silent counting of the stop signal, to stimulus‐instructed button press, and to withholding of button press, during different blocks of the task [Hampshire et al.,2010]. Our recent study based on connectivity analysis also suggested that the right IFC expedites response inhibition by orienting attention to the stop signal [Duann et al.,2009].
Aron et al. [2003] demonstrated that the lesion of the right IFC impaired stop signal inhibition. Consistent with the current findings, a more recent report demonstrated that lesion of the left IFC also disrupted no‐go performance in a go/no‐go task [Swick et al.,2008]. Interestingly, patients with left IFC lesions were particularly impaired when the no‐go trials were infrequent (10%), compared to when they appeared with a probability equal to the go trials. It is possible that when the no‐go signals were less frequent, the task placed a greater demand on the system responsible for instantaneous initiation of inhibitory control, in addition to the regular demand on attentional monitoring.
Our previous fMRI studies attempted to dissociate response inhibition from attentional monitoring by comparing individuals with short and long stop signal RT (SSRT) who did not differ in any other aspects of stop signal performance [Li et al.,2006,2008b]. We showed greater activation of the left‐hemispheric frontal regions including the anterior pre‐SMA and middle frontal cortices in individuals with short as compared to long SSRT. These results were replicated in a different study that compared sessions with short and long SSRT within the same individuals [Chao et al.,2009]. Encompassing these left‐hemispheric frontal areas, the left fronto‐parietal network may play a specific role in mediating motor response inhibition during the SST. Interestingly, we observed from the temporal profile of the event averages that the left fronto‐parietal network significantly lagged behind the right fronto‐parietal network. This observation accords with our recent findings from connectivity analyses that the right IFC projects to the anterior pre‐SMA to mediate stop signal inhibition [Duann et al.,2009]. More broadly, the left fronto‐parietal network and motor cortical network have a directly contrasting pattern of activation, as could be observed from the event averages; the left fronto‐parietal network activated along with deactivation of the motor cortical network during SS trials and deactivated along with the activation of the motor cortical network during G trials with the main peaks of one network's activation matching with the bottoms of the other network.
An earlier ICA study identified a right fronto‐parietal network for response inhibition during a go/no‐go task [Stevens et al.,2007]. A possible explanation was suggested by Eagle et al. [2008] who distinguished between action restraint and action cancellation. In a go/no‐go task, subjects need to respond to go signals and withhold the response to no‐go signals, while in a SST, subjects respond to go signals but must withhold the response if a stop signal is presented shortly after the go signal. Therefore, the go/no‐go task can be thought as an example of action restraint—inhibition before the response has been started, whereas the SST is an example of action cancellation—inhibition during its execution. These interpretations are in line with our current findings that the right‐hemispheric fronto‐parietal network is involved in attention to the stop signal, hence restraining action, and the left‐hemispheric fronto‐parietal network is involved in response inhibition, hence canceling action [Aron and Poldrack,2006; Schachar et al.,2007; Swick et al.,2008]. Taken together, these results suggested contrasting roles for the right and left fronto‐parietal networks with the left‐hemispheric network more directly involved in motor inhibitory control during stop signal inhibition. These considerations also indicated the importance of distinguishing between attention and inhibition in studies of go/no‐go and SSTs. For instance, transcranial magnetic stimulation of both the pre‐SMA and right frontal eye field increased SE rate and prolonged the SSRT [Chen et al.,2009; Muggleton et al.,2010]. However, it remained to be investigated whether the increase in SSRT resulted simply from an increase in error rate, which could bias the computation of SSRT.
SMA: Motor Execution/Preparation Versus Error Processing
SMA is a positive component of the motor cortical network, showing a positive and negative beta weight associated with G and SE trials, respectively. SMA is also a positive component of the midline error‐processing network, showing a negative and positive beta weight in association with G and SE trials, respectively. Thus, on the basis of beta weights, one is tempted to conclude that greater activation in SMA during the SE as compared to SS trials as observed in GLM likely reflect error processing rather than motor preparation or execution. On the other hand, SMA of the motor cortical network showed an initial activation during SE trials, suggesting that its role in motor preparation and execution could not be entirely ruled out.
Midline Cortical–Subcortical Network and Error Processing
The SE trials were associated with the midline cortico‐subcortical network with a beta weight of 2.6, substantially larger compared to a beta of 1.1 of the second ranked network (cuneus–precuneus network, no. 3), suggesting that this network is predominantly involved in error processing. An important structure in this network is the ACC, which numerous studies have implicated in cognitive control [Barch et al.,2001; Braver et al.,2001; Brown,2009; Kiehl et al.,2000; Li et al.,2007b; Ridderinkhof et al.,2004; Roelofs et al.,2006; Rubia et al.,2003; Swick and Turken,2002]. This network is also positively associated with SS trials. Thus, the current findings were consistent with the role of the ACC in detecting conflict and processing errors amidst competing responses [Braver et al.,2001; Kiehl et al.,2000; Menon et al.,2001; Rubia et al.,2003]. The subcortical structure in this network included areas in the thalamus and midbrain, which were also identified to respond to errors in our GLM study [Li et al.,2008c]. These results are consistent with a recent ICA study of the go/no‐go task [Stevens et al.,2009].
Cuneus–Precuneus and the “Default” Networks
The cuneus is a visual cortical area and, as demonstrated in recent functional connectivity analyses, is connected with cortical areas involved in visual perceptual processing [Kiviniemi et al.,2009; Smith et al.,2009]. Importantly, the visual cortices encompassed in the cuneus–precuneus network largely represented the nonfoveal visual field. Since greater attention to signals presented at one visual location could suppress cortical responses to signals at other locations, the activation of the nonfoveal representations likely suggested less attention to the go and stop signals that were presented centrally, as would occur when they were less engaged in the task [Brefczynski and DeYoe,1999; Slotnick et al.,2003; Smith et al.,2000]. Notably, our previous study suggested that task‐residual low frequency activity in the precuneus may represent a neural surrogate of task engagement [Zhang and Li,2010]. The precuneus showed greater “activation” during resting state, compared to the task‐residuals, which were derived by removing event‐evoked responses from the time series. It thus appeared to be consistent that the cuneus and precuneus were isolated in a common network to indicate behavioral engagement of the participants.
The cuneus–precuneus but not the default network was significantly and positively associated with the G trials. Furthermore, in contrast to the cuneus–precuneus network, which showed a positive association with the SE trials, the default network showed a negative association with SE trials. These results suggest a possible functional dissociation of the two networks. For instance, the cuneus–precuneus network activated during G trials, which occurred repetitively during the task. At times, the cuneus–precuneus network would deactivate when participants “deviated” from the relatively effortless routine and attentively monitored for the stop signal, which would lead to a SS if a stop signal did indeed appear. In contrast, although go trials engaged little effort, these trials continued to involve responses to an external signal and would not activate the default network.
Methodological Considerations: “Negative” Activation of the White Matter and CSF
One potential issue concerns the interpretation of the negative activations of the white matter and CSF in some components and whether one should prefilter and/or anatomically mask the time course for ICA. To our knowledge, it is unnecessary to apply filtering prior to ICA. Temporal filtering of the data will limit the number of patterns/signals that ICA could detect. By applying temporal filtering to remove the “noise,” one also had to assume that the “noise” occurs at a certain frequency band. In the GIFT toolbox, a whole brain mask was applied to eliminate nonbrain voxels by default. However, to our knowledge, investigators do not routinely apply a gray matter mask prior to ICA. (Importantly, how did the negative activations in white matter and CSF come about in component maps? With ICA, one obtains a temporally unique pattern of signal change without an explicit “baseline.” To generate a component map, this pattern of signal change needs to be written out relative to a baseline, which is usually set as the global mean signal change across all components/subjects/voxels. That is, the GIFT toolbox writes the time course data out relative to the global mean signal change across all components/subjects/voxels. Is it possible that negative activations in the white matter and CSF occur in the component maps as a result of this unknown baseline?)
CONCLUSIONS
With ICA, we identified distinct functional neural networks engaged in cognitive control during the SST. These networks characterized brain regions temporally correlated in activation and thus represented potential neural substrates subserving different processes involved in cognitive control. We wish to draw three specific conclusions from the current findings. First, the right and left fronto‐parietal networks are each primarily engaged in attentional monitoring and inhibitory control during stop signal inhibition. Second, according to the event‐associated beta weights, the SMA as part of the midline cortico‐subcortical and motor cortical network is positively and negatively, respectively, associated with SE trials, inconsistent with the hypothesis that the SMA activates to greater motor responses during SE as compared to SS trials. On the other hand, the temporal profiles of the hemodynamic responses suggested that we could not rule out a role of the SMA in motor preparation and/or execution. Third, we identified two networks each involving the precuneus and the posterior cingulate/ventromedial prefrontal cortices. Although these brain regions were within the broadly defined “default” network, the current ICA results suggested that they play distinguishable roles during the SST, in accord with recent literature.
Supporting information
Additional Supporting Information may be found in the online version of this article.
Supporting Information
Supporting Figure 1
Supporting Figure 2
Supporting Figure 3
Supporting Figure 4
Supporting Figure 5
Supporting Figure 6
Supporting Figure 7
Supporting Figure 8
Supporting Figure 9
Supporting Figure 10
Supporting Figure 11
Supporting Figure 12
Acknowledgements
We thank Dr. Jaime Ide, Dr. Sien Hu, Olivia Hendrick, and Sarah Bednarski for their many helpful discussions.
The NIH had no role in study design; in the collection, analysis, and interpretation of data; in the writing of the report; or in the decision to submit the paper for publication.
REFERENCES
- Andersson JL, Hutton C, Ashburner J, Turner R, Friston K ( 2001): Modeling geometric deformations in EPI time series. Neuroimage 13: 903–119. [DOI] [PubMed] [Google Scholar]
- Andrews‐Hanna JR, Reidler JS, Sepulcre J, Poulin R, Buckner RL ( 2010): Functional–anatomic fractionation of the brain's default network. Neuron 65: 550–562. [DOI] [PMC free article] [PubMed] [Google Scholar]
- Aron AR, Poldrack RA ( 2006): Cortical and subcortical contributions to Stop signal response inhibition: role of the subthalamic nucleus. J Neurosci 26: 2424–2433. [DOI] [PMC free article] [PubMed] [Google Scholar]
- Aron AR, Fletcher PC, Bullmore ET, Sahakian BJ, Robbins TW ( 2003): Stop‐signal inhibition disrupted by damage to right inferior frontal gyrus in humans. Nat Neurosci 6: 115–116. [DOI] [PubMed] [Google Scholar]
- Ashburner J, Friston KJ ( 1999): Nonlinear spatial normalization using basis functions. Hum Brain Mapp 7: 254–266. [DOI] [PMC free article] [PubMed] [Google Scholar]
- Barch DM, Braver TS, Akbudak E, Conturo T, Ollinger J, Snyder A ( 2001): Anterior cingulate cortex and response conflict: Effects of response modality and processing domain. Cereb Cortex 11: 837–848. [DOI] [PubMed] [Google Scholar]
- Bell AJ, Sejnowski TJ ( 1995): An information maximisation approach to blind separation and blind deconvolution. Neural Comput 7: 1129–1159. [DOI] [PubMed] [Google Scholar]
- Braver TS, Barch DM, Gray JR, Molfese DL, Snyder A ( 2001): Anterior cingulate cortex and response conflict: Effects of frequency, inhibition and errors. Cereb Cortex 11: 825–836. [DOI] [PubMed] [Google Scholar]
- Brefczynski JA, DeYoe EA ( 1999): A physiological correlate of the ‘spotlight’ of visual attention. Nat Neurosci 2: 370–374. [DOI] [PubMed] [Google Scholar]
- Brown JW ( 2009): Conflict effects without conflict in anterior cingulate cortex: Multiple response effects and context specific representations. Neuroimage 47: 334–341. [DOI] [PMC free article] [PubMed] [Google Scholar]
- Calhoun VD, Adali T ( 2006): Unmixing fMRI with independent component analysis. IEEE Eng Med Biol Mag 25: 79–90. [DOI] [PubMed] [Google Scholar]
- Calhoun VD, Adali T, McGinty VB, Pekar JJ, Watson TD, Pearlson GD ( 2001a) fMRI activation in a visual‐perception task: Network of areas detected using the general linear model and independent components analysis. Neuroimage 14: 1080–1088. [DOI] [PubMed] [Google Scholar]
- Calhoun VD, Adali T, Pearlson GD, Pekar JJ ( 2001b) A method for making group inferences from functional MRI data using independent component analysis. Hum Brain Mapp 14: 140–151. [DOI] [PMC free article] [PubMed] [Google Scholar]
- Calhoun VD, Pekar JJ, McGinty VB, Adali T, Watson TD, Pearlson GD ( 2002): Different activation dynamics in multiple neural systems during simulated driving. Hum Brain Mapp 16: 158–167. [DOI] [PMC free article] [PubMed] [Google Scholar]
- Calhoun VD, Adali T, Pekar JJ ( 2004a) A method for comparing group fMRI data using independent component analysis: Application to visual, motor and visuomotor tasks. Magn Reson Imaging 22: 1181–1191. [DOI] [PubMed] [Google Scholar]
- Calhoun VD, Pekar JJ, Pearlson GD ( 2004b): Alcohol intoxication effects on simulated driving: Exploring alcohol‐dose effects on brain activation using functional MRI. Neuropsychopharmacology 29: 2097–2107. [DOI] [PubMed] [Google Scholar]
- Calhoun VD, Liu J, Adali T ( 2009): A review of group ICA for fMRI data and ICA for joint inference of imaging, genetic, and ERP data. Neuroimage 45( 1 Suppl): S163–172. [DOI] [PMC free article] [PubMed] [Google Scholar]
- Chao HH, Luo X, Chang JL, Li CS ( 2009): Activation of the pre‐supplementary motor area but not inferior prefrontal cortex in association with short stop signal reaction time—An intra‐subject analysis. BMC Neurosci 10: 75. [DOI] [PMC free article] [PubMed] [Google Scholar]
- Chen CY, Muggleton NG, Tzeng OJ, Hung DL, Juan CH ( 2009): Control of prepotent responses by the superior medial frontal cortex. Neuroimage 44: 537–545. [DOI] [PubMed] [Google Scholar]
- Colebatch JG ( 2007): Bereitschaftspotential and movement‐related potentials: origin, significance, and application in disorders of human movement. Mov Disord 22: 601–610. [DOI] [PubMed] [Google Scholar]
- Connolly JD, Goodale MA, Cant JS, Munoz DP ( 2007): Effector‐specific fields for motor preparation in the human frontal cortex. Neuroimage 34: 1209–1219. [DOI] [PubMed] [Google Scholar]
- Corbetta M, Shulman GL ( 2002): Control of goal‐directed and stimulus‐driven attention in the brain. Nat Rev Neurosci 3: 201–215. [DOI] [PubMed] [Google Scholar]
- De Jong R, Coles MG, Logan GD, Gratton G ( 1990): In search of the point of no return: The control of response processes. J Exp Psychol Hum Percept Perform 16: 164–182. [DOI] [PubMed] [Google Scholar]
- Duann JR, Jung TP, Kuo WJ, Yeh TC, Makeig S, Hsieh JC, Sejnowski TJ ( 2002): Single‐trial variability in event‐related BOLD signals. Neuroimage 15: 823–835. [DOI] [PubMed] [Google Scholar]
- Duann JR, Ide JS, Luo X, Li CS ( 2009): Functional connectivity delineates distinct roles of the inferior frontal cortex and presupplementary motor area in stop signal inhibition. J Neurosci 29: 10171–10179. [DOI] [PMC free article] [PubMed] [Google Scholar]
- Dum RP, Strick PL ( 2002): Motor areas in the frontal lobe of the primate. Physiol Behav 77( 4/5): 677–682. [DOI] [PubMed] [Google Scholar]
- Duvernoy HM ( 1999): The Human Brain: Surface, Blood Supply, and Three‐Dimensional Sectional Anatomy, 2nd ed. New York, NY: Springer. [Google Scholar]
- Eagle DM, Bari A, Robbins TW ( 2008): The neuropsychopharmacology of action inhibition: cross‐species translation of the stop‐signal and go/no‐go tasks. Psychopharmacology (Berl). 199: 439–456. [DOI] [PubMed] [Google Scholar]
- Egner T ( 2008): Multiple conflict‐driven control mechanisms in the human brain. Trends Cogn Sci 12: 374–380. [DOI] [PubMed] [Google Scholar]
- Eichele T, Debener S, Calhoun VD, Specht K, Engel AK, Hugdahl K, von Cramon DY, Ullsperger M ( 2008): Prediction of human errors by maladaptive changes in event‐related brain networks. Proc Natl Acad Sci USA 105: 6173–6178. [DOI] [PMC free article] [PubMed] [Google Scholar]
- Fox MD, Raichle ME ( 2007): Spontaneous fluctuations in brain activity observed with functional magnetic resonance imaging. Nat Rev Neurosci 8: 700–711. [DOI] [PubMed] [Google Scholar]
- Friston K, Ashburner J, Frith C, Polone J, Heather J, Frackowiak R ( 1995): Spatial registration and normalization of images. Hum Brain Mapp 2: 165–189. [Google Scholar]
- Friston KJ, Price CJ, Fletcher P, Moore C, Frackowiak RS, Dolan RJ ( 1996): The trouble with cognitive subtraction. Neuroimage 4: 97–104. [DOI] [PubMed] [Google Scholar]
- Hampshire A, Thompson R, Duncan J, Owen AM ( 2009): Selective tuning of the right inferior frontal gyrus during target detection. Cogn Affect Behav Neurosci 9: 103–112. [DOI] [PMC free article] [PubMed] [Google Scholar]
- Hampshire A, Chamberlain SR, Monti MM, Duncan J, Owen AM ( 2010): The role of the right inferior frontal gyrus: Inhibition and attentional control. Neuroimage 50: 1313–1319. [DOI] [PMC free article] [PubMed] [Google Scholar]
- Hendrick O, Ide JS, Luo X, Li CS (2010): Dissociable processes of error and non‐error related cognitive control: A study of the stop signal task. PLoS One 5:e13155. [DOI] [PMC free article] [PubMed]
- Himberg J, Hyvarinen A, Esposito F ( 2004): Validating the independent components of neuroimaging time series via clustering and visualization. Neuroimage 22: 1214–1222. [DOI] [PubMed] [Google Scholar]
- Hutton C, Bork A, Josephs O, Deichmann R, Ashburner J, Turner R ( 2002): Image distortion correction in fMRI: A quantitative evaluation. Neuroimage 16: 217–240. [DOI] [PubMed] [Google Scholar]
- Ide JS, Li CS ( 2011): A cerebellar thalamic cortical circuit for error‐related cognitive control. Neuroimage 54: 455–464. [DOI] [PMC free article] [PubMed] [Google Scholar]
- Kiehl KA, Liddle PF, Hopfinger JB ( 2000): Error processing and the rostral anterior cingulate: An event‐related fMRI study. Psychophysiology 37: 216–223. [PubMed] [Google Scholar]
- Kim DI, Manoach DS, Mathalon DH, Turner JA, Mannell M, Brown GG, Ford JM, Gollub RL, White T, Wible C, Belger A, Bockholt HJ, Clark VP, Lauriello J, O'Leary D, Mueller BA, Lim KO, Andreasen N, Potkin SG, Calhoun VD ( 2009): Dysregulation of working memory and default‐mode networks in schizophrenia using independent component analysis, an fBIRN and MCIC study. Hum Brain Mapp 30: 3795–3811. [DOI] [PMC free article] [PubMed] [Google Scholar]
- Kiviniemi V, Starck T, Remes J, Long X, Nikkinen J, Haapea M, Veijola J, Moilanen I, Isohanni M, Zang YF, Tervonen O ( 2009): Functional segmentation of the brain cortex using high model order group PICA. Hum Brain Mapp 30: 3865–3886. [DOI] [PMC free article] [PubMed] [Google Scholar]
- Lange N, Strother SC, Anderson JR, Nielsen FA, Holmes AP, Kolenda T, Savoy R, Hansen LK ( 1999): Plurality and resemblance in fMRI data analysis. Neuroimage 10( 3 Pt 1): 282–303. [DOI] [PubMed] [Google Scholar]
- Levitt H ( 1971): Transformed up–down methods in psychoacoustics. J Acoust Soc Am 49( Suppl 2): 467+. [PubMed] [Google Scholar]
- Li CS, Huang C, Constable RT, Sinha R ( 2006): Imaging response inhibition in a stop‐signal task: Neural correlates independent of signal monitoring and post‐response processing. J Neurosci 26: 186–192. [DOI] [PMC free article] [PubMed] [Google Scholar]
- Li YO, Adali T, Calhoun VD ( 2007a) Estimating the number of independent components for functional magnetic resonance imaging data. Hum Brain Mapp 28: 1251–1266. [DOI] [PMC free article] [PubMed] [Google Scholar]
- Li CS, Yan P, Bergquist KL, Sinha R ( 2007b) Greater activation of the “default” brain regions predicts stop signal errors. Neuroimage 38: 640–648. [DOI] [PMC free article] [PubMed] [Google Scholar]
- Li CS, Huang C, Yan P, Paliwal P, Constable RT, Sinha R ( 2008a) Neural correlates of post‐error slowing during a stop signal task: A functional magnetic resonance imaging study. J Cogn Neurosci 20: 1021–1029. [DOI] [PMC free article] [PubMed] [Google Scholar]
- Li CS, Yan P, Sinha R, Lee TW ( 2008b) Subcortical processes of motor response inhibition during a stop signal task. Neuroimage 41: 1352–1363. [DOI] [PMC free article] [PubMed] [Google Scholar]
- Li CS, Yan P, Chao HH, Sinha R, Paliwal P, Constable RT, Zhang S, Lee TW ( 2008c) Error‐specific medial cortical and subcortical activity during the stop signal task: A functional magnetic resonance imaging study. Neuroscience 155: 1142–1151. [DOI] [PMC free article] [PubMed] [Google Scholar]
- Li CS, Chao HH, Lee TW ( 2009a) Neural correlates of speeded as compared with delayed responses in a stop signal task: An indirect analog of risk taking and association with an anxiety trait. Cereb Cortex 19: 839–848. [DOI] [PMC free article] [PubMed] [Google Scholar]
- Li CS, Zhang S, Duann JR, Yan P, Sinha R, Mazure CM ( 2009b) Gender differences in cognitive control: An extended investigation of the stop signal task. Brain Imaging Behav 3: 262–276. [DOI] [PMC free article] [PubMed] [Google Scholar]
- Logothetis NK ( 2008): What we can do and what we cannot do with fMRI. Nature 453: 869–878. [DOI] [PubMed] [Google Scholar]
- McKeown MJ, Makeig S, Brown GG, Jung TP, Kindermann SS, Bell AJ, Sejnowski TJ ( 1998a) Analysis of fMRI data by blind separation into independent spatial components. Hum Brain Mapp 6: 160–188. [DOI] [PMC free article] [PubMed] [Google Scholar]
- McKeown MJ, Jung TP, Makeig S, Brown G, Kindermann SS, Lee TW, Sejnowski TJ ( 1998b) Spatially independent activity patterns in functional MRI data during the stroop color‐naming task. Proc Natl Acad Sci USA 95: 803–810. [DOI] [PMC free article] [PubMed] [Google Scholar]
- McKeown MJ, Hansen LK, Sejnowsk TJ ( 2003): Independent component analysis of functional MRI: What is signal and what is noise? Curr Opin Neurobiol 13: 620–629. [DOI] [PMC free article] [PubMed] [Google Scholar]
- Meda SA, Calhoun VD, Astur RS, Turner BM, Ruopp K, Pearlson GD ( 2009a) Alcohol dose effects on brain circuits during simulated driving: An fMRI study. Hum Brain Mapp 30: 1257–1270. [DOI] [PMC free article] [PubMed] [Google Scholar]
- Meda SA, Stevens MC, Folley BS, Calhoun VD, Pearlson GD ( 2009b): Evidence for anomalous network connectivity during working memory encoding in schizophrenia: An ICA based analysis. PLoS One 4: e7911. [DOI] [PMC free article] [PubMed] [Google Scholar]
- Menon V, Adleman NE, White CD, Glover GH, Reiss AL ( 2001): Error‐related brain activation during a Go/NoGo response inhibition task. Hum Brain Mapp 12: 131–143. [DOI] [PMC free article] [PubMed] [Google Scholar]
- Muggleton NG, Chen CY, Tzeng OJ, Hung DL, Juan CH ( 2010): Inhibitory control and the frontal eye fields. J Cogn Neurosci 22: 2804–2812. [DOI] [PubMed] [Google Scholar]
- Poeppel D ( 1996): A critical review of PET studies of phonological processing. Brain Lang 55: 317–351; discussion 352–385. [DOI] [PubMed] [Google Scholar]
- Price CJ, Friston KJ ( 1997): Cognitive conjunction: A new approach to brain activation experiments. Neuroimage 5( 4 Pt 1): 261–270. [DOI] [PubMed] [Google Scholar]
- Raichle ME, MacLeod AM, Snyder AZ, Powers WJ, Gusnard DA, Shulman GL ( 2001): A default mode of brain function. Proc Natl Acad Sci USA 98: 676–682. [DOI] [PMC free article] [PubMed] [Google Scholar]
- Ridderinkhof KR, Ullsperger M, Crone EA, Nieuwenhuis S ( 2004): The role of the medial frontal cortex in cognitive control. Science 306: 443–447. [DOI] [PubMed] [Google Scholar]
- Roelofs A, van Turennout M, Coles MG ( 2006): Anterior cingulate cortex activity can be independent of response conflict in Stroop‐like tasks. Proc Natl Acad Sci USA 103: 13884–13889. [DOI] [PMC free article] [PubMed] [Google Scholar]
- Rubia K, Smith AB, Brammer MJ, Taylor E ( 2003): Right inferior prefrontal cortex mediates response inhibition while mesial prefrontal cortex is responsible for error detection. Neuroimage 20: 351–358. [DOI] [PubMed] [Google Scholar]
- Schachar R, Logan GD, Robaey P, Chen S, Ickowicz A, Barr C ( 2007): Restraint and cancellation: Multiple inhibition deficits in attention deficit hyperactivity disorder. J Abnorm Child Psychol 35: 229–238. [DOI] [PubMed] [Google Scholar]
- Slotnick SD, Schwarzbach J, Yantis S ( 2003): Attentional inhibition of visual processing in human striate and extrastriate cortex. Neuroimage 19: 1602–1611. [DOI] [PubMed] [Google Scholar]
- Smith AT, Singh KD, Greenlee MW ( 2000): Attentional suppression of activity in the human visual cortex. Neuroreport 11: 271–277. [DOI] [PubMed] [Google Scholar]
- Smith SM, Fox PT, Miller KL, Glahn DC, Fox PM, Mackay CE, Filippini N, Watkins KE, Toro R, Laird AR, Beckmann CF ( 2009): Correspondence of the brain's functional architecture during activation and rest. Proc Natl Acad Sci USA 106: 13040–13045. [DOI] [PMC free article] [PubMed] [Google Scholar]
- Stevens MC, Kiehl KA, Pearlson GD, Calhoun VD ( 2007): Functional neural networks underlying response inhibition in adolescents and adults. Behav Brain Res 181: 12–22. [DOI] [PMC free article] [PubMed] [Google Scholar]
- Stevens MC, Kiehl KA, Pearlson GD, Calhoun VD ( 2009): Brain network dynamics during error commission. Hum Brain Mapp 30: 24–37. [DOI] [PMC free article] [PubMed] [Google Scholar]
- Swick D, Turken AU ( 2002): Dissociation between conflict detection and error monitoring in the human anterior cingulate cortex. Proc Natl Acad Sci USA 99: 16354–16359. [DOI] [PMC free article] [PubMed] [Google Scholar]
- Swick D, Ashley V, Turken AU ( 2008): Left inferior frontal gyrus is critical for response inhibition. BMC Neurosci 9: 102. [DOI] [PMC free article] [PubMed] [Google Scholar]
- Zhang S, Li CS ( 2010): A neural measure of behavioral engagement: Task‐residual low‐frequency blood oxygenation level‐dependent activity in the precuneus. Neuroimage 49: 1911–1918. [DOI] [PMC free article] [PubMed] [Google Scholar]
Associated Data
This section collects any data citations, data availability statements, or supplementary materials included in this article.
Supplementary Materials
Additional Supporting Information may be found in the online version of this article.
Supporting Information
Supporting Figure 1
Supporting Figure 2
Supporting Figure 3
Supporting Figure 4
Supporting Figure 5
Supporting Figure 6
Supporting Figure 7
Supporting Figure 8
Supporting Figure 9
Supporting Figure 10
Supporting Figure 11
Supporting Figure 12