

Abstract
Glycosylation plays an essential role in regulating protein function by modulating biological, structural, and therapeutic properties. However, due to its inherent heterogeneity and diversity, the comprehensive analysis of protein glycosylation remains a challenge. As part of our continuing effort in the analysis of glycosylation profiles of recombinant HIV-1 envelope-based immunogens, we evaluated and compared the host-cell specific glycosylation pattern of recombinant HIV-1 surface glycoprotein, gp120, derived from clade C transmitted/founder virus 1086.C expressed in Chinese hamster ovary (CHO) and human embryonic kidney containing T antigen (293T) cell lines. We used an integrated glycopeptide-based mass mapping workflow that includes a partial deglycosylation step described in our previous study1 with the inclusion of the fragmentation technique, electron transfer dissociation (ETD), to complement collision induced dissociation (CID). The inclusion of ETD facilitated the analysis by providing additional validation for glycopeptide identification and expanding the identified glycopeptides to include coverage of O-linked glycosylation. The site-specific glycosylation analysis shows that the transmitted/founder 1086.C gp120 expressed in CHO and 293T displayed distinct similarities and differences. For N-linked glycosylation, two sites (N386 and N392), in the V4 region were populated with high mannose glycans in the CHO cell-derived 1086.C gp120, while these sites had a mixture of high mannose and processed glycans in the 293T cell-derived 1086.C gp120. Compositional analysis of O-linked glycans revealed that 293T cell-derived 1086.C gp120 consisted of cores 1, 2, and 4 type O-linked glycans while CHO cell-derived 1086.C exclusively consisted of core 1 type O-linked glycans. Overall, glycosylation site occupancy of the CHO and 293T cell-derived 1086.C gp120 show high degree of similarity except for one site at N88 in the C1 region. This site was partially occupied in 293T-gp120 but fully occupied in CHO-gp120. Site-specific glycopeptide analysis of transmitted/founder 1086.C gp120 expressed in CHO cells revealed the presence of phosphorylated glycans while 293T cell produced 1086.C gp120 glycans were not phosphorylated. While the influence of phosphorylated glycans on immunogenicity is unclear, distinguishing host-cell specific variations in glycosylation profiles provides insights into the similarity (or difference) in recombinant vaccine products. While these differences had minimal effect on envelope antigenicity, they may be important in considering immunogenicity and functional capacities of recombinant envelope proteins produced in different expression systems.
Introduction
One of the important considerations in the production of recombinant therapeutic proteins is the choice of expression system. The choice primarily will depend on whether the expression system could efficiently produce proteins with desired pharmacological activity and consistent quality2–6. Most often these criteria are met by expression systems that enable proper protein folding and have the capacity for post-translational modifications (PTMs), in particular glycosylation7,8. Glycan modification of proteins influences proper protein folding and secretion efficiency. In addition, it has a profound effect on the protein’s therapeutic profile such as efficacy, stability, solubility, biological activity, in vivo half-life, immunogenicity, and pharmacokinetics9–11. For the production of glycosylated therapeutic proteins, mammalian cell expression systems are the most suitable choice since they contain the cellular machinery that permit correct protein folding and glycosylation patterns similar to those of human cells. While there is currently no consensus on what form and level of glycosylation is appropriate, a necessary first step to understand the impact of glycosylation on the protein’s function is to define its overall glycosylation profile.
The task of elucidating the global glycosylation profile of proteins remains an analytical challenge. The difficulty stems from the inherent heterogeneity of glycans at any given glycosylation site and variable glycosylation site utilization. Protein glycosylation proceeds in a series of enzyme processing steps as proteins are secreted in the endoplasmic reticulum (ER) and progress through the Golgi apparatus4,12,13. For any given protein, the overall glycosylation profile is determined by the set of complement Golgi-resident enzymes unique to a specific host cell, tissue, and species as well as dependent on the accessibility of the potential glycosylation site of the protein in question12,14. Thus, different cell types display different types of glycosylation. Moreover, glycan synthesis is also affected by the cell culture conditions and perturbations in the cell environment15–17. Despite this inherent heterogeneity and diversity, recent technological advances in analytical methodologies have provided unprecedented means to effectively characterize protein glycosylation18–21.
Among the analytical methodologies that are routinely employed in the analysis of protein glycosylation, mass spectrometry (MS) is the most widely used, due to its sensitivity and selectivity18,22,23. The recent technological advances in MS instrumentation, specifically the availability of multistage fragmentation modes in new generation hybrid mass spectrometers, along with the advances in sample preparation methods and front-end separation platforms are enabling more comprehensive methods to effectively analyze protein glycosylation. There are two common forms of protein glycosylation depending on their protein linkage- N-linked glycans are attached to asparagine residues in the consensus sequence, NXT/S, where X can be any amino acid except proline while O-linked glycans are attached to the hydroxyl group of threonine or serine residues. MS characterization of N- or O- linked protein glycosylation is typically accomplished by analysis of the enzymatically or chemically released glycans for protein-specific information, or by glycopeptide-based MS analysis for glycosylation-site specific information21,23,24. To fully characterize the glycosylation profile of a given glycoprotein, especially for those with multiple glycosylation sites, it is critical to determine the glycan motifs as well as the extent of glycosylation at each potential glycosylation site, because changes in glycosylation in one of the sites could dramatically impact both protein structure and function. Such analysis would necessitate a glycopeptide-based MS analysis. In a typical workflow, glycoproteins are digested with a specific or non-specific protease to generate peptide/glycopeptide mixture that is subsequently subjected to separation and/or an enrichment step prior to MS and tandem MS analyses. Glycopeptide compositions are then determined from MS and MS/MS data with the aid of downstream data analysis tools24–27.
As part of an ongoing effort in the glycosylation analysis of recombinant subunit immunogens based on the HIV-1 envelope proteins (Envs), we have demonstrated that optimization and integration of new methods such as partial deglycosylation to facilitate glycopeptide analysis and thereby markedly improving glycosylation coverage1,25. With the goal of increasing glycosylation coverage of HIV-1 envelope proteins and providing further validation of the glycosylation analysis data, we expanded our experimental workflow to include electron transfer dissociation (ETD), used in tandem with collision induced dissociation (CID). ETD combines the ability to fragment the peptide backbone while leaving the glycan modification intact, thus providing unique complementary information to CID, in which conventional glycosidic cleavages are obtained. To date, the use of CID and ETD in glycopeptide-based MS analysis is well documented26–31. Using this new experimental workflow for HIV-1 recombinant envelope analysis, we have determined the host-cell specific gp120 glycosylation profiles of the recombinant clade C transmitted/founder virus, 1086.C gp120 expressed in two different cell lines- CHO and 293T. The host-cell specific HIV-2 gp120 N-glycosylation has been described previously32,33 and most recently the host-cell specific N-glycosylation of HIV-1 gp120 expressed in eight mammalian cell lines has been reported21. Host-cell specific glycosylation patterns of HIV-2 gp120 were reported to differ in complex-type glycans32,33 while the overall ratio of high mannose to complex-type glycans is cell type specific and is dependent on the cell line’s metabolic state during expression in HIV-1 gp12021. The variation in the ratio of the high mannose to complex type glycan content in HIV-1 gp120 observed in different mammalian cell lines was found to influence antibody recognition from polyclonal sera. In all of these studies, glycosylation analysis was performed using enzymatically released gp120 glycans and results were based on the overall glycan pool thereby not providing site-specific glycan differences in terms of the type of glycans and the extent of processing at each potential glycosylation site. Herein, we present a full site-specific glycosylation MS-based analysis of the CHO and 293T cell-derived 1086.C gp120 detailing the glycosylation profile at each of the 23 potential glycosylation sites using the integrated approach described in our previous study1 with the inclusion of ETD. Site-to-site comparison of the N- and O-linked glycosylation profiles between the CHO and 293T cell-derived 1086.C gp120 revealed distinct similarities as well as differences in terms of glycan content. Notably, we identified the presence of mannose phosphate exclusively for CHO cell-derived 1086.C gp120. In addition, the O-glycan compositions near the end of the sequence (T499) were elucidated for the first time for both gp120s and displayed a host-specific glycosylation pattern. We also evaluated the effect of expression system in antigenicity of the CHO and 293T cell-derived 1086.C gp120. Distinguishing the host-cell specific glycosylation similarities and differences is crucial in the design of and characterization of the heterogeneity envelope-based immunogens.
Experimental Section
Reagents
Trizma@ hydrochloride, Trizma@ base, ethylenediaminetetraacetic acid (EDTA), HPLC grade acetonitrile (CH3CN) and methanol (CH3OH), urea, dithiothreitol (DTT), tris(2-carboxyethyl)phosphine hydrochloride (TCEP), iodoacetamide (IAA), ammonium hydroxide, glacial acetic acid, and formic acid were purchased from Sigma (St. Louis, MO). All reagents and buffers were prepared with deionized water purified to at least 18 MΩ with a Millipore Direct-Q3 Water Purification System (Billerica, MA). Sequencing grade trypsin (Tp) was obtained from Promega (Madison, WI). Glycerol-free peptidyl-N-glycosidase F (PNGase F) cloned from Flavobacterium meningosepticum and endo-β-N-acetylglucosaminidase H (Endo H) cloned from Streptomyces plicatus, were purchased from New England BioLabs (Ipswich, MA).
Expression and Purification 1086.C gp120 Proteins
1086.C gp120 proteins were obtained from the Duke Human Vaccine Research Institute in Durham N.C. The 1086.C gp120 recombinant envelope protein was produced as follows: The HIV-1 Env gene was codon-optimized by converting amino acid sequences to nucleotide sequences employing the codon usage of highly expressed human housekeeping genes and de novo synthesized as gp120. The 1086.C gp120 gene was cloned into a mammalian expression plasmid pcDNA3.1/hygromycin (Invitrogen, Carlsbad, CA). The 1086.C gp120 was expressed in transiently transfected 293T or CHO cells. Recombinant Env glycoproteins were purified using Galanthus nivalis lectin-agarose (Vector Labs, Burlingame, CA) column chromatography from supernatants of 293T or CHO cell cultures, and further purified on a Superdex S200 size exclusion column (GE Healthcare) to remove aggregates and dimers. The purified monomeric gp120 was stored at −80°C until use.
Deglycosylation of 1086.C gp120
Samples containing 100 µg gp120 were deglycosylated with either PNGase F or Endo H to determine the degree of glycosylation site occupancy. For PNGase F treatment, samples were incubated with 1 µL of PNGase F solution (500,000 units/mL) for a week at 37°C at pH 7.5. With Endo H treatment, pH of the sample solution was adjusted to pH 5.5 with 200 mM HCl prior to deglycosylation. Samples were then denatured with 2 M urea followed by the addition of 2 µL of Endo H (≥5 units/mL). After thorough mixing, the reaction was incubated for 48 hours at 37°C. The pH of the deglycosylated samples was adjusted to 8.0 with 300 mM NH4OH prior to tryptic digestion. Deglycosylated samples were digested with trypsin as described below.
Digestion of 1086.C gp120
1086.C gp120 samples (100 µg) at a concentration of ~1 mg/mL were denatured with 6 M urea in 100 mM tris buffer (pH 8.0) containing 3mM EDTA and were fully reduced using 5 mM TCEP at room temperature for one hour. Following reduction, samples were alkylated with 20 mM IAA at RT for another hour in the dark. Excess IAA in both samples was quenched by adding DTT to a final concentration of 25 mM and incubated for 20 min at room temperature. The reduced and alkylated samples were buffer exchanged and concentrated using a 30 kDa MWCO filter (Millipore, Billerica MA) prior to trypsin digestion. Samples were subsequently digested with trypsin (30:1 protein:enzyme ratio) at 37°C and incubated overnight, followed by second trypsin addition under the same conditions. The resulting HIV-1 glycoprotein digest was either directly analyzed or stored at −20°C until further analysis. To ensure reproducibility of the method, protein digestion was performed at least three times on different days with samples obtained from the same batch and analyzed with the same experimental procedure.
Chromatography and Mass Spectrometry
High resolution LC/MS experiments were performed using a hybrid linear quadrupole ion-trap Fourier transform ion cyclotron resonance mass spectrometer (LTQ-FT, Thermo Scientific, San Jose, CA) directly coupled to Dionex UltiMate capillary LC system (Sunnyvale, CA) equipped with a FAMOS well plate autosampler. ETD experiments were performed on an LTQ-Velos (Thermo Scientific, San Jose, CA) mass spectrometer equipped with ETD, coupled to a Waters Acquity UltraPerformance (UP) LC system (Bellirica, MA). In both experiments, mobile phases consisted of solvent A: 99.9% deionized H2O + 0.1% formic acid and solvent B: 99.9 % CH3CN + 0.1% formic acid. Five microliters of the sample (~7 µM) was injected onto C18 PepMap™ 300 column (300 µm i.d. × 15 cm, 300 Å, LC Packings, Sunnyvale, CA) at a flow rate of 5 µL/min. The following CH3CN/H2O multistep gradient was used: 5% B for 5 min, followed a linear increase to 40% B in 50 min, then a linear increase to 90% B in 10 min. The column was held at 95% B for 10 minutes before re-equilibration. A short wash and blank run were performed between every sample to ensure no sample carry-over. All mass spectrometric analysis was performed in a data dependent mode as described below. For the high resolution experiment, the ESI source was operated in the following conditions: source voltage of 2.8 kV, capillary temperature of 200°C, and capillary offset voltage of 41 V. Data were collected in the positive ion mode. Data dependent acquisition (DDA) mode was setup to sequentially and dynamically select five most intense ions in the survey scan at a resolution (R) at 25000 at m/z 400 for subsequent CID in the LTQ linear ion trap, using a normalized collision energy of 35% and a 3 minute dynamic exclusion window. Under these conditions, the measured R (FWHM) in the FT-ICR mass analyzer at m/z 1000 is 10,000 and 6700 at m/z 1500. DDA mode in the LTQ-Velos was setup in the following manner: A full MS scan using enhanced scan mode was acquired followed by subsequent MS2 scans depending on the experiment. For ETD experiments, the five most intense ions from the survey scan were sequentially and dynamically selected for ETD. For the alternating ETD and CID, DDA was set up to acquire 10 scan events: For every one full MS scan in the mass range, 300–2000 m/z, each selected m/z in the MS scan were subjected to three MS/MS events- (a) CID, (b) ETD, and (c) CID of the charge reduced state in the previous ETD event. The mass spectrometric parameters used for the experiment were: spray voltage 3.0 kV, S-lens RF value between 45–55%, capillary temperature of 250°C, normalized collision energy of 35% for CID, and the ion-ion reaction time of 100–150 msec.
Glycopeptide Identification
Data were analyzed using a combination of freely available web-based informatics tools, GlycoPep DB34, GlycoPep ID35, GlycoMod36, and Protein Prospector (http://prospector.ucsf.edu). Data acquired on the LTQ-FT were analyzed using GlycoPep DB, GlycoPep ID, and GlycoMod. Details of the compositional analysis have been described previously37–39. Briefly, compositional analysis of glycopeptides with one glycosylation site was carried out by first identifying the peptide portion from CID data. The peptide portion was inferred manually or by Glycopep ID from the Y1 ion, a glycosidic bond cleavage between the two N-acetyl glucosamine at the pentasaccharide core. Once the peptide sequence is determined, plausible glycopeptide compositions were obtained using the high resolution MS data and GlycoPep DB, and the putative glycan candidate was confirmed manually by identifying the Y1 ion and inspecting the glycan fragmentation pattern from the tandem MS data. For glycopeptides with multiple glycosylation sites, experimental masses of glycopeptide ions from the high resolution MS data were converted to singly charged masses and submitted to GlycoMod. This program calculates plausible glycopeptide compositions from the set of experimental mass values entered by the user and compares these mass values with theoretical mass values, then generated a list of plausible glycopeptide compositions within a specified mass error. Plausible glycopeptide compositions in GlycoMod were deduced by providing the mass of the singly charged glycopeptide ion, enzyme, protein sequence, cysteine modification, mass tolerance, and the possible types of glycans present in the glycopeptide. Plausible glycopeptide compositions obtained from the analysis were manually confirmed and validated from MS2 data.
Raw data containing mixed CID and ETD spectra acquired using an alternating CID/ETD scans on the LTQ-Velos were analyzed manually. ETD spectra of glycopeptides identified from a preceding CID scan were manually assessed for peptide fragment ions using Protein Prospector. For each identified glycopeptide from the proceeding CID scan, observed peptide fragment ions were manually matched to the theoretical peptide fragment ions generated from Protein Prospector. Matched fragment ions that are within 0.5 Da of the theoretical value were accepted.
Peptide Identification
Deglycosylated peptides were identified by searching raw data acquired on the hybrid LTQ FTICR mass spectrometer against a custom HIV database with 148 gp120/gp41 sequences, obtained from the Los Alamos HIV sequence database (http://www.hiv.lanl.gov/content), using Mascot (Matrix Science, London, UK, version 2.3.2). The peak list was extracted from raw files using Mass Matrix conversion tool. Mgf files were searched specifying the following parameters: (a) enzyme: trypsin, (b) missed cleavage: 2, (c) fixed modification: carbamidomethyl, (d) variable modification: methionine oxidation, carbamyl, HexNAc, and dHexNAc (e) peptide tolerance of 0.8 Da, and (f) MS/MS tolerance of 0.4 Da. Peptides identified from the Mascot search were manually validated from MS2 data to ensure major fragmentation ions (b and y ions) were observed, especially for peptides generated from PNGase F treated samples that contain N to D conversions.
Surface plasmon resonance (SPR) binding of gp120 mAbs
Env gp120 binding measurements were carried out on BIAcore 3000 instruments as described earlier 40–42. The conformational, C1 mAb A32, and sCD4 were directly immobilized on a CM5 sensor chip using standard amine coupling chemistry, and 1086.C gp120 were injected at 100 µg/mL for 2 min. Following a brief washing period, the CD4 inducible mAb 17b was injected over both A32 and CD4 captured gp120 surfaces. Binding responses were calculated using report points at the end of the injection period. For measuring the binding of all other gp120 mAbs, anti-human IgG Fc antibody (Sigma Chemicals) was immobilized on a CM5 sensor chip to about 15000 Response Unit (RU), and each antibody was captured to about 50–100 RU and binding of 1086.C gp120 (100 µg/mL) was monitored as described above. An adjacent flow cell with the Synagis mAb (anti-RSV) was used as control. Non-specific binding of 1086.C gp120 to the control surface was subtracted for each mAb-gp120 binding interactions. All data analysis was performed using the BIAevaluation 4.1 analysis software (GE Healthcare).
Results and Discussion
Site-Specific Glycosylation Analysis of 1086.C gp120
The 1086.C gp120 immunogens were stably expressed and purified as monomers in 293T and CHO cell lines from a vector encoding gp120 derived from an African clade C early transmitted/founder virus43. This protein has 23 potential N-linked glycosylation (PNG) sites, of which 12 are located in the conserved regions, C1-C5, and 11 are in the variable regions, V1-V5 (Figure 1). The glycosylation profile on each of the 23 potential N-linked sites was determined using an integrated glycopeptide-based MS workflow described in our previous study1 with the inclusion of ETD. ETD offers the advantage of obtaining extensive peptide sequence information while leaving labile modifications intact. In a typical analysis, 1086.C gp120s were digested with trypsin or treated with glycosidases PNGase F or Endo H prior to trypsin digestion using in-solution digestion and were subsequently analyzed by LC/ESI FTICR MS. Once high resolution data was acquired, samples were analyzed using LTQ-Velos equipped with ETD using the same column and gradient. Figure 2A shows representative high resolution MS1 data obtained from the high resolution measurement and the corresponding CID data (Fig 2B). Figure 2C shows the representative ETD data of the same sample analyzed on the LTQ-Velos. The composition of the set of glycopeptides eluting at a given retention time window in the high resolution measurement such as shown in Figure 2A were determined from the fragment mass information obtained from CID analysis with the additional available information from ETD analysis. As an example, assignment of a putative biantennary complex-type glycopeptide containing the peptide portion,  , from the CID and ETD spectra is illustrated in Figures 2B and 2C. The CID spectrum (Fig. 2B) of the doubly charged complex-type glycopeptide at m/z 1730, which is dominated by ions corresponding to a series of glycosidic bond cleavages resulting from the losses of monosaccharide units, is used to assign the glycan component of the glycopeptide. Also observed in the CID spectrum is a set of ions consisting of the following: (a) one of the characteristic glycopeptide marker ions at m/z 528, (b) the glycosidic cleavage ion Y1 ion at m/z’s 1894 (1+) and 947 (2+), from which the peptide portion was deduced, (c) a few y-type ions resulting from the peptide backbone cleavage at m/z’s 586 (y5),704 (y6), and 817 (y7), and (d) ions at m/z 1690 (1+) and 946 (2+) corresponding to the m/z of the peptide portion. It is worth noting that the presence of the ions at m/z 1690 (1+) and 946 (2+) provided confirmatory information for the assignment of the peptide portion. While this information is usually adequate and effective to deduce the peptide portion of the glycopeptide, CID data provides limited peptide fragment ions, which are needed when the Y1 ion is not easily identified in the CID spectrum or when the Y1 ion corresponds to two isobaric glycopeptides with different peptide portions. In these cases, ETD analysis is very helpful because extensive peptide backbone fragment ions are observed. The ETD spectrum of the triply charged ion of the same glycopeptide, in Fig. 2C, shows a contiguous fragment ion series, c3–12 and z4–14, confirming the initial peptide assignment inferred from CID. Once the peptide portion was identified, the composition of the glycopeptide peaks in Fig. 2A containing the peptide portion, , were determined using GlycoPep DB and GlycoMod. Each assignment was further verified manually. Aside from the glycopeptides observed in Fig 2A, we also identified a non-glycosylated peptide,
  , located in the V5 region, at m/z 1171, coeluting with the glycopeptides. Overall, using the combination of CID and ETD facilitated the analysis and provided further verification of the glycopeptide identifications due to the complementary fragmentation information that is obtained. We obtained full glycosylation coverage for all the 23 potential N-glycosylation sites. A total of ~500 unique glycopeptide compositions per 1086.C gp120 were identified from this analysis. The complete list is found in Supplementary Tables 1, 2, 3, and 4.
Figure 1.

1086.C gp120 sequence. Dashes indicate gaps in amino acid sequence and the location of the variable (V1-V5) and conserved (C1-C5) regions are shown with potential glycosylation sites in red. To standardize the sequence positions, numbering was based on the reference HIV strain, HXB2.
Figure 2.

(A) LC/ESI-FTICR mass spectrum of a glycopeptide rich fraction showing glycopeptides found in the V2-C2 region and a non-glycosylated peptide located in the V5 loop for 1086.C gp120 expressed in CHO cells. Glycan compositions of each observed glycopeptide peak in the mass spectra were verified from tandem MS data. Representative (B) CID spectrum shows the glycosidic cleavages used to assign the glycan portion and (C) ETD spectrum showing peptide backbone cleavages used to assign and confirm the peptide portion inferred from the Y1 ion in the CID data. Asterisks (*) indicate z+1 and c+1 ions.
Glycosylation Site Occupancy of 1086.C gp120 Expressed in CHO versus 293T cells
The main method for determining glycosylation site occupancy was using Endo H digestion and detection of the products, as we have described previously1. Example data from this approach are shown in Figures 3A and 3B which contain CID and ETD data respectively, for an Endo H-treated peptide,  , containing two potential glycosylation sites. After assignment of the b and y ions (in the CID data) or the c and z ions (in the ETD data) it is clear that this peptide contains one occupied glycosylation site and one unoccupied site. While determining the site occupancy of glycopeptides by detecting the deglycosylated products following Endo H treatment was effective for nearly all the PNG sites, glycopeptides containing processed glycans are not cleaved by Endo H, and therefore, not detected as deglycosylated products. In these cases, site occupancy could still be determined, based on the ETD data of the glycopeptide. Two examples are shown in Figures 3C and 3D. In Fig. 3C, the ETD data for a peptide with two PNG sites,
  , is used to show that a complex glycan is present at the first site, and the second site is unoccupied. In Fig. 3D, the ETD data are used to verify that the peptide
  , contains a high mannose glycan at the first site, which has been cleaved by Endo H, and a complex glycan at the second site, which remains intact after Endo H treatment. Therefore, both sites on this peptide are occupied. Site occupancy data from the Endo H treated samples were also independently confirmed with analysis using PNGase F treatment. All data were searched against an HIV-1 custom database containing 148 HIV-1 Env sequences as described in the Experimental Section and were verified manually for further confirmation. Table 1 shows the summary of the degree of glycosylation site occupancy obtained from the analysis. Comparison of the glycosylation site occupancy between the 1086.C gp120 expressed from CHO and 293T cell lines revealed that both 1086.C gp120 samples display a very similar degree of glycosylation site occupancy except for one PNG site at, N88 in the C1 region. This site is partially utilized for 293T cell-derived 1086.C gp120 but fully occupied in the CHO cell-derived 1086.C gp120.
Figure 3.

CID and ETD analyses of the degree of glycosylation site occupancy. (A) CID and (B) ETD spectra of the partially deglycosylated peptide, , with precursor ion m/z at 1147 (2+, CID) and 765 (3+, ETD). Fragmentation pattern from both CID and ETD data clearly indicate that the glycopeptide is occupied at N386. (C) ETD spectrum of the glycopeptide, , with precursor ion at m/z 973 (3+) containing complex-type glycan at N397, and (D) ETD spectrum of the glycopeptide, , with precursor ion at m/z 1094 (4+) containing high mannose/hybrid-type at N301 and complex-type glycans at N401. Asterisks, (*) indicates z+1 and c+1 ions and (**) indicates z+2 and c-2 ions.
Table 1.
Site Occupancy from LC/ESI-FTICR MS Analysis
| Glycopeptides | No of Potential Glycosylation sites |
No. of Sites Occupied | |
|---|---|---|---|
| 293T | CHO | ||
| N-Linked Glycosylation | |||
| 1 | 0 and 1 | 1 | |
| 1 | 0 and 1 | 0 and 1 | |
| 1 | 0 and 1 | 0 and 1 | |
| 1 | 0 and 1 | 0 and 1 | |
| 1 | 1 | 1 | |
| 1 | 0 and 1 | 0 and 1 | |
| 1 | 1 | 1 | |
| 1 | 0 and 1 | 0 and 1 | |
| 2 | 0, 1, and 2 | 0, 1, and 2 | |
| 1 | 0 and 1 | 0 and 1 | |
| 2 | 0, 1, and 2 | 0, 1, and 2 | |
| 1 | 0 and 1 | 0 and 1 | |
| 1 | 0 and 1 | 0 and 1 | |
| 2 | 0, 1, and 2 | 0, 1, and 2 | |
| 2 | 1 | 1 | |
| 1 | 0 and 1 | 0 and 1 | |
| 1 | 0 and 1 | 0 and 1 | |
| 2 | 0 and 1 | 0 and 1 | |
| O-Linked Glycosylation | |||
| 1 | 0 and 1 | 0 and 1 | |
An Expanded 1086.C gp120 Glycosylation Profile
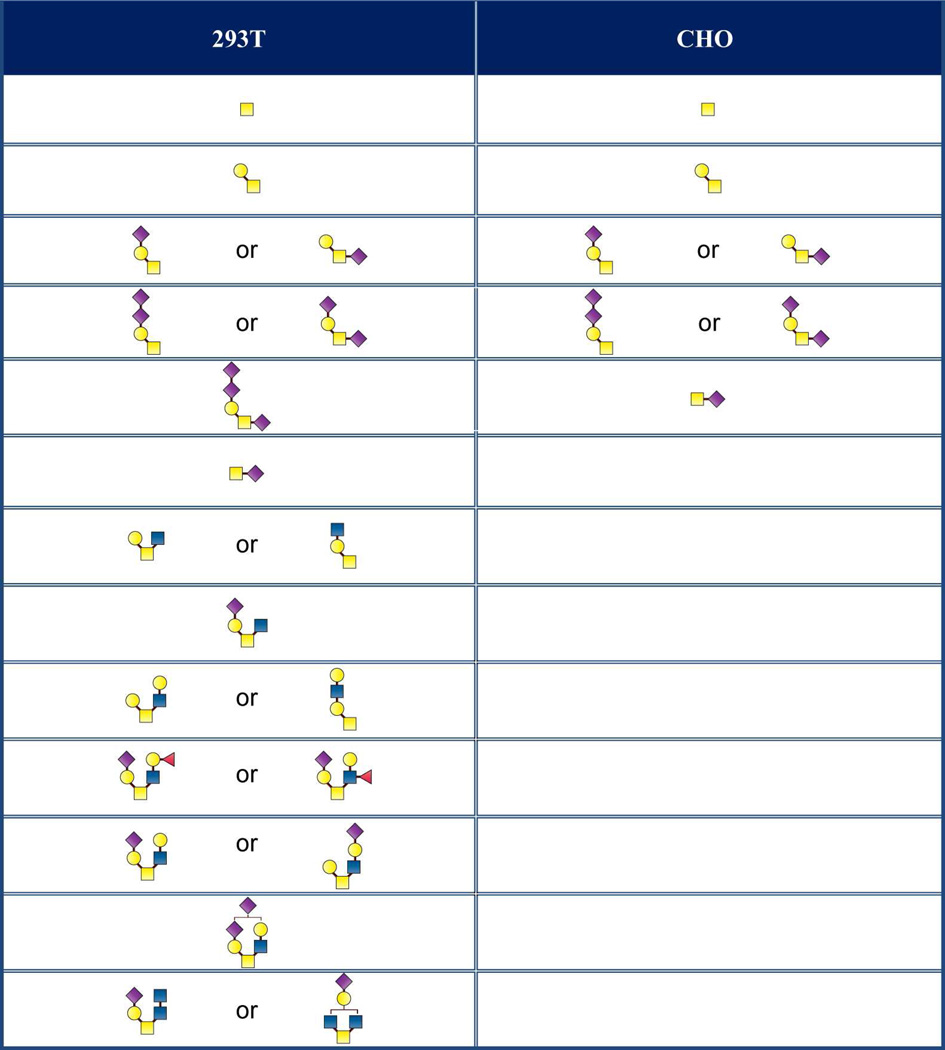
The complementary nature of CID and ETD facilitated compositional assignment of the identified N-linked glycopeptides and expanded the glycosylation profiles of 1086.C gp120s to include O-linked glycosylation. Indeed, the combined use of CID and ETD enabled the unambiguous identification of an O-linked modified threonine for gp120s produced in both cell lines. Figures 4A and 4B show representative tandem MS data of a core 2 type O-linked modified T499. Product ions observed in the CID spectrum of the O-linked glycopeptide at m/z 644 (3+) consisted of ions from glycosidic bond cleavages, ions corresponding to the putative non-glycosylated peptide, and the four characteristic oxonium ions of a sialylated O-linked glycan at m/z 204.2 (N-acetyl hexosamine), 274.2 (sialic acid-H2O), 292.2 (sialic acid), and 366.1 (hexose-N-acetyl hexosamine). Based on the m/z of the non-glycosylated peptide in the CID spectrum, we inferred that the O-glycopeptide contains the peptide portion,  . This initial assignment was confirmed with the corresponding ETD data shown in Fig 4B, wherein almost a complete series of c and z type fragment ions were observed. In addition, an abundant peak corresponding to glycosidic bond cleavage due to the loss of a sialic acid at m/z 1142, the charge reduced species, and small neutral losses due to side chain losses were also observed. From the glycosidic bond cleavages and the ion corresponding to the peptide portion observed in the CID spectrum as well as the peptide backbone cleavages observed in the ETD spectrum, it is apparent that the glycopeptide was modified at T499 with a core 2 type sialylated glycan. Within the retention time window where the O-linked glycopeptides eluted, we assigned 13 distinct O-linked glycopeptides for the 293T cell-derived 1086.C gp120 and five O-linked glycopeptides CHO cell-derived 1086.C gp120, respectively as shown in Table 2. Based on the glycopeptide compositions that were identified, CHO cell-derived 1086.C gp120 contains core 1 type O-linked glycopeptides while 293T cell - derived 1086.C gp120 appears to have cores 1, 2, and 4 type O-linked glycopeptides. In addition, we also identified that the O-linked modified T499 site is partially occupied as determined from CID and ETD analysis. O-linked glycans have been recently reported to be expressed on Hendra virus glycoprotein grown in both HEK293T cells and HeLa cells44.
Figure 4.

Identification of O-linked glycopeptides by tandem MS. (A) CID and (B) ETD mass spectra of an O-linked core-2-type glycopeptide identified from 1086.C gp120 expressed in 293T cells. Asterisks (*) indicate z+1 and c+1 ions
Table 2.
O-linked glycans attached to T499 in 293T and CHO cell-derived 1086.C gp120
 |
In addition to the O-linked glycopeptides, we detected the presence of phosphorylated glycopeptides in the CHO cell-derived 1086.C gp120 digests but not in 293T cell-derived 1086.C gp120. Phosphorylation is known to occur in the peptide backbone, specifically on serine, threonine, or tyrosine residues as well as on N-linked glycans. Glycosylation analysis of the CHO cell-derived 1086.C gp120 digest revealed that phosphorylation was localized to the N-linked glycans as determined by CID and ETD analysis (Fig. 5.) A representative CID spectrum (Fig. 5A) of the glycopeptide containing the peptide sequence, , showed the loss of four mannose residues, loss of a phosphate, and a series of y-type ions (y3–9). It should be noted that peptide sequence contains two threonine residues and one serine residue that can be potentially phosphorylated. Except for the threonine near the potential glycosylation site at N197, the series of y-type ions (y3–9) in the CID spectrum indicate that the neither serine nor threonine residues were modified by phosphate. Additional information obtained from the ETD spectrum (Fig, 5B) showing the contiguous z-type ions (z4–11, 13–14) and c-type ions (c3–6, 14) indicates that the glycans are modified by phosphate. The fragmentation information obtained from both CID and ETD were sufficient to identify phosphorylated high mannose and hybrid type glycans on CHO cell-derived 1086.C gp120 at six glycosylation sites-N130, N137, N187, and N197 in the V1-V2 region, N276 in the C2 region, and N408 in the V4 region.
Figure 5.

Identification of phosphorylated glycopeptides from the tryptic digest of 1086.C gp120 expressed in CHO cells by (A) CID and (B) ETD. Cleavage of the glycosidic bond and the peptide backbone (y3-y9) as well as loss of phosphate was observed from CID spectrum of the phosphorylated high mannose with peptide portion, , in the V2-C2. ETD experiments yield mainly peptide backbone cleavages c/z- type ions. Also observed were glycosidic cleavages at m/z 1211 and 1332 resulting from additional activation during ETD.
Glycan Profile of 1086.C gp120 Expressed in CHO versus 293T cells
From the data reported in this study, as shown in the Supplementary Tables 1 and 2, the glycans identified for 1086.C gp120 expressed in CHO and 293T cells consisted of a broad spectrum of glycan structures consisting of high mannose, hybrid, complex glycans containing multi-antennary structures with varying level of core fucosylation and sialylation spanning all potential N-glycosylation sites. Also observed were two PNG sites on both 1086.C gp120’s (293T and CHO cell-derived) modified with a single HexNAc on asparagine (See Supplementary Tables 1, 2, 3 and 4). These assignments were supported with either CID or ETD data. While this glycan is unexpected, we consistently observed N-linked HexNAc modification on the previous glycosylation analysis of a 293T cell-derived gp140 counterpart1 and it was also reported on the O-GlcNAcylation of postsynaptic density pseudo-organelle derived from murine brains45.
To distinguish cell line dependent differences in the glycan profiles, glycan profile at each site were evaluated for high mannose or processed (hybrid and complex-type) glycan content using the criteria previously described1,37,39. The glycan profile at each site was compared using heirarchical cluster analysis to infer the degree of similarity between the two cell lines. Cluster analysis separates the sites with mostly processed glycans from sites with mostly high mannose glycans. Of the 23 N-linked glycosylation sites, six sites (N230, N241, N262, N334, and N448) were populated exclusively with high mannose glycans for both cell lines and 16 sites were populated with mostly processed glycans. Figure 6A summarizes the cell line dependent glycan profile for each of the 23 PNG sites of 1086.C gp120 expressed in the two cell lines. The very short branches in the dendrogram show that the group of sites with either processed or high mannose glycans has very low variability indicating that the glycan profiles display very high similarity except for two sites, N386 and N392, in the V4 region between the 1086.C gp120 expressed in CHO and 293T cell lines. These sites were populated with high mannose glycans in the CHO cell-derived 1086.C gp120 while a mixture of high mannose and processed glycans in the 293T cell-derived 1086.C gp120. Cluster analysis also revealed that the glycosylation sites at the beginning of the sequence and at the end of the gp120 sequence were mostly processed while glycosylation sites in the C2(N230, N241, and N262), C3(N334), and C4 regions were mostly high mannose. This result is consistent with the previous glycosylation analysis of the 1086.C gp140 counterpart of the same protein expressed in 293T stably transfected cell line.1. However, unlike the 293T cell-derived 1086.C gp140, have more sites with higher high mannose content compared to 293T cell-derived 1086.C gp120.
Figure 6.

(A) Comparison of the host cell specific glycan profile by hierarchical clustering using Ward’s method linkage analysis. Two distinct clusters with respect to glycosylation were observed. Heatmap shows the relative standardized processed glycans (z-score) using the following color key: blue indicates processed glycans and pink indicates high mannose glycans. (B) Comparison of the degree of fucosylation (top panel) and sialylation (bottom panel) between 1086.C gp120 expressed in CHO and 293T cells.
We next examined the degree of fucosylation and sialylation for both 293T and CHO cell-derived 1086.C gp120. The degree of fucosylation for each site was determined by the sum of fucosylated glycopeptides divided by the total number of processed glycopeptides multiplied by 100. The results showed that the degree of fucosylation for 1086.C gp120 expressed in CHO cells was slightly higher compared to that of 1086.C gp120 expressed in 293T cells for most of the glycosylation sites (Fig. 6B). Analogous to the degree of fucosylation, the degree of sialylation was calculated in a similar manner. In this case, the results (Fig. 6C) showed a site-to-site variation in sialylation between the two gp120s. On the average when all glycosylation sites were considered, the sialic acid content of 1086.C gp120 expressed from CHO cell line was also slightly higher than 1086.C gp120 expressed from 293T cell line compared to the CHO cell-derived gp120. Overall, the slightly higher fucose and sialic acid content observed for CHO cell-derived C.10186C gp120 compared to 293T cell-derived C.10186C gp120 was consistent with a previous analysis of glycosylation on other gp120 proteins from these two cell lines46.
Finally, two additional distinct differences in the glycan profile between the two cell lines were observed. First, the O-linked glycosylation were different between the two cell lines. In 293T cell-derived 1086.C gp120, we identified a series of cores 1, 2, and 4 O-linked glycans, while for CHO cell-derived 1086.C gp120 only core 1 O-linked glycans were observed. Another difference in the glycan profile is the presence of fucosylated O-linked glycan in 293T cell-derived 1086.C gp120 but none in the CHO cell-derived 1086.C gp120. Second is the presence of phosphorylated glycans for 1086.C gp120 expressed in CHO cells with none detected on 293T-gp120. The mannose-6-phosphate (Man-6-P) glycan modification was observed in six glycosylation sites spanning the sites N130, N137, N187, and N197 in the V1-V2 region, N276 in the C2 region, and N408 in the V4 region. The identification of Man-6-P modified gp120, in general, is particularly interesting. Man-6-Ps are recognition motifs for two mannose-6-phosphate receptors (MPRs) that ensure the transport proteins modified with Man-6-Ps from the trans-Golgi network to the lysosome47,48. However, depending on the efficiency of targeting pathway, some Man-6-P containing proteins are directed to the secretory pathway 49–51. It has recently been reported that MPRs are used by HIV-1 for crossing the blood brain barrier 52 and they facilitate HIV-1 replication in microglial cells 53. It is not known if native virions or CD4 T cell surface gp160 trimers express mannose-6-phosphate; the one report on virion glycans made no mention of the presence of mannose-6-phosphate in virion preparation 54,55. While the role of Man-6-P on gp120 is unclear, its impact on the gp120 immunogenecity is currently under study.
Antigenicity of 1086.C gp120 expressed in CHO versus 293T cells
Both the CHO and 293T cell line derived gp120 monomeric proteins bound well to CD4 and showed similar level of CD4 induced 17b mAb binding (CD4i epitope). There was no difference in the overall antigenicity of the two forms of 1086.C gp120 proteins when assessed by comparing binding to monoclonal antibodies to C1 (A32), conformational V2 (697D, 2158), CD4 binding site (VRC01) and the carbohydrate binding bNAb 2G12 (Fig. 7). Neither of the two forms of 1086.C gp120 bound to the conformational V1/V2 bNAbs (PG9, PG16, CH01).
Figure 7.

Antigenicity of 1086.C gp120 proteins grown in CHO and 293T cells.. Antigenicity was compared by surface plasmon resonance measurements of the binding of each 1086.C gp120 protein (100 µg/mL) to HIV-1 gp120 mAbs. The gp120 conformational C1 mAb A32 (A) was directly immobilized to the sensor chip, and the CD4i (CD4 inducible) mAb17 mAb (B) binding was measured following capture of gp120 on a CD4 immobilized surface. Each of the mAbs listed in the Table above and including the broadly neutralizing CD4 binding site mAb VRC01 (C), and 2G12 (D) were captured on anti-Fc immobilized surface as described in Methods. Specific binding of 1086.C gp120 to gp120 mAbs in Response Units were scored as follows- no binding = −; >100 = ++; >1000 = +++.
Conclusions
We have demonstrated the advantage of the combination of ETD and CID for the determination of distinct similarities and differences in the glycosylation profiles of 1086.C gp120 expressed in CHO and 293T cells. The implementation of ETD in our workflow facilitated the analysis and allowed the unambiguous identification of modification sites. As a result, we have obtained full glycosylation coverage for all 23 N-linked sites for both CHO and 293T cell-derived 1086.C gp120. The effective addition of ETD expanded the glycosylation profile of both CHO and 293T cell-derived 1086.C gp120 with the identification of O-linked modified sites near the end of the gp120 sequence. Indeed, the inclusion of ETD allowed for the unambiguous elucidation of the O-glycans populating the O-linked site for the first time. Site-to-site comparison revealed that CHO and 293T cell-derived 1086.C gp120s display very similar glycosylation profile with few subtle distinctions. We determined that 1086.C gp120 expressed in CHO and 293T differs in the glycan profile in two sites in the V4 region and that the N-glycan profile of CHO cell-derived 1086.C gp120 exclusively contains phosphorylated glycans as well as a slightly higher degree of fucosylation and sialylation. In addition, 293T cell-derived 1086.C appears to contain cores 1,2, and 4 O-linked glycan while exclusively core 1 O-linked glycans were detected in CHO cell-derived 1086.C gp120. While there was no major difference in the antigenicity of 293T vs. CHO produced gp120s with regard to a panel of anti-HIV-1 gp120 antibodies, distinguishing host-cell specific variations in glycosylation profiles remains important.
Supplementary Material
Acknowledgements
This work was supported by NIH grant R01RR026061 and 1R01AI094797 to Heather Desaire and, PO1AI61734, the Center for HIV/AIDS Vaccine Immunology Grant U19AI067854 and the Center for HIV/AIDS Vaccine Immunology-Immunogen Discovery grant UM1AI100645 from the Division of AIDS, NIAID, NIH, and the Vaccine Discovery Center of the Collaboration for AIDS Vaccine Development Program grant OPP1033098s from the Bill and Melinda Gates Foundation to Barton F. Haynes. We would also like to acknowledge the Analytical Proteomics Laboratory (APL) at KU for instrument time.
Footnotes
Supporting Information Available
Complete list of the glycopeptide compositions for CHO and 293T cell expressed 1086.C gp120 (Supplementary Tables 1, 2, 3, and 4). This material is available free of charge via the Internet at http://pubs.acs.org.
References
- 1.Go EP, Hewawasam G, Liao HX, Chen H, Ping LH, Anderson JA, Hua DC, Haynes BF, Desaire H. J. Virol. 2011;85(16):8270–8284. doi: 10.1128/JVI.05053-11. [DOI] [PMC free article] [PubMed] [Google Scholar]
- 2.Jianwei Z. Biotechnol. Adv. 2012;30(5):1158–1170. doi: 10.1016/j.biotechadv.2011.08.022. [DOI] [PubMed] [Google Scholar]
- 3.Walsh G. Nat. Biotech. 2006;24(7):769–776. doi: 10.1038/nbt0706-769. [DOI] [PubMed] [Google Scholar]
- 4.Wurm FM. Nat. Biotech. 2004;22(11):1393–1398. doi: 10.1038/nbt1026. [DOI] [PubMed] [Google Scholar]
- 5.Griffin TJ, Seth G, Xie H, Bandhakavi S, Hu WS. Trends Biotechnol. 2007;25(9):401–408. doi: 10.1016/j.tibtech.2007.07.004. [DOI] [PubMed] [Google Scholar]
- 6.Brooks SA. Mol. Biotechnol. 2004;28(3):241–255. doi: 10.1385/MB:28:3:241. [DOI] [PubMed] [Google Scholar]
- 7.Walsh G, Jefferis R. Nat. Biotechnol. 2006;24(10):1241–1252. doi: 10.1038/nbt1252. [DOI] [PubMed] [Google Scholar]
- 8.Walsh G. Drug Discov. Today. 2010;15(17–18):773–780. doi: 10.1016/j.drudis.2010.06.009. [DOI] [PubMed] [Google Scholar]
- 9.Beck A, Wagner-Rousset E, Wurch T, Corvaia N. M S-Med. Sci. 2009;25(12):1024–1032. doi: 10.1051/medsci/200925121024. [DOI] [PubMed] [Google Scholar]
- 10.Sethuraman N, Stadheim TA. Curr. Opin. Biotechnol. 2006;17(4):341–346. doi: 10.1016/j.copbio.2006.06.010. [DOI] [PubMed] [Google Scholar]
- 11.Werner RG, Kopp K, Schlueter M. Acta Paediatrica. 2007;96:17–22. doi: 10.1111/j.1651-2227.2007.00199.x. [DOI] [PubMed] [Google Scholar]
- 12.Kornfeld R, Kornfeld S. Annu. Rev. Biochem. 1985;54:631–664. doi: 10.1146/annurev.bi.54.070185.003215. [DOI] [PubMed] [Google Scholar]
- 13.Ohtsubo K, Marth JD. Cell. 2006;126(5):855–867. doi: 10.1016/j.cell.2006.08.019. [DOI] [PubMed] [Google Scholar]
- 14.Brooks SA. Expert Rev Proteomics. 2006;3(3):345–359. doi: 10.1586/14789450.3.3.345. [DOI] [PubMed] [Google Scholar]
- 15.Jenkins N, Parekh RB, James DC. Nature Biotechnol. 1996;14(8):975–981. doi: 10.1038/nbt0896-975. [DOI] [PubMed] [Google Scholar]
- 16.Butler M. Cytotechnology. 2006;50(1–3):57–76. doi: 10.1007/s10616-005-4537-x. [DOI] [PMC free article] [PubMed] [Google Scholar]
- 17.Lauc G, Zoldos V. Mol. Biosyst. 2010;6(12):2373–2379. doi: 10.1039/c0mb00067a. [DOI] [PubMed] [Google Scholar]
- 18.Marino K, Bones J, Kattla JJ, Rudd PM. Nat. Chem. Biol. 2010;6(10):713–723. doi: 10.1038/nchembio.437. [DOI] [PubMed] [Google Scholar]
- 19.Morelle W, Michalski JC. Nat. Protoc. 2007;2(7):1585–1602. doi: 10.1038/nprot.2007.227. [DOI] [PubMed] [Google Scholar]
- 20.Geyer H, Geyer R. Biochim. Biophys. Acta. 2006;1764(12):1853–1869. doi: 10.1016/j.bbapap.2006.10.007. [DOI] [PubMed] [Google Scholar]
- 21.Rakus JF, Mahal LK. Annu. Rev. Anal. Chem. 2011;4(1):367–392. doi: 10.1146/annurev-anchem-061010-113951. [DOI] [PubMed] [Google Scholar]
- 22.Brooks SA. Mol. Biotechnol. 2009;43(1):76–88. doi: 10.1007/s12033-009-9184-6. [DOI] [PubMed] [Google Scholar]
- 23.Budnik BA, Lee RS, Steen JAJ. Biochim. Biophys. Acta. 2006;1764(12):1870–1880. doi: 10.1016/j.bbapap.2006.10.005. [DOI] [PubMed] [Google Scholar]
- 24.Leymarie N, Zaia J. Anal. Chem. 2012;84(7):3040–3048. doi: 10.1021/ac3000573. [DOI] [PMC free article] [PubMed] [Google Scholar]
- 25.Zhang Y, Go EP, Desaire H. Anal. Chem. 2008;80(9):3144–3158. doi: 10.1021/ac702081a. [DOI] [PubMed] [Google Scholar]
- 26.Hogan JM, Pitteri SJ, Chrisman PA, McLuckey SA. J.Proteome Res. 2005;4(2):628–632. doi: 10.1021/pr049770q. [DOI] [PMC free article] [PubMed] [Google Scholar]
- 27.Catalina MI, Koeleman CAM, Deelder AM, Wuhrer M. Rapid Communications in Mass Spectrometry. 2007;21(6):1053–1061. doi: 10.1002/rcm.2929. [DOI] [PubMed] [Google Scholar]
- 28.Alley WR, Mechref Y, Novotny MV. Rapid Commun. Mass Spectrom. 2009;23(1):161–170. doi: 10.1002/rcm.3850. [DOI] [PubMed] [Google Scholar]
- 29.Perdivara I, Petrovich R, Allinquant B, Deterding LJ, Tomer KB, Przybylski M. J. Proteome Res. 2009;8(2):631–642. doi: 10.1021/pr800758g. [DOI] [PMC free article] [PubMed] [Google Scholar]
- 30.Scott NE, Parker BL, Connolly AM, Paulech J, Edwards AVG, Crossett B, Falconer L, Kolarich D, Djordjevic SP, Hojrup P, Packer NH, Larsen MR, Cordwell SJ. Mol. Cel. Proteomics. 2011;10(2) doi: 10.1074/mcp.M000031-MCP201. [DOI] [PMC free article] [PubMed] [Google Scholar]
- 31.Wang DD, Hincapie M, Rejtar T, Karger BL. Anal. Chem. 2011;83(6):2029–2037. doi: 10.1021/ac102825g. [DOI] [PMC free article] [PubMed] [Google Scholar]
- 32.Liedtke S, Adamski M, Geyer R, Pfutzner A, Rubsamen-Waigmann H, Geyer H. Glycobiology. 1994;4(4):477–484. doi: 10.1093/glycob/4.4.477. [DOI] [PubMed] [Google Scholar]
- 33.Liedtke S, Geyer R, Geyer H. Glycoconj. J. 1997;14(7):785–793. doi: 10.1023/a:1018577619036. [DOI] [PubMed] [Google Scholar]
- 34.Go EP, Rebecchi KR, Dalpathado DS, Bandu ML, Zhang Y, Desaire H. Anal. Chem. 2007;79(4):1708–1713. doi: 10.1021/ac061548c. [DOI] [PubMed] [Google Scholar]
- 35.Irungu J, Go EP, Dalpathado DS, Desaire H. Anal. Chem. 2007;79(8):3065–3074. doi: 10.1021/ac062100e. [DOI] [PubMed] [Google Scholar]
- 36.Cooper CA, Gasteiger E, Packer NH. Proteomics. 2001;1(2):340–349. doi: 10.1002/1615-9861(200102)1:2<340::AID-PROT340>3.0.CO;2-B. [DOI] [PubMed] [Google Scholar]
- 37.Go EP, Irungu J, Zhang Y, Dalpathado DS, Liao HX, Sutherland LL, Alam SM, Haynes BF, Desaire H. J. Proteome Res. 2008;7(4):1660–1674. doi: 10.1021/pr7006957. [DOI] [PMC free article] [PubMed] [Google Scholar]
- 38.Irungu J, Go EP, Zhang Y, Dalpathado DS, Liao HX, Haynes BF, Desaire H. J. Am. Soc. Mass Spectrom. 2008;19(8):1209–1220. doi: 10.1016/j.jasms.2008.05.010. [DOI] [PMC free article] [PubMed] [Google Scholar]
- 39.Go EP, Chang Q, Liao HX, Sutherland LL, Alam SM, Haynes BF, Desaire H. J. Proteome Res. 2009;8(9):4231–4242. doi: 10.1021/pr9002728. [DOI] [PMC free article] [PubMed] [Google Scholar]
- 40.Alam SM, McAdams M, Boren D, Rak M, Scearce RM, Gao F, Camacho ZT, Gewirth D, Kelsoe G, Chen P, Haynes BF. J. Immunol. 2007;178(7):4424–4435. doi: 10.4049/jimmunol.178.7.4424. [DOI] [PMC free article] [PubMed] [Google Scholar]
- 41.Alam SM, Scearce RM, Parks RJ, Plonk K, Plonk SG, Sutherland LL, Gorny MK, Zolla-Pazner S, Vanleeuwen S, Moody MA, Xia SM, Montefiori DC, Tomaras GD, Weinhold KJ, Karim SA, Hicks CB, Liao HX, Robinson J, Shaw GM, Haynes BF. J. Virol. 2008;82(1):115–125. doi: 10.1128/JVI.00927-07. [DOI] [PMC free article] [PubMed] [Google Scholar]
- 42.Alam SM, Morelli M, Dennison SM, Liao HX, Zhang R, Xia SM, Rits- Volloch S, Sun L, Harrison SC, Haynes BF, Chen B. Proc. Natl. Acad. Sci. U. S. A. 2009;106(48):20234–20239. doi: 10.1073/pnas.0908713106. [DOI] [PMC free article] [PubMed] [Google Scholar]
- 43.Keele BF, Giorgi EE, Salazar-Gonzalez JF, Decker JM, Pham KT, Salazar MG, Sun C, Grayson T, Wang S, Li H, Wei X, Jiang C, Kirchherr JL, Gao F, Anderson JA, Ping LH, Swanstrom R, Tomaras GD, Blattner WA, Goepfert PA, Kilby JM, Saag MS, Delwart EL, Busch MP, Cohen MS, Montefiori DC, Haynes BF, Gaschen B, Athreya GS, Lee HY, Wood N, Seoighe C, Perelson AS, Bhattacharya T, Korber BT, Hahn BH, Shaw GM. Proc. Natl. Acad. Sci. U. S. A. 2008;105(21):7552–7557. doi: 10.1073/pnas.0802203105. [DOI] [PMC free article] [PubMed] [Google Scholar]
- 44.Colgrave ML, Snelling HJ, Shiell BJ, Feng YR, Chan YP, Bossart KN, Xu K, Nikolov DB, Broder CC, Michalski WP. Glycobiology. 2012;22(4):572–584. doi: 10.1093/glycob/cwr180. [DOI] [PMC free article] [PubMed] [Google Scholar]
- 45.Chalkley RJ, Thalhammer A, Schoepfer R, Burlingame AL. Proc. Natl. Acad. Sci. U. S. A. 2009;106(22):8894–8899. doi: 10.1073/pnas.0900288106. [DOI] [PMC free article] [PubMed] [Google Scholar]
- 46.Raska M, Takahashi K, Czernekova L, Zachova K, Hall S, Moldoveanu Z, Elliott MC, Wilson L, Brown R, Jancova D, Barnes S, Vrbkova J, Tomana M, Smith PD, Mestecky J, Renfrow MB, Novak J. J. Biol. Chem. 2010;285(27):20860–20869. doi: 10.1074/jbc.M109.085472. [DOI] [PMC free article] [PubMed] [Google Scholar]
- 47.Kornfeld S. FASEB J. 1987;1(6):462–468. doi: 10.1096/fasebj.1.6.3315809. [DOI] [PubMed] [Google Scholar]
- 48.Ghosh P, Dahms NM, Kornfeld S. Nat Rev Mol. Cell Biol. 2003;4(3):202–212. doi: 10.1038/nrm1050. [DOI] [PubMed] [Google Scholar]
- 49.Dahms NM, Olson LJ, Kim JJ. Glycobiology. 2008;18(9):664–678. doi: 10.1093/glycob/cwn061. [DOI] [PMC free article] [PubMed] [Google Scholar]
- 50.Chen JJ, Zhu Z, Gershon AA, Gershon MD. Cell. 2004;119(7):915–926. doi: 10.1016/j.cell.2004.11.007. [DOI] [PubMed] [Google Scholar]
- 51.Sleat DE, Wang Y, Sohar I, Lackland H, Li Y, Li H, Zheng H, Lobel P. Mol. Cell Proteomics. 2006;5(10):1942–1956. doi: 10.1074/mcp.M600030-MCP200. [DOI] [PubMed] [Google Scholar]
- 52.Dohgu S, Ryerse JS, Robinson SM, Banks WA. PLoS. One. 2012;7(6):e39565. doi: 10.1371/journal.pone.0039565. [DOI] [PMC free article] [PubMed] [Google Scholar]
- 53.Suh HS, Cosenza-Nashat M, Choi N, Zhao ML, Li JF, Pollard JW, Jirtle RL, Goldstein H, Lee SC. Am. J. Pathol. 2010;177(5):2446–2458. doi: 10.2353/ajpath.2010.100399. [DOI] [PMC free article] [PubMed] [Google Scholar]
- 54.Doores KJ, Bonomelli C, Harvey DJ, Vasiljevic S, Dwek RA, Burton DR, Crispin M, Scanlan CN. Proc. Natl. Acad. Sci. U. S. A. 2010;107(31):13800–13805. doi: 10.1073/pnas.1006498107. [DOI] [PMC free article] [PubMed] [Google Scholar]
- 55.Bonomelli C, Doores KJ, Dunlop DC, Thaney V, Dwek RA, Burton DR, Crispin M, Scanlan CN. PLoS ONE. 2011;6(8):e23521. doi: 10.1371/journal.pone.0023521. [DOI] [PMC free article] [PubMed] [Google Scholar]
Associated Data
This section collects any data citations, data availability statements, or supplementary materials included in this article.