Abstract
Purpose
The goal of the present study was to introduce a new non-contrast enhanced 4D dynamic MR angiography (dMRA) technique termed multi-bolus TrueFISP based spin tagging with alternating radiofrequency (TrueSTAR).
Methods
Multi-bolus TrueSTAR was developed by taking advantage of the phenomenon that the steady-state signal of TrueFISP is minimally disturbed by periodically inserted magnetization preparations (e.g., spin tagging) that are sandwiched by 2 α/2 RF pulses. Both theoretical analysis and experimental studies were carried out to optimize the proposed method which was compared with both pulsed and pseudo-continuous arterial spin labeling (pCASL) based dMRA in healthy volunteers. Optimized multi-bolus dMRA was also applied in a patient with arteriovenous malformation (AVM) to demonstrate its potential clinical utility.
Results
Multi-bolus dMRA offered a prolonged tagging bolus compared to the standard single-bolus dMRA, and allowed improved visualization of the draining veins in the AVM patient. Compared to pCASL based dMRA, multi-bolus dMRA provided visualization of the full passage of the labeled blood with the flexibility for both static and dynamic MRA.
Conclusion
By combining the benefits of pulsed and pCASL based dMRA, multi-bolus TrueSTAR can prolong and enhance the tagging bolus without sacrificing imaging speed or temporal resolution.
Keywords: Dynamic magnetic resonance angiography (dMRA), non-contrast enhanced MRA, steady-state free precession (SSFP), true fast imaging with steady state precession (TrueFISP), arterial spin labeling (ASL), arteriovenous malformation (AVM)
Introduction
Arterial spin labeling (ASL) techniques were originally introduced and developed for non-contrast enhanced MR angiography (MRA) in the 1980s (1–3). Since the seminal work by Detre and Williams et al in 1992 (4 5), ASL has evolved into a class of MRI techniques for noninvasive measurements of microvascular perfusion of the brain and body organs (6). Recently, there has been a resurgent trend for the development and applications of ASL based MRA techniques. This emerging trend may be attributed to the advent of spin tagging techniques with improved signal-to-noise ratio (SNR), such as pseudo-Continuous ASL (pCASL) (7 8) with the capability for vessel-selective labeling (9 10). Compared to pulsed ASL (PASL), pCASL based MRA demonstrated not only increased SNR but also reduced sensitivity to variations in delay time (TI) and TR for imaging carotid arteries (11). At the meantime, various fast imaging techniques became mature which offer adequate spatial resolution and volumetric imaging coverage for performing ASL based MRA within a short time period. A recent study combined pCASL with accelerated 3D radial acquisition (VIPR) to achieve whole brain MRA with sub-millimeter 3D isotropic resolution (12). The drawbacks for the use of pCASL for MRA, however, include relatively long labeling durations (a few seconds) that may compete with image acquisition.
Another notable trend in ASL based MRA involves the development of time-resolved non-contrast enhanced 4D dynamic MRA (dMRA)(13 14). In 4D dMRA, spin labeling is combined with a cine multi-phase balanced steady-state free precession (bSSFP) readout, offering both high temporal (a few ten milliseconds) and spatial resolution (a few cubic millimeter) for depicting the dynamic flow pattern through the vasculature. Initial clinical evaluations of 4D dMRA showed promises in patients with arteriovenous malformation (AVM)(15 16) and steno-occlusive disease (17), as compared to the gold standard of digital subtraction angiography (DSA). In 4D dMRA, the apparent blood T1 may be shorter than the true blood T1 depending on the blood flow velocity and imaging parameters of the bSSFP readout such as the flip angle. This apparent blood T1 is a primary limiting factor for the length of the tagging bolus (approximately1–2 seconds) in dMRA methods. This relatively narrow dynamic temporal window may limit the clinical utility of 4D dMRA, e.g., for visualizing draining veins of AVM which is a critical factor in clinical evaluations (15 16).
To date, most existing dMRA techniques have used PASL for spin tagging given its short duration that allows the visualization of the full passage of labeled blood through arteries. Pseudo-CASL has been attempted for dMRA at the cost of prolonged scan time, and a few initial phases of arterial inflow may be sacrificed (10 18). It will be ideal to combine the benefits of both PASL, including short RF duration and technical simplicity, and pCASL, including higher SNR and prolonged labeling bolus, in 4D dMRA to improve the image quality as well as to increase the temporal window for visualizing the full passage of dynamic blood flow. The primary purpose of this work was to introduce such a dMRA technique termed multi-bolus TrueFISP based Spin Tagging with Alternating Radiofrequency (TrueSTAR). Both theoretical analysis and in vivo experiments were carried out in the present study to demonstrate the feasibility of the proposed approach, which was compared with both PASL and pCASL based dMRA methods.
Theory
As shown by Scheffler et al (19), the steady-state signal of the TrueFISP sequence is minimally disturbed by periodically inserted magnetization preparation such as fat saturation, which is achieved by an α/2 flip-back pulse before the magnetization preparation to temporally store the established steady-state signal as pure longitudinal magnetization. After the magnetization preparation, this longitudinal magnetization is excited by another α/2 pulse to continue the TrueFISP acquisition.
The proposed multi-bolus TrueSTAR technique took advantage of this phenomenon, in which a number of magnetization preparations using PASL were applied during the continuous multi-phase segmented TrueFISP acquisition without significant modifications of the steady-state signal. Figure 1 shows the pulse sequence diagram of multi-bolus TrueSTAR. Spin tagging is implemented using the STAR scheme (20) by applying a Hyperbolic Secant (HS) inversion pulse inferior to the imaging slab. Each inversion pulse (except the first one) is sandwiched by two α/2 pulses and interleaved by a number of phases of bSSFP acquisitions. A pre-saturation pulse is applied at the beginning of the sequence to saturate the background signal in the imaging slab.
Figure 1.

Diagram of multi-bolus TrueSTAR sequence that employs a train of intermittent HS inversion pulses for spin labeling during the multi-phase segmented trueFISP readout. Spin tagging is implemented using the STAR scheme. Each inversion pulse (except the first one) is sandwiched by 2 α/2 pulses and interleaved by a number of phases of balanced SSFP acquisitions. A pre-saturation pulse is applied at the beginning of the sequence to saturate the background signal in the imaging slab.
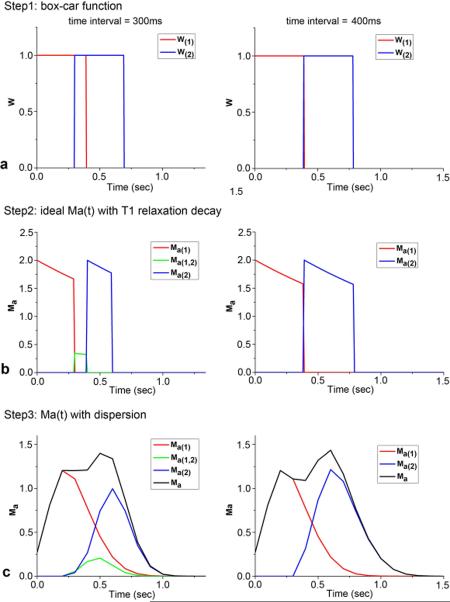
The temporal profile of labeled blood bolus at the tagging site using pulsed ASL, W'(t), can be described as a box-car function convoluted with a dispersion kernel (21). By incorporating relaxation with the T1 of blood (T1b) as the label travels from the tagging region to the imaging region, the magnetization of labeled arterial blood, Ma(t), for PASL can be expressed as
| [1] |
| [2] |
where M0b is the equilibrium magnetization of arterial blood, W'(t) is the temporal profile of the labeled bolus with dispersion, k(t) is the dispersion convolution kernel and W(t) is the box-car function. The Gaussian dispersion model proposed by Hrabe and Lewis (22) was used in the current study
| [3] |
where σ is the standard deviation of the Gaussian normal distribution. Hrabe and Lewis (22) further suggested that the trailing edge (τ2) of the labeled bolus should be more dispersed than the leading edge (τ1), resulting in
| [4] |
where erf(t) is the error function evaluated at t, σ1 and σ2 denote the standard deviation of the leading (τ1) and trailing edge (τ2) of the labeled bolus, respectively. σ2 is generally set to . While alternative dispersion models may be applied, no significant differences have been shown between Gaussian and other dispersion models such as gamma variate function for modeling dMRA signals (21).
In the case of more than one tagging bolus, the observed labeled blood signal will be the simple summation of individual boluses given no interactions between the successive boluses. However, if the leading edge of the subsequent bolus occurs before the trailing edge of the preceding bolus, the overlapping part of the 2 boluses needs to be taken into account. Figure 2 illustrates the steps for simulating 2 labeled boluses with and without overlap respectively. For the sake of simplicity, only the case that the interaction happens between two consecutive labeled boluses was considered in this study. The labeled blood signal with multi-bolus PASL can be expressed as:
| [5] |
| [6] |
where i is the bolus number, Δt is the time interval of two consecutive boluses, Ma(i) is the arterial blood magnetization of the ith bolus according to Eq. [1]. Ma(i,i+1) is the modified bolus caused by the interaction of the ith and (i+1)th labeling boluses (see Fig. 2b&c), and D is the width of tagging slab and v is flow velocity. The parameters of τ1 and τ2 in Wi' and Wi,i+1' were determined by the tagging slab thickness, the gap between the tagging and imaging slab, and flow velocity.
Figure 2.
Illustration of the steps for simulating longitudinal magnetizations of labeled arterial blood of two boluses by using the box-car function (a), then including T1 relaxation (b) and dispersion effects (c). Here two time intervals of 300 and 400ms between boluses were used with the assumption of v=20cm/s.
One advantage of using multi-phase TrueFISP for dMRA is that it causes minimal perturbation of the longitudinal magnetization of flowing spins, as demonstrated by both Bloch equation simulation and phantom experiments (23 24). Therefore, the potential saturation effect of multi-phase TrueFISP on labeled blood signal was ignored in this study, and multi-bolus TrueSTAR dMRA signal can be approximated by the simulated Ma(t) signal.
Methods
Simulations of Multi-bolus TrueSTAR
Multi- and single-bolus TrueSTAR dMRA signals were simulated using in-house Matlab programs (Mathworks, Natick, MA), with parameters matching those used in experiments. The STAR tagging slab was 80mm with a gap of 20mm to the imaging slab. Four flow velocities of 15, 20, 25 and 30 cm/s were chosen for the stimulation, according to the measured mean flow velocity of 21cm/s with a range of 16 to 30 cm/s in internal carotid arteries (ICA) from all the subjects. The leading and trailing edge (τ1 and τ2) of the (single) labeling bolus was determined by the tagging slab thickness, gap between the tagging region to imaging slab, and assumed mean flow velocity. For example, with an 80mm tagging slab, 20mm gap and 20cm/s flow velocity, τ1 and τ2 were 100ms and 500ms respectively. In addition, σ1 of 0.1 was used for the simulation, which was derived from curve-fitting of the time course of experimental single-bolus dMRA data. Simulation was performed for single- and three-bolus TrueSTAR. The time interval between two successive inversion pulses was varied from 200 to 500ms with a step of 100ms. The rest parameters used in the simulation were: T1b= 1600 ms, temporal resolution=100ms.
Experiments
All experiments were performed on a Siemens TIM Trio 3T scanner. Eight healthy volunteers (24.6±3.6yrs, 3males) without history of cerebrovascular diseases participated in this study after providing written informed consents. Time-of-Flight (TOF) MRA images were first acquired with the following parameters: FOV=200×232 mm2, resolution=0.8×0.8×0.8 mm3, TR=20ms, TE=3.6ms, flip angle=18°. For single and multi-bolus TrueSTAR scans, a 3D imaging slab of 40 slices with 1.5mm thickness was scanned to cover the Circle of Willis and its main branches. The remaining imaging parameters were: FOV=220×165 mm2, resolution = 1×1×1.5 mm3, TR/TE= 4.24 / 2.12 ms, rate-2 GRAPPA, centric ordering k-space acquisition with 25 lines per segment, 22 phases from 150 to 2355ms with a step of 105ms, 500ms delay time between the last temporal phase and the following pre-saturation pulse, and a total scan time of 7min.
Two experiments were conducted: 1) Exp 1: Experimental optimization of imaging parameters for multi-bolus dMRA; 2) Exp 2: Evaluation of optimized multi-bolus dMRA by comparison with standard single-bolus PASL dMRA and pCASL dMRA. The main imaging parameters of multi-bolus dMRA in Exp 1&2 are listed in Table 1.
Table 1.
Imaging parameters used in the simulation and experiments
| Parameters of multi-bolus dMRA | Aim1 :Optimization of imaging parameters of multi-bolus TrueSTAR | Aim2: Evaluation of Optimized Multi-bolus TrueSTAR | |
|---|---|---|---|
|
|
|
||
| Simulation | Exp1 | Exp2 | |
| IR thickness (cm) | 8 | 8 | 8 |
| Gap between tagging and imaging slab (cm) | 2 | 2 | 2 |
| Time interval between IRs (ms) | 200/ 300/ 400/ 500 | 210/ 315/ 420/ 525 | 420 |
| Bolus number | 3 | 3 | 2, 3, 4 |
| Flow velocity (cm/s) | 15, 20, 25, 30 | 16 to 30 | |
Exp 1: Experimental Optimization of Multi-bolus TrueSTAR
A three-bolus TrueSTAR sequence was implemented with HS inversion pulses (except the first pulse) inserted after the phase numbers of [2, 4], [3, 6], [4, 8] or [5, 10] during multiphase TrueFISP acquisitions, corresponding to the time interval of 210, 315, 420 and 525 ms, respectively. The HS inversion pulses (15ms duration) were applied to an 80mm slab inferior to the image slab with a 20mm gap. A single-slice phase contrast (PC) MRI was performed at approximately the center of the tagging slab to measure blood flow velocities in internal carotid and vertebral arteries. The imaging parameters were: slice thickness= 5mm, FOV=20cm, matrix size=256×256, TE/TR=5/18ms, flip angle=15°, 80 cm/s velocity encoding.
Exp 2: Evaluation of Optimized Multi-bolus dMRA
The optimal parameters of multi-bolus TrueSTAR were determined based on Exp 1 and simulation results: 400ms was chosen as the optimal bolus interval for an 80mm tagging slab with flow velocities from 15 to 30cm/s. Therefore, the phase interval of 4 (corresponding to 420ms) was chosen for Exp 2, with all other parameters identical to the protocol used in Exp 1. Three TrueSTAR dMRA scans were performed with 2, 3 and 4 inversion pulses inserted after the phase numbers of 4, [4, 8], and [4, 8, 12] during multiphase TrueFISP acquisitions, respectively. For comparison, a standard single-bolus TrueSTAR sequence was performed using otherwise identical imaging parameters. Multi-bolus TrueSTAR can achieve a continuous labeling bolus, analogous to pCASL, by intermittently tagging inflowing blood during data acquisition. For comparison, a pCASL based dMRA sequence was also performed using pCASL with balanced gradients between label and control acquisitions (7). Three pCASL dMRA scans were performed with the labeling durations of 300, 600, and 900ms respectively. The imaging parameters were closely matched to those of multi-bolus TrueSTAR, except that the total phase number of TrueFISP acquisitions was decreased to 15, 15 and 12 respectively, depending on the labeling duration of pCASL.
Patient Study
One AVM patient (42yrs, female) underwent single-bolus and 4-bolus dMRA scans using the same imaging parameters as Exp 2. Following dMRA scans, a TOF-MRA scan was performed after the injection of gadolinium contrast agent (0.1 mmol/kg).
Data Analysis
For both PASL and pCASL based dMRA scans, dMRA images were generated by complex subtraction between label and control acquisitions, followed by maximum intensity projection (MIP) for each temporal phase along three directions (axial, sagittal, and coronal) respectively. The MIP images along each direction can be displayed as a movie to visualize the dynamic blood flow through the Circle of Willis and its main branches.
Collapsed axial MIP images across all phases were generated for each scan. A mask containing the Circle of Willis and all of its branches was manually drawn to remove the skull and background signal outside the brain. Within this mask, a global arterial region-of-interest (ROI) was defined by user-specified threshold to isolate the main branches of the Circle of Willis from the tissue. Dynamic time courses were derived from the global arterial ROI of each subject. For each subject, the background noise level was measured from four manually drawn ROIs from background regions without apparent artifacts. Apparent signal to noise ratio (SNR) was calculated from the mean signal of the MIP image in the global arterial ROI divided by the standard deviation (SD) of the signal in the background ROIs for each temporal phase. Time-dependent SNR was defined by averaging the apparent SNR every three temporal phases to show its variation with time, while average SNR was calculated by averaging the apparent SNR across temporal phases of which the dMRA signal in the arterial ROI was 10% higher than the baseline (the lowest signal across all temporal phases).
Statistical Analysis
Statistical analyses were performed using the SPSS 19.0 software package (SPSS Inc., Chicago, IL). The SNR values of standard single-bolus TrueSTAR, multi-bolus TrueSTAR and pCASL dMRA were compared using paired t-tests. A two-tailed P value of .05 or less was considered to indicate a significant difference.
Results
Simulation of Multi-bolus TrueSTAR
Figure 3a shows the average time courses of simulated dMRA signals using single and three-bolus TrueSTAR using flow velocities from 15 to 30 cm/s with different bolus intervals from 200–500ms, respectively. Compared to the standard single-bolus TrueSTAR, a prolonged bolus of labeled blood can be achieved using multi-bolus TrueSTAR. The width of the integrated bolus increases with prolonged time interval between successive inversion pulses in multi-bolus TrueSTAR, however, with greater signal variations across boluses. As shown in Figure 3a, when the bolus interval is short (e.g., 200ms), there is relatively large overlap between two consecutive boluses resulting in an integrated bolus with reduced peak intensities. With increased bolus interval, there is less overlap between consecutive boluses, resulting in a prolonged bolus in multi-bolus dMRA (300 and 400ms intervals in Fig. 3a). However, signal variations across boluses are also increased as each bolus is more separated in time (see 500ms interval in Fig. 3a). From the simulation, the optimal bolus interval should be around 300–400ms for achieving a prolonged bolus with a relatively stable plateau, assuming a flow velocity range of 15–30 cm/s.
Figure 3.
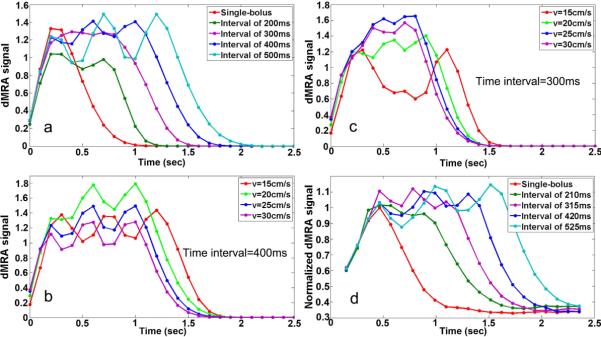
Simulated average labeled blood signal by standard (single) and three-bolus TrueSTAR with different bolus intervals (averaged over flow velocities from 15–30 cm/s) (a), and with bolus intervals of 300ms (b) and 400ms (c) at different flow velocities respectively. The experimental dMRA time courses within global arterial ROI (d) are consistent with simulated dMRA signals (a).
Figure 3b and 3c display simulated multi-bolus dMRA signals with the bolus intervals of 300 and 400ms using various flow velocities respectively. The plateau of the integrated bolus with 400ms interval was relative stable across the flow velocity range of 15–30cm/s. However, the peak signal of multi-bolus dMRA with 300ms interval dropped at the lower flow velocity of 15cm/s. Overall, the bolus interval of 400ms yielded optimal results for achieving a prolonged bolus with a relatively stable plateau.
Exp 1: Experimental Optimization of Multi-bolus TrueSTAR
Figure 3d shows the average dMRA time courses in the arterial ROI using three-bolus TrueSTAR with different bolus intervals respectively. The experimental results are consistent with the simulation result shown in Figure 3a. The duration of the integrated bolus increased with prolonged time interval between successive inversion pulses. With a short bolus interval of 210ms (2 phases), the peak dMRA signal was decreased compared to that of single-bolus dMRA, due to the cancellation of two consecutive boluses. With increased bolus interval, a prolonged continuous bolus was achieved by integrating individual boluses. However, with the longest bolus interval of 525ms, large dMRA signal variations across boluses were observed. Based on both simulation and experimental results shown in Fig. 3, 420ms (4 phases) was chosen as the optimal bolus interval to achieve a prolonged and continuous bolus of labeled blood signal in multi-bolus dMRA.
Exp 2: Evaluation of Optimized Multi-bolus dMRA
Comparison of single- and Multi-bolus TrueSTAR
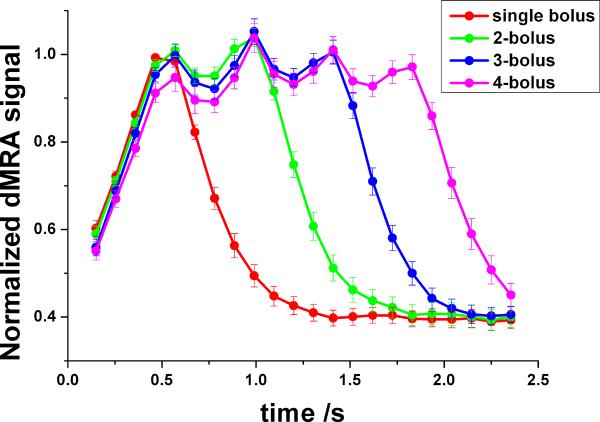
Figure 4 shows axial MIP images of dMRA signals from a representative subject, acquired using standard single-bolus TrueSTAR (top row), TrueSTAR with two (second row), three (third row) and four boluses (bottom row), respectively. In all cases, the passage of labeled blood flowing through the Circle of Willis into the main branches can be visualized with both high spatial and temporal resolution. As shown in Figure 5 of the mean dMRA time courses in the arterial ROI, a prolonged bolus with a relatively constant plateau was achieved using multi-bolus TrueSTAR. As displayed in Figure 6a of the average SNR values of single and multi-bolus dMRA from 5 healthy volunteers, the average SNR of multi-bolus TrueSTAR was 13.6±2.2% higher than that of single-bolus TrueSTAR, although statistical significance was achieved only for 2-bolus TrueSTAR (p=0.029). Figure 6b displays the time-dependent SNR averaged every 3 temporal phases between single- and 2-bolus TrueSTAR. The time-dependent SNR of 2-bolus TrueSTAR was significantly higher between 1 to 1.75s than that of single-bolus TrueSTAR (p<0.05).
Figure 4.
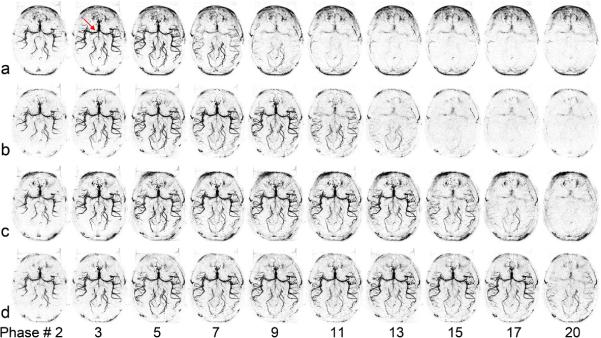
Axial dMRA MIP images acquired using standard TrueSTAR (a), TrueSTAR with two-bolus (b), three-bolus (c) and four-bolus (d) with bolus interval of 420 ms from a representative subject. The average time between two phases was 105, 106, 107, or 108 ms for single, two, three, or four-bolus cases, respectively (due to the insertion of additional HS inversion pulses). The passages of labeled blood flowing through the Circle of Willis (arrow) into the main branches can be well visualized in both standard and multi-bolus TrueSTAR. A prolonged bolus was observed by multi-bolus TrueSTAR.
Figure 5.
Normalized averaged time courses of dMRA signals in the arterial ROI by dividing the maximum dMRA signal with that of the standard TrueSTAR. A prolonged bolus was achieved by multi-bolus dMRA.
Figure 6.
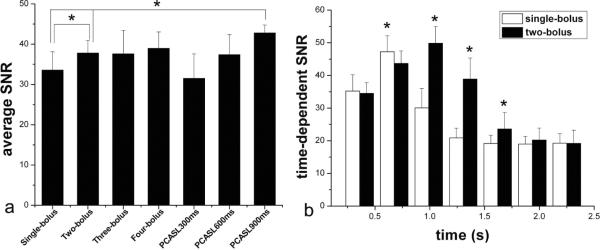
(a) Average SNR of dMRA signals in the arterial ROI by standard, multi-bolus TrueSTAR and pCASL dMRA. (b) Time-dependent SNR of dMRA signals in the arterial ROI by standard and two-bolus TrueSTAR.
Comparison between Multi-bolus TrueSTAR and pCASL-dMRA
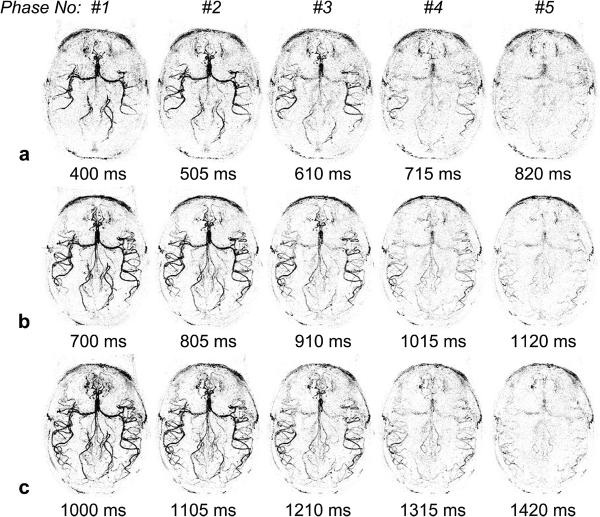
Figure 7 shows pCASL based dMRA images with 3 labeling durations (300, 600 and 900ms) from the same subject of Figure 4. The average SNR of pCASL dMRA with 900ms labeling duration was 27.5±5.9% and 13.6±6.7% higher than that of single-(p=0.006) and 2-bolus TrueSTAR (p=0.007) respectively (Figure 6a). As shown in Figure 7, pCASL based dMRA provided better delineation of fine distal arteries compared to single or multi-bolus PASL based dMRA. However, the arterial inflow phases were missing in pCASL based dMRA.
Figure 7.
Axial dMRA MIP images acquired using pCASL dMRA with the labeling duration of 300 (a), 600 (b), and 900 ms (c) from the same subject of Fig. 4.
Evaluation of Imaging Artifacts in Multi-bolus TrueSTAR
Potential disturbances of the steady-state TrueFISP signal caused by inserting PASL magnetization preparations were investigated. As shown in Figure 8, compared to the TrueFISP images acquired before the inversion pulse, there were slight but visible signal fluctuations in the TrueFISP images acquired following the inversion pulse (arrow). However, the signal fluctuations were largely suppressed in dMRA images by the pairwise subtraction between control and label acquisitions.
Figure 8.
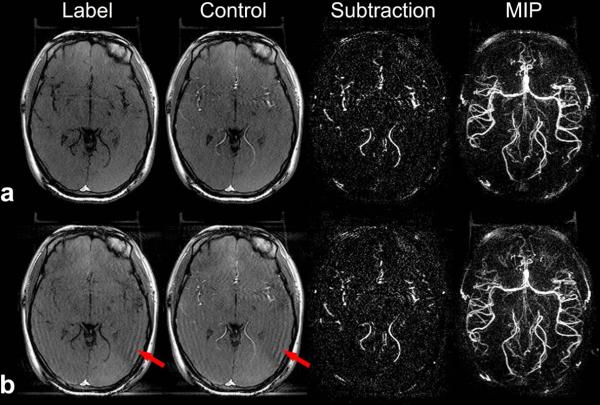
Fluctuations caused by the inserted PASL magnetization preparation during TrueFISP acquisition. A representative slice of label, control, subtraction and MIP images before (a) and after (b) the inversion pulse during the TrueFISP acquisition are shown. Red arrows indicate signal fluctuations in the TrueFISP images acquired following the inversion pulse.
Multi-bolus TrueSTAR dMRA on AVM
Figure 9 shows representative time frames of axial dMRA MIP images as well as collapsed MIP (cMIP) image with multi-bolus (a) and standard single-bolus (b) TrueSTAR of the AVM patient. Dynamic flow passages from the feeding artery (anterior parietal branch of right middle cerebral artery, red arrow), into the nidus (4×6 mm2 in the right supra-marginal gyrus, yellow arrow), and draining veins (right parietal cortical vein draining into the right vein of Labbe) can be clearly visualized using multi-bolus TrueSTAR. Compared to standard single-bolus TrueSTAR, better delineation of the nidus and draining veins with improved contrast were achieved using multi-bolus TrueSTAR. The apparent SNR of the draining vein in the cMIP image was 41.2 and 34.4 for 4-bolus and standard TrueSTAR, respectively.
Figure 9.
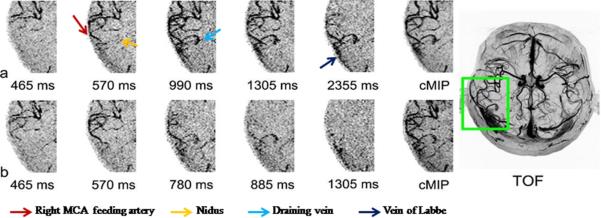
Representative temporal phases of axial dMRA MIP images and collapsed MIP image (cMIP) acquired using 4-bolus TrueSTAR (a) and standard TrueSTAR (b) from the AVM patient. TOF MRA MIP image after the injection of gadolinium contrast agent is shown on the right side. Multi-bolus dMRA provided improved visualization of the nidus and draining veins.
Discussion
A new dMRA technique termed multi-bolus TrueSTAR was introduced in the present study by taking advantages of the phenomenon that the steady-state signal of the TrueFISP sequence is minimally disturbed by periodically inserted magnetization preparations sandwiched by two α/2 pulses (see Figure 8). Compared to single-bolus dMRA, a prolonged bolus with a relatively stable plateau was achieved by multi-bolus TrueSTAR with an optimal time interval between successive labeling pulses. The peak intensities of dMRA signals, however, were comparable between single and multi-bolus TrueSTAR. Pseudo-CASL based dMRA with a sufficiently long tag (labeling duration >600ms) offered increased SNR compared to that of single-bolus TrueSTAR. However, a few temporal phases of arterial inflow were missing using pCASL based dMRA. Overall, the proposed multi-bolus TrueSTAR technique may offer a novel approach by combining the benefits of PASL and pCASL based dMRA.
Pros and Cons of Multi-bolus TrueSTAR
The proposed multi-bolus TrueSTAR was able to achieve a continuous bolus with a relatively stable plateau of labeled blood, analogous to CASL and pCASL. Since its introduction (25), pCASL has drawn growing interests given its high labeling efficiency and SNR, as well as compatibility with MRI hardware. Besides quantitative perfusion imaging, pCASL has recently been applied for both static and dynamic MRA with extensions for vessel-selective labeling (10 12 26). Potential drawbacks of pCASL, however, include long labeling durations during which image acquisition is prohibited. In existing pCASL dMRA studies, a tradeoff had to be made between the duration of labeling pulses thus SNR, and the number of arterial inflow phases that may be sacrificed (10). Compared to pCASL dMRA, multi-bolus TrueSTAR offers the benefit for visualizing the full dynamic passage of labeled blood without penalties in scan time. In addition, multi-bolus dMRA images acquired during the bolus plateau may be averaged to improve SNR and the delineation of distal arteries. Because the duration of the bolus plateau can be as long as required, there should be minimal concern for missing the peak bolus signal as in existing PASL based MRA.
One critical issue in multi-bolus TrueSTAR regards the timing of multiple inversion pulses during multi-phase TrueFISP acquisitions. If the time interval between two consecutive inversion pulses is too short, the two boluses will partially cancel each other leading to a loss of tagging efficiency. Oppositely, if the time interval is too long, there will be obvious signal drop before the next inversion pulse is applied. With a mean flow velocity of 20cm/s in carotid arteries, both theoretical analysis and experimental results indicated that multi-bolus TrueSTAR with a time interval of approximately 400 ms between consecutive inversion pulses can provide a relatively continuous bolus of labeled blood. The optimal bolus interval of multi-bolus dMRA for clinical populations (e.g. steno-occlusive diseases), however, awaits to be investigated in future studies. Another potential shortcoming of multi-bolus TrueSTAR is that the TrueFISP readout is sensitive to field inhomogeneity effects, which may cause banding artifacts around the orbitofrontal cortex. A phase cycling approach may be necessary to address this issue in future studies.
Multi-bolus TrueSTAR dMRA on AVM
Multi-bolus dMRA was piloted in an AVM patient, which depicted the entire dynamic blood flow from the arterial feeder to the nidus and draining veins of the AVM. Compared to standard single-bolus dMRA, multi-bolus dMRA provided improved visualization of the nidus and draining veins. Although the peak intensity of multi-bolus TrueSTAR was comparable with that of the standard single-bolus TrueSTAR in healthy volunteers, it may be increased in distal vessels and/or draining veins of AVM due to greater dispersion (or smoothing) effects leading to an enhanced integrated bolus. The capability of multi-bolus dMRA for the identification of feeding arteries of an AVM is helpful for standard microsurgical operation in which the arterial feeders are generally occluded first, followed by excision of the nidus and finally resection of the draining veins. Information of feeding arteries can also act as referable factors for determining the sequence of arteries to be managed. Nevertheless, the clinical value of multi-bolus TrueSTAR versus existing techniques such as DSA awaits to be evaluated in future studies with larger cohorts of patients.
Multi-bolus dMRA and Perfusion Imaging
Past studies have employed multiple inversion pulses in ASL experiments for perfusion imaging (27), with an approximately 2 fold SNR gain in perfusion signal compared to the standard FAIR technique at 3T. The drawbacks for using multi-bolus approaches for perfusion imaging, however, include uncertainties in the arterial input function and arterial transit time of the labeled blood due to variations in flow velocities across subjects. As a result, quantitative perfusion imaging using multi-bolus PASL remains challenging. The proposed multi-bolus TrueSTAR may be more suitable for dMRA than perfusion imaging, since no delay is required between the labeling and image acquisition and the arterial input magnetization of labeled blood can be visualized with both high spatial and temporal resolution in 4D space. However, unlike brain tissue that can serve as a reservoir for labeled blood water, the labeled blood flows through an arterial voxel with limited dispersion. As shown by both simulation and experimental results, the integrated bolus of multi-bolus dMRA was primarily prolonged rather than enhanced compared to that of single-bolus dMRA. In the future, it may be possible to combine multi-bolus dMRA and perfusion imaging to improve the SNR and accuracy of quantitative perfusion MRI using PASL.
In conclusion, a novel time-resolved 4D dMRA technique termed multi-bolus TrueSTAR was introduced in this study, by combining the advantages of both PASL and pCASL based dMRA. Its potential clinical utility, such as the delineation of feeding arteries, nidus and draining veins of AVM was initially demonstrated in this study.
Acknowledgement
This study was supported by NIH grants R01-MH080892, R01-NS081077 and R01-EB014922. The authors are grateful to Drs. Alessandra Gorgulho and Antonio De Salles for helping with patient scanning, and Cheng Li for his assistance with the manuscript.
References
- 1.Dixon WT, Du LN, Faul DD, Gado M, Rossnick S. Projection angiograms of blood labeled by adiabatic fast passage. Magn Reson Med. 1986;3(3):454–62. doi: 10.1002/mrm.1910030311. [DOI] [PubMed] [Google Scholar]
- 2.Nishimura DG, Macovski A, Pauly JM. Considerations of magnetic resonance angiography by selective inversion recovery. Magn Reson Med. 1988;7(4):472–84. doi: 10.1002/mrm.1910070410. [DOI] [PubMed] [Google Scholar]
- 3.Nishimura DG, Macovski A, Pauly JM, Conolly SM. MR angiography by selective inversion recovery. Magn Reson Med. 1987;4(2):193–202. doi: 10.1002/mrm.1910040214. [DOI] [PubMed] [Google Scholar]
- 4.Detre JA, Leigh JS, Williams DS, Koretsky AP. Perfusion imaging. Magn Reson Med. 1992;23:37–45. doi: 10.1002/mrm.1910230106. [DOI] [PubMed] [Google Scholar]
- 5.Williams DS, Detre JA, Leigh JS, Koretsky AP. Magnetic resonance imaging of perfusion using spin inversion of arterial water. Proc Natl Acad Sci USA. 1992;89:212–16. doi: 10.1073/pnas.89.1.212. [DOI] [PMC free article] [PubMed] [Google Scholar]
- 6.Detre JA, Rao H, Wang DJ, Chen YF, Wang Z. Applications of arterial spin labeled MRI in the brain. J Magn Reson Imaging. 2012;35(5):1026–37. doi: 10.1002/jmri.23581. [DOI] [PMC free article] [PubMed] [Google Scholar]
- 7.Wu WC, Fernandez-Seara M, Detre JA, Wehrli FW, Wang J. A theoretical and experimental investigation of the tagging efficiency of pseudocontinuous arterial spin labeling. Magn Reson Med. 2007;58(5):1020–7. doi: 10.1002/mrm.21403. [DOI] [PubMed] [Google Scholar]
- 8.Dai W, Garcia D, de Bazelaire C, Alsop DC. Continuous flow-driven inversion for arterial spin labeling using pulsed radio frequency and gradient fields. Magn Reson Med. 2008;60(6):1488–97. doi: 10.1002/mrm.21790. [DOI] [PMC free article] [PubMed] [Google Scholar]
- 9.Wong EC. Vessel-encoded arterial spin-labeling using pseudocontinuous tagging. Magn Reson Med. 2007;58(6):1086–91. doi: 10.1002/mrm.21293. [DOI] [PubMed] [Google Scholar]
- 10.Okell TW, Chappell MA, Woolrich MW, Gunther M, Feinberg DA, Jezzard P. Vessel-encoded dynamic magnetic resonance angiography using arterial spin labeling. Magn Reson Med. 2010;64(2):430–8. doi: 10.1002/mrm.22412. [DOI] [PubMed] [Google Scholar]
- 11.Koktzoglou I, Gupta N, Edelman RR. Nonenhanced extracranial carotid MR angiography using arterial spin labeling: improved performance with pseudocontinuous tagging. J Magn Reson Imaging. 2011;34(2):384–94. doi: 10.1002/jmri.22628. [DOI] [PubMed] [Google Scholar]
- 12.Wu H, Block WF, Turski PA, Mistretta CA, Johnson KM. Noncontrast-enhanced three-dimensional (3D) intracranial MR angiography using pseudocontinuous arterial spin labeling and accelerated 3D radial acquisition. Magn Reson Med. 2012 doi: 10.1002/mrm.24298. [DOI] [PMC free article] [PubMed] [Google Scholar]
- 13.Bi X, Weale P, Schmitt P, Zuehlsdorff S, Jerecic R. Non-contrast-enhanced four-dimensional (4D) intracranial MR angiography: a feasibility study. Magn Reson Med. 2010;63(3):835–41. doi: 10.1002/mrm.22220. [DOI] [PubMed] [Google Scholar]
- 14.Yan L, Wang S, Zhuo Y, Wolf RL, Stiefel MF, An J, Ye Y, Zhang Q, Melhem ER, Wang DJ. Unenhanced dynamic MR angiography: high spatial and temporal resolution by using true FISP-based spin tagging with alternating radiofrequency. Radiology. 2010;256(1):270–9. doi: 10.1148/radiol.10091543. [DOI] [PMC free article] [PubMed] [Google Scholar]
- 15.Yu S, Yan L, Yao Y, Wang S, Yang M, Wang B, Zhuo Y, Ai L, Zhao J, Wang DJ. Evaluation of Non-contrast Dynamic MRA in Intracranial Arteriovenous Malformation (AVM): Comparison with time of flight (TOF) and digital subtraction angiography (DSA) Magn Rason Imag. 2012;30(6):869–77. doi: 10.1016/j.mri.2012.02.027. [DOI] [PMC free article] [PubMed] [Google Scholar]
- 16.Xu J, Shi D, Chen C, Li Y, Wang M, Han X, Jin L, Bi X. Noncontrast-enhanced four-dimensional MR angiography for the evaluation of cerebral arteriovenous malformation: A preliminary trial. J Magn Reson Imaging. 2011;34(5):1199–205. doi: 10.1002/jmri.22699. [DOI] [PubMed] [Google Scholar]
- 17.Lanzman RS, Kropil P, Schmitt P, Bi X, Gliem M, Miese FR, Hanggi D, Kamp M, Scherer A, Turowski B, Blondin D. Nonenhanced ECG-gated time-resolved 4D Steady-state free precession (SSFP) MR angiography (MRA) for assessment of cerebral collateral flow: comparison with digital subtraction angiography (DSA) Eur Radiol. 2011;21(6):1329–38. doi: 10.1007/s00330-010-2051-9. [DOI] [PubMed] [Google Scholar]
- 18.Okell TW, Chappell MA, Schulz UG, Jezzard P. A kinetic model for vessel-encoded dynamic angiography with arterial spin labeling. Magn Reson Med. 2012;68(3):969–79. doi: 10.1002/mrm.23311. [DOI] [PMC free article] [PubMed] [Google Scholar]
- 19.Scheffler K, Heid O, Hennig J. Magnetization preparation during the steady state: fat-saturated 3D TrueFISP. Magn Reson Med. 2001;45(6):1075–80. doi: 10.1002/mrm.1142. [DOI] [PubMed] [Google Scholar]
- 20.Edelman RR, Siewert B, Darby DG, Thangaraj V, Nobre AC, Mesulam MM, Warach S. Qualitative mapping of cerebral blood flow and functional localization with echo-planar MR imaging and signal targeting with alternating radio frequency. Radiology. 1994;192:513–20. doi: 10.1148/radiology.192.2.8029425. [DOI] [PubMed] [Google Scholar]
- 21.Chappell MA, Woolrich MW, Kazan S, Jezzard P, Payne SJ, Macintosh BJ. Modeling dispersion in arterial spin labeling: Validation using dynamic angiographic measurements. Magnetic resonance in medicine : official journal of the Society of Magnetic Resonance in Medicine / Society of Magnetic Resonance in Medicine. 2012 doi: 10.1002/mrm.24260. doi: 10.1002/mrm.24260. [DOI] [PubMed] [Google Scholar]
- 22.Hrabe J, Lewis DP. Two analytical solutions for a model of pulsed arterial spin labeling with randomized blood arrival times. J Magn Reson. 2004;167(1):49–55. doi: 10.1016/j.jmr.2003.11.002. [DOI] [PubMed] [Google Scholar]
- 23.Yan L, Li C, Kilroy E, Wehrli FW, Wang DJ. Quantification of arterial cerebral blood volume using multiphase-balanced SSFP-based ASL. Magnetic resonance in medicine : official journal of the Society of Magnetic Resonance in Medicine / Society of Magnetic Resonance in Medicine. 2012;68(1):130–9. doi: 10.1002/mrm.23218. [DOI] [PMC free article] [PubMed] [Google Scholar]
- 24.Wu WC, Jain V, Li C, Giannetta M, Hurt H, Wehrli FW, Wang DJ. In vivo venous blood T1 measurement using inversion recovery true-FISP in children and adults. Magnetic resonance in medicine : official journal of the Society of Magnetic Resonance in Medicine / Society of Magnetic Resonance in Medicine. 2010;64(4):1140–7. doi: 10.1002/mrm.22484. [DOI] [PMC free article] [PubMed] [Google Scholar]
- 25.Garcia DM, de Bazelaire C, Alsop D. Pseudo-continuous flow driven adiabatic inversion for arterial spin labeling. Proc Intl Soc Magn Reson Med. 2005;13:37. doi: 10.1002/mrm.21790. [DOI] [PMC free article] [PubMed] [Google Scholar]
- 26.Robson PM, Dai W, Shankaranarayanan A, Rofsky NM, Alsop DC. Time-resolved vessel-selective digital subtraction MR angiography of the cerebral vasculature with arterial spin labeling. Radiology. 2010;257(2):507–15. doi: 10.1148/radiol.10092333. [DOI] [PMC free article] [PubMed] [Google Scholar]
- 27.Fujiwara Y, Kimura H, Miyati T, Kabasawa H, Matsuda T, Ishimori Y, Yamaguchi I, Adachi T. MR perfusion imaging by alternate slab width inversion recovery arterial spin labeling (AIRASL): a technique with higher signal-to-noise ratio at 3.0 T. MAGMA. 2012;25(2):103–11. doi: 10.1007/s10334-011-0301-8. [DOI] [PubMed] [Google Scholar]


