

Abstract
We performed risk assessment for Crohn’s disease (CD) and ulcerative colitis (UC), the two common forms of inflammatory bowel disease (IBD), by using data from the International IBD Genetics Consortium’s Immunochip project. This data set contains ∼17,000 CD cases, ∼13,000 UC cases, and ∼22,000 controls from 15 European countries typed on the Immunochip. This custom chip provides a more comprehensive catalog of the most promising candidate variants by picking up the remaining common variants and certain rare variants that were missed in the first generation of GWAS. Given this unprecedented large sample size and wide variant spectrum, we employed the most recent machine-learning techniques to build optimal predictive models. Our final predictive models achieved areas under the curve (AUCs) of 0.86 and 0.83 for CD and UC, respectively, in an independent evaluation. To our knowledge, this is the best prediction performance ever reported for CD and UC to date.
Main Text
Genome-wide association studies (GWAS) have been fruitful in identifying disease susceptibility loci for Crohn’s disease (CD [MIM 266600]) and ulcerative colitis (UC [MIM 191390]), the two common forms of inflammatory bowel disease (IBD [MIM 266600])1–3. However, it remains unclear whether these advances can deliver sufficiently accurate predictions to make targeted intervention realistically possible. There have been several early attempts to harness GWAS for improving individual prediction of complex disease risk. However, like many other complex diseases, existing results for CD and UC risk prediction are generally modest, if not negative.4–7
We argue that the discouraging risk prediction performance so far may be attributed to three major factors: insufficient sample size, incomprehensive catalog of variants, and the curse of high dimensionality in modeling GWAS data. First of all, the previous sample sizes are limited and may not be sufficient for the more challenging IBD risk prediction. Sample sizes with a low number of thousands were used in previous studies. By using a similar sample size, we reported an AUC of 0.84 for type 1 diabetes (T1D [MIM 222100]).8 The success of T1D may be partially attributed to its high heritability and strong dependence on the human leukocyte antigen (HLA) genes. For the less heritable and less HLA-dependent IBD,9 we may need more samples to achieve comparable performance. Second, most previous GWAS cover only a proportion of common variants by using tag SNPs, which are expected by linkage disequilibrium (LD) to implicate causal variants in their neighborhood. However, not all (causal) variants, particularly those that are less common or rare, can be interrogated well by examining common tag SNPs. Predictive power can, in turn, be reduced as a result. Third, prediction for high-dimensional data is computationally demanding and may suffer from overfitting. Many existing approaches use a handful of validated loci or simply prioritize and select predictors by individual association significance. Neither of the two strategies is optimal.
We performed risk assessment for IBD by using the largest data set to date from the International IBD Genetics Consortium’s Immunochip project. This data set provides a total of 60,828 samples from 15 European countries, including 20,076 CD cases, 15,307 UC cases, and 25,445 controls, typed by 11 different genotyping centers on the Immunochip, a custom Illumina Infinium chip. This custom chip is designed to perform both deep replication of suggestive associations and fine mapping of established GWAS significant loci. It provides a more comprehensive catalog of the most promising candidate variants by picking up the remaining common variants and rare variants that are missed in the first generation of GWAS. We designed a two-step feature selection strategy for prediction modeling.
After rigorous sample and SNP quality control (QC), 178,822 SNPs of 17,379 CD cases, 13,458 UC cases, and 22,442 health controls remained.3 We combined the CD cases with the controls and randomly divided them into three folds of equal size for preselection, training, and testing, respectively. To ensure independence of the testing fold, we further required samples assigned to this fold may not come from the previously published GWAS data sets.3 We conducted single SNP association tests by using the first fold data set, based on which we filtered out SNPs with p values > 10−4 and minor allele frequency (MAF) < 0.01. As a result, 10,799 SNPs survived. The goal of this preselection step was to reduce the large number of predictors efficiently to a manageable range. Then we applied penalized logistic regression (LR) with L1 penalty10 to the survived SNPs of the second fold data set. This L1 penalized approach carries out model selection while fitting a predictive model. It tends to select only one candidate among a group of SNPs with high pairwise LD. Therefore, more SNPs may be filtered out for the final predictive model. The number of SNPs entering into the final model depended on the penalty parameter λ, which was selected by using 10-fold cross-validation (Figure 1). Specifically, we calculated the average AUC for different values of λ and took the largest value of λ (yielding the most parsimonious model) such that AUC was within 1 SE of the optimum. The optimal 10-fold cross-validated AUC over the second CD data set was 0.864. We ended up with a 573-SNP CD predictive model. The same analysis strategy was applied to the combined data set of the UC cases and the controls. The control samples were shared between the UC and CD data sets. After the preselection step using the first fold UC data set, 6,968 SNPs survived. The model selection and fitting using the second fold UC data set achieved a 10-fold cross-validated AUC of 0.830 and resulted in a 366-SNP UC predictive model.
Figure 1.
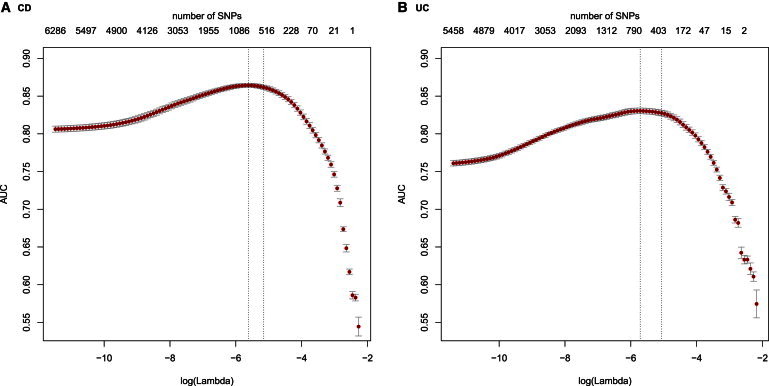
Ten-Fold Cross-Validation for Model Selection and Training
SNPs that survived fold 1 preselection may still contain noisy predictors. We employed L1-penalized logistic regression to further remove irrelevant SNPs while fitting a predictive model using fold 2 data. The larger the penalty parameter lambda, the more SNPs were removed. The numbers on the top of the plot are the corresponding numbers of SNPs survived under different values of lambda shown along the x axis. We selected lambda by using 10-fold cross validation. Specifically, we calculated the average AUC for different values of lambda and took the largest value yielding the most parsimonious model such that AUC is within 1 SE of the optimum (the two vertical dashed lines). The optimal 10-fold cross-validated AUCs on fold 2 data were 0.864 and 0.830 for (A) CD and (B) UC, respectively.
We tested the CD and UC predictive models on the third fold data sets. They achieved AUC of 0.864 (95% CI = [0.8573, 0.8692]) and 0.826 (95% CI = [0.8164, 0.8315]) for CD and UC, respectively. To our knowledge, this is the best prediction performance ever reported for CD and UC. To decipher where the improved performance came from, we evaluated several different forms of the risk assessment models. We first evaluated the contribution by sample size. We used different percentages of the second fold data set for training followed by testing on the third fold data set. AUC results are shown in Figure 2A. We can see that when sample size was small (a low number of thousands) AUC was inferior (<0.8 for CD and <0.7 for UC), consistent with previous studies. Because Figure 2A suggests that the AUC might not have peaked or plateaued at a relative sample size of 100%, it was tempting to reckon that even higher AUC might be achieved by using larger sample sizes for the training data. Therefore we further added samples from the testing fold to the training fold. We observed very comparable plateaued AUC without significant changes (see Table S1 available online). These results suggest that we either reached the peaks for prediction significance or that we required much greater sample sizes to improve further. In addition, caution should be used for batch effect when combining data from different sources. Our batch effect check did not find evidence of such effects contributing to the high predictive ability (Supplemental Information).
Figure 2.
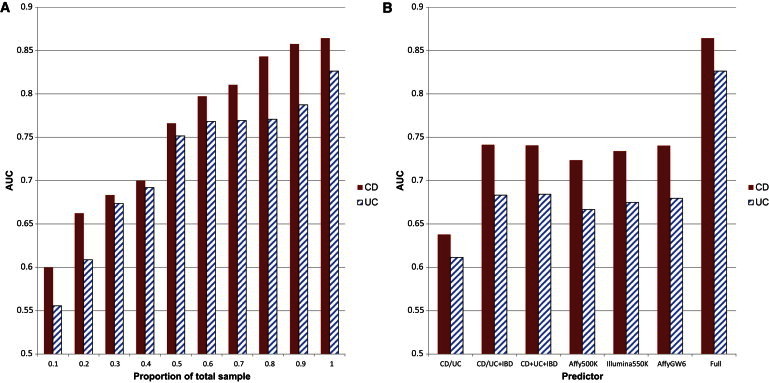
Contribution of Sample Size and Predictors
For all experiments, we trained logistic regression models on fold 2 data and plotted AUCs of testing on fold 3 data.
(A) 10% sample sizes of fold 2 data were 1,327 and 1,197 for CD and UC, respectively.
(B) UC/CD: AUCs were achieved by using only the 30 CD-specific loci or the 23 UC-specific loci; UC/CD + IBD: AUCs were achieved by using the UC or CD loci plus the 110 IBD loci; UC + CD + IBD: AUCs were achieved by using all the 163 IBD loci; Affy500K: AUCs were achieved by using the 1,201/724 CD/UC Immunochip SNPs that are also typed on the Affymetrix 500K chip; Illumina550K: AUCs were achieved by using 1,728/1,142 CD/UC Immunochip SNPs that are also typed on the Illumina 550K chip; AffyGW6: AUCs were achieved by using 1,933/1,204 CD/UC Immunochip SNPs that are also typed on Affymetrix Genome-Wide SNP Array 6.0 chip; full: AUCs were achieved by using all Immunochip SNPs.
We next investigated the contribution by predictors. The most recent IBD association study increases the number of susceptibility loci to 163, including 23 UC-specific loci, 30 CD-specific loci, and 110 IBD loci.3 By using different combinations of these confirmed loci as predictors, we trained LR on the second fold data set followed by testing on the third fold data set. AUC results are shown in Figure 2B. We note that these validated loci were selected by using all data so the AUC results might be inflated. Even so, the resulting performance was inferior (AUC < 0.75 for CD and AUC < 0.7 for UC), confirming that using only validated loci is not a good strategy for risk prediction. To save cost, biotechnology companies design their popular GWAS chips to cover only a proportion of common variants using tag SNPs. Out of the 10,799 preselected CD SNPs, only 1,201, 1,728, and 1,933 are typed on the popular Affymetrix 500K, Illumina550K, and Affymetrix Genome-Wide SNP Array 6.0 chips, respectively. Similarly, only 724, 1,142, and 1,204 out of the 6,968 preselected UC SNPs are typed on the three chips, respectively. When using only these SNPs for model selection, training, and testing, we again obtained disappointing AUCs as shown in Figure 2B. An examination of the final predictors showed that more than 60% of the selected predictors were not typed by current genotyping chips used for GWAS. The dense variant coverage of the Immunochip increases the chance of including causal variants or implicating them better with LD. We also noticed that many final predictors were less common or rare (115 CD and 72 UC SNPs with MAF < 0.05). When filtering by using MAF < 0.05 in fold 1, AUCs for fold 3 dropped to 0.825 and 0.780 for CD and UC, respectively. Together, these results may partially explain the discouraging risk prediction performance in previous studies that were not able to utilize comprehensive catalog of variants.
Finally, we compared our approach with a previous simple log odds method.4 We estimated association significance and odds ratio (OR) of each variant by using fold 1 and fold 2 data. We then took all variants with a p value < 0.01 and pruned correlated ones slightly by setting linkage disequilibrium (LD) threshold at r2 = 0.8. After pruning, 15,158 SNPs and 8,831 SNPs remained for CD and UC, respectively. By using these SNPs, the simple log odds method achieved AUCs of only 0.730 and 0.685 in predicting the testing data for CD and UC, respectively. Even when varying significance thresholds were allowed, the simple method achieved its best AUCs of only 0.767 and 0.705 for CD and UC, respectively. This analysis substantiated the improvement contributed by our more appropriate modeling. These data sets are some of the largest, if not the largest, ever used for SNP-based prediction, with room to start exploring issues that have never been adequately addressed before. Therefore, we did some preliminary exploration by conducting a cursory analysis and comparing AUC from our linear additive models with two other nonadditive models, Support Vector Machines (SVM) with RBF kernels and gradient boosted trees (GBT), allowing for modeling interactions. The SVM demonstrated very comparable performance (AUC = 0.862 and 0.826 for CD and UC, respectively), whereas GBT showed inferior performance (AUC = 0.802 and 0.782 for CD and UC, respectively) (Table S3).
The logistic regression model gives a posterior probability of having the disease. By using a 0.5 cutoff, the sensitivity of our model in predicting CD was 71% and specificity was 83%, which were better than the 36% sensitivity and 73% specificity based on the NOD2 (NOD2 [MIM 605956]) mutation.11 The clinical utility of this performance depends on the disease prevalence at the particular clinical setting. For example, assuming 2.5% prevalence for relatives of CD patients12 implies a positive predictive value of 10% and a negative predictive value of 99%.
High dimensionality makes prediction very challenging. A simple expression on how high dimensionality adversely impacts classification performance has been obtained recently.13 The difficulty of high-dimensional classification is intrinsically caused by the many embedded noisy features that do not contribute to the reduction of misclassification rate. We often reasonably assume sparsity; namely, that only a small proportion of the many candidate features are relevant, and apply the feature selection in high-dimensional prediction. As a result, penalized methods, because they achieve feature selection and classifier construction simultaneously, have become very popular with the emergence of high-dimensional data in the past decade.14 Representative penalties for variable selection include L1 (Lasso),10 SCAD,15 and elastic-net.16 Penalized methods have also been applied for genetic risk prediction; for example, logistic regression with elastic-net and L1 penalties,7 SVM with elastic-net and L1 penalties,17 and logistic regression with L1 and SCAD penalties.18 See Abraham et al.17 for more examples and references therein. It has been found that penalized methods in general outperform unpenalized methods.18
Here we employ a two-step feature selection strategy, namely, simple screening followed by L1 logistic regression. Theoretical justification for a similar strategy has been obtained under linear regression setting with a continuous response.19 The idea is to reduce dimensionality from high to a relatively large scale that is below the sample size, by using fast and efficient independent screening. The screening step aims to reduce dimensionality drastically, but at the same time it makes relevant features survive. For example, we used p = 10−4 as threshold and believed that most, if not all, relevant features would survive. Clearly this tradeoff had led to survival of quite a few noisy features. We then further excluded them by employing the extra lower dimensional model-selection method with the L1 penalty. Such a two-step strategy makes it more feasible to do model selection with ultra-high dimensionality and speeds up variable selection drastically. For example, we tried to combine fold 1 and fold 2 data and applied directly L1-regularized logistic regression without screening. Our program needed over 100 GB RAM and days for just loading the data. Comparable results were obtained with CD AUC = 0.869 and UC AUC = 0.821.
The main reason we use L1 in our experiments for model selection is that we employ computationally expensive cross-validation to tune the penalty parameter. The L1 penalty has only one parameter to be tuned, while it has two for SCAD and elastic-net. Given the size of the data, it is prohibitively costly at present, if feasible at all, to tune thoroughly over two or more parameters. There are two reasons that we use simple linear models: their much affordable computational cost and decent performance for high-dimensional data. It is found that when feature size (p) is much larger than sample size (n), linear classifiers may give comparable or even better performances than nonlinear ones in many applications, although nonlinear methods are known to be more flexible.20 There is some theoretical justification that linear classifiers are natural choices to discriminate two classes when p ≫ n.21 From a genetics point of view, when many SNPs are typed, nonadditive effects may have been interrogated well by individual markers that can be characterized by using just linear models. Here, we obtain very comparable performance when using SVM with nonlinear RBF kernel. It is noted that because of computational scope, we simply use default parameters for SVM. We don’t exclude the possibility that both SVM and GBT may be further improved with careful and thorough parameter tuning.
In conclusion, our results for IBD lend support to an optimistic view that genotype-based genetic risk prediction may be feasible given sufficient sample size, comprehensive variant coverage, and proper modeling. With the recent advance for large-scale high-dimensional modeling in machine learning, new approaches warrant future study for improving genetic risk prediction further.
Acknowledgments
We thank two anonymous reviewers for their constructive comments, which have greatly helped improve the presentation of the article.
Contributor Information
Zhi Wei, Email: zhiwei04@gmail.com.
Hakon Hakonarson, Email: hakonarson@email.chop.edu.
Supplemental Data
Web Resources
The URLs for data presented herein are as follows:
Online Mendelian Inheritance in Man (OMIM), http://www.omim.org/
References
- 1.Franke A., McGovern D.P., Barrett J.C., Wang K., Radford-Smith G.L., Ahmad T., Lees C.W., Balschun T., Lee J., Roberts R. Genome-wide meta-analysis increases to 71 the number of confirmed Crohn’s disease susceptibility loci. Nat. Genet. 2010;42:1118–1125. doi: 10.1038/ng.717. [DOI] [PMC free article] [PubMed] [Google Scholar]
- 2.Anderson C.A., Boucher G., Lees C.W., Franke A., D’Amato M., Taylor K.D., Lee J.C., Goyette P., Imielinski M., Latiano A. Meta-analysis identifies 29 additional ulcerative colitis risk loci, increasing the number of confirmed associations to 47. Nat. Genet. 2011;43:246–252. doi: 10.1038/ng.764. [DOI] [PMC free article] [PubMed] [Google Scholar]
- 3.Jostins L., Ripke S., Weersma R.K., Duerr R.H., McGovern D.P., Hui K.Y., Lee J.C., Schumm L.P., Sharma Y., Anderson C.A., International IBD Genetics Consortium (IIBDGC) Host-microbe interactions have shaped the genetic architecture of inflammatory bowel disease. Nature. 2012;491:119–124. doi: 10.1038/nature11582. [DOI] [PMC free article] [PubMed] [Google Scholar]
- 4.Evans D.M., Visscher P.M., Wray N.R. Harnessing the information contained within genome-wide association studies to improve individual prediction of complex disease risk. Hum. Mol. Genet. 2009;18:3525–3531. doi: 10.1093/hmg/ddp295. [DOI] [PubMed] [Google Scholar]
- 5.Jakobsdottir J., Gorin M.B., Conley Y.P., Ferrell R.E., Weeks D.E. Interpretation of genetic association studies: markers with replicated highly significant odds ratios may be poor classifiers. PLoS Genet. 2009;5:e1000337. doi: 10.1371/journal.pgen.1000337. [DOI] [PMC free article] [PubMed] [Google Scholar]
- 6.Kang J., Kugathasan S., Georges M., Zhao H., Cho J.H., NIDDK IBD Genetics Consortium Improved risk prediction for Crohn’s disease with a multi-locus approach. Hum. Mol. Genet. 2011;20:2435–2442. doi: 10.1093/hmg/ddr116. [DOI] [PMC free article] [PubMed] [Google Scholar]
- 7.Kooperberg C., LeBlanc M., Obenchain V. Risk prediction using genome-wide association studies. Genet. Epidemiol. 2010;34:643–652. doi: 10.1002/gepi.20509. [DOI] [PMC free article] [PubMed] [Google Scholar]
- 8.Wei Z., Wang K., Qu H.Q., Zhang H., Bradfield J., Kim C., Frackleton E., Hou C., Glessner J.T., Chiavacci R. From disease association to risk assessment: an optimistic view from genome-wide association studies on type 1 diabetes. PLoS Genet. 2009;5:e1000678. doi: 10.1371/journal.pgen.1000678. [DOI] [PMC free article] [PubMed] [Google Scholar]
- 9.Lee S.H., Wray N.R., Goddard M.E., Visscher P.M. Estimating missing heritability for disease from genome-wide association studies. Am. J. Hum. Genet. 2011;88:294–305. doi: 10.1016/j.ajhg.2011.02.002. [DOI] [PMC free article] [PubMed] [Google Scholar]
- 10.Tibshirani R. Regression shrinkage and selection via the lasso. J. R. Stat. Soc., B. 1996;73:267–288. [Google Scholar]
- 11.Adler J., Rangwalla S.C., Dwamena B.A., Higgins P.D. The prognostic power of the NOD2 genotype for complicated Crohn’s disease: a meta-analysis. Am. J. Gastroenterol. 2011;106:699–712. doi: 10.1038/ajg.2011.19. [DOI] [PubMed] [Google Scholar]
- 12.Peeters M., Nevens H., Baert F., Hiele M., de Meyer A.M., Vlietinck R., Rutgeerts P. Familial aggregation in Crohn’s disease: increased age-adjusted risk and concordance in clinical characteristics. Gastroenterology. 1996;111:597–603. doi: 10.1053/gast.1996.v111.pm8780562. [DOI] [PubMed] [Google Scholar]
- 13.Fan J., Fan Y. High Dimensional Classification Using Features Annealed Independence Rules. Ann. Stat. 2008;36:2605–2637. doi: 10.1214/07-AOS504. [DOI] [PMC free article] [PubMed] [Google Scholar]
- 14.Fan J., Lv J. A Selective Overview of Variable Selection in High Dimensional Feature Space. Stat Sin. 2010;20:101–148. [PMC free article] [PubMed] [Google Scholar]
- 15.Fan J., Li R. Variable selection via nonconcave penalized likelihood and its oracle properties. J. Am. Stat. Assoc. 2001;96:1348–1360. [Google Scholar]
- 16.Zou H., Hastie T. Regularization and variable selection via the elastic net. J. R. Stat. Soc. Series B Stat. Methodol. 2005;67:301–320. [Google Scholar]
- 17.Abraham G., Kowalczyk A., Zobel J., Inouye M. Performance and robustness of penalized and unpenalized methods for genetic prediction of complex human disease. Genet. Epidemiol. 2013;37:184–195. doi: 10.1002/gepi.21698. [DOI] [PubMed] [Google Scholar]
- 18.Austin E., Pan W., Shen X. Penalized regression and risk prediction in genome-wide association studies. Statistical Analysis and Data Mining. 2013;6 doi: 10.1002/sam.11183. Published online February 22, 2013. [DOI] [PMC free article] [PubMed] [Google Scholar]
- 19.Zhang H.H., Lv J. Sure independence screening for ultrahigh dimensional feature space. J. R. Stat. Soc. Series B Stat. Methodol. 2008;70:849–911. doi: 10.1111/j.1467-9868.2008.00674.x. [DOI] [PMC free article] [PubMed] [Google Scholar]
- 20.Hastie T., Tibshirani R., Friedman J.J.H. Springer; New York: 2009. The elements of statistical learning. [Google Scholar]
- 21.Hall P., Marron J., Neeman A. Geometric representation of high dimension, low sample size data. J. R. Stat. Soc. Series B Stat. Methodol. 2005;67:427–444. [Google Scholar]
Associated Data
This section collects any data citations, data availability statements, or supplementary materials included in this article.