

Background: Targeted therapies with tyrosine kinase inhibitors (TKIs) are used for the treatment of advanced renal cell carcinoma.
Results: T cell activation is less affected in the presence of axitinib compared with other TKIs.
Conclusion: Axitinib might be better suited to be combined with immunotherapy than sorafenib.
Significance: Learning how TKIs manipulate T cells is crucial for understanding TKI-mediated effects on the immune system.
Keywords: Apoptosis, Immunology, Immunosuppression, Immunotherapy, T Cell, Axitinib, Sorafenib, Sunitinib, Targeted Therapy, Tyrosine Kinase Inhibitor
Abstract
The multikinase inhibitors sunitinib, sorafenib, and axitinib have an impact not only on tumor growth and angiogenesis, but also on the activity and function of immune effector cells. In this study, a comparative analysis of the growth inhibitory properties and apoptosis induction potentials of tyrosine kinase inhibitors on T cells was performed. Tyrosine kinase inhibitor treatment resulted in a dramatic decrease in T cell proliferation along with distinct impacts on the cell cycle progression. This was at least partially associated with an enhanced induction of apoptosis although triggered by distinct apoptotic mechanisms. In contrast to sunitinib and sorafenib, axitinib did not affect the mitochondrial membrane potential (Δψm) but resulted in an induction or stabilization of the induced myeloid leukemia cell differentiation protein (Mcl-1), leading to an irreversible arrest in the G2/M cell cycle phase and delayed apoptosis. Furthermore, the sorafenib-mediated suppression of immune effector cells, in particular the reduction of the CD8+ T cell subset along with the down-regulation of key immune cell markers such as chemokine CC motif receptor 7 (CCR7), CD26, CD69, CD25, and CXCR3, was not observed in axitinib-treated immune effector cells. Therefore, axitinib rather than sorafenib seems to be suitable for implementation in complex treatment regimens of cancer patients including immunotherapy.
Introduction
Renal cell carcinoma (RCC)3 is the most common malignancy of the kidney and accounts for ∼3% of all adult malignancies and 2% of cancer deaths in the Western countries. At presentation, ∼30% of the RCC patients have already developed metastases, resulting in a poor prognosis of patients with a median 5-year survival rate <15% (1). RCC patients with localized disease often benefit from radical surgical resection of the tumor, but still 30–35% of these patients subsequently develop metastases over time (1). Up-regulation of the multidrug resistance 1 protein and/or the multidrug resistance-associated protein together with the P-glycoprotein as well as the down-regulation of DNA topoisomerase II can all be associated with a multidrug resistance phenotype frequently found in RCC tumors, thus limiting effective treatment options (2). However, despite the failure of conventional chemotherapy or radiotherapy and the identification of several immunologic dysfunctions, spontaneous regression rates along with the high infiltration rate of immune cells into RCC lesions (3, 4) have encouraged the development and clinical application of immunotherapy. Until 2005, cytokine-based immunotherapy using interferon-α (IFNα) and/or interleukin-2 (IL-2) has been the treatment of choice for advanced RCC with response rates of 10–20% (5). However, the recent progress made in understanding the pathogenesis of RCC along with the identification of molecular mechanisms that can be linked to the initiation and progression of disease allowed the design of “tumor-targeting” therapies (6).
Treatment of RCC with tyrosine kinase inhibitors (TKIs) provides significant objective clinical responses and leads to a longer progression-free survival of patients by the inhibition of cell growth and angiogenesis and by the induction of apoptosis (7). However, despite such significant improvements in the initial response rates to treatment with TKIs, RCC patients ultimately develop resistance to these drugs within 6–15 months that can be mediated by distinct mechanisms (8, 9). Furthermore, there is growing evidence that regulatory T cells (Tregs), which accumulate in human and murine tumors, may play an important role in the general process of angiogenesis (10, 11). The secretion of the vascular endothelial growth factor (VEGF) along with other tumor-derived products leads to an accumulation of Tregs (11, 12). Recently, it has been demonstrated that TKIs also affect both the frequency and composition of immune cell subpopulations including Tregs, myeloid-derived suppressor cells as well as T and NK cells (6, 13). Addressing immunosuppressive cells might improve the antitumor-directed T cell response, thereby providing a rational for the combination of TKIs with immunotherapy for the treatment of RCC. So far, only IFNα and IL-2 have been successfully combined with sorafenib (14–16). However, there exists only limited information on the effects of sorafenib and sunitinib on cellular parameters such as T cell proliferation and induction of/resistance to apoptosis, and even less is yet known for axitinib. Thus, the aim of this study was to compare and evaluate the complex cellular activities of these TKIs on immune effector cells, in particular on T cells either obtained from malignant hematopoietic cells or freshly isolated from peripheral blood lymphocytes from healthy donors.
EXPERIMENTAL PROCEDURES
Cell Culture
Peripheral blood mononuclear cells (PBMCs) from healthy donors were obtained from heparinized venous blood samples by density gradient centrifugation using Leukosep® (Greiner Bio-One, Frickenhausen, Germany) and LSM 1077 lymphocyte separation medium (PAA Laboratories GmbH, Coelbe, Germany). T cells were isolated from PBMCs after labeling with allophycocyanin-conjugated anti-CD3 antibodies using the EasySepTM Human APC Positive Selection kit according to the manufacturer's instructions (Stemcell Technologies, Grenoble, France). All experiments were performed with freshly isolated PBMCs, T cells, or Jurkat cells (ATCC TIB-152). Cells were cultured under conventional conditions (37 °C in a humidified atmosphere containing 5% CO2) in RPMI 1640 medium (Invitrogen) supplemented with 10% FCS (PAA Laboratories GmbH), 2 mm l-glutamine (Lonza, Cologne, Germany), 1% sodium pyruvate (Invitrogen), 1% non-essential amino acid mixture (Invitrogen), and 1% penicillin/streptomycin (PAA Laboratories GmbH). PBMCs or T cells isolated from PBMCs were cultured in the presence of 100 units/ml IL-2 (Proleukin, Chiron, Ratingen, Germany) and directly stimulated with anti-CD3 and anti-CD28 antibodies (mouse anti-human; 1 μg/ml each; BD Biosciences). Cells were additionally incubated with different concentrations of the respective TKI or DMSO for defined time intervals at 37 °C in a 5% CO2 humidified atmosphere.
XTT Assay
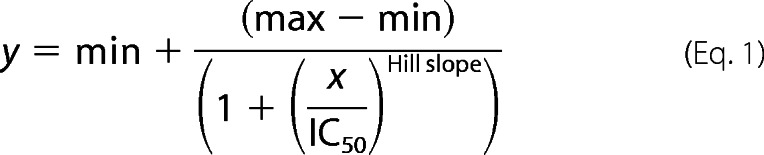
The effects of the TKIs on cell viability were measured via XTT assay according to the manufacturer's instructions (Cell Proliferation Kit II, Roche Applied Science) using 1 × 10⁴ Jurkat cells or 2 × 10⁵ PBMCs or isolated T cells in 150 μl of medium/well, respectively. Cell viability was analyzed after incubation of cells for 72 h using a microplate reader (MRX-TC, Dynex Technologies, Denkendorf, Germany). The absorbance values were expressed as a percentage of the DMSO-treated control group. IC50 values were calculated by fitting the data applying the following equation.
 |
Proliferation Assay
To evaluate cell proliferation, 2 × 10⁶ Jurkat cells or 2 × 10⁷ PBMCs in 10 ml of phosphate-buffered saline (PBS) were labeled with 5,6-carboxyfluorescein diacetate succinimidyl ester (0.5 μm; Invitrogen) according to the manufacturer's instructions. 2 × 10⁵ Jurkat cells/well or 2 × 10⁶ PBMCs/well were seeded in 6-well microtiter plates (Techno Plastic Products AG) and maintained for 5 days in culture. 10,000 events were analyzed on a BD FACSCanto II flow cytometer in combination with the FACSDiva software package (BD). The proliferation was expressed as % of the DMSO-treated control cells.
Monitoring TKI-dependent Alterations in the Composition and Function of Immune Cell Subpopulations
Seven-color flow cytometry staining was used for analyzing TKI-dependent effects on CD3/CD28-stimulated PBMC. Briefly, 2 × 10⁶ cells/well were seeded in 6-well microtiter plates (Techno Plastic Products AG) in 5 ml of medium followed by direct stimulation. After treatment with TKIs or DMSO at 37 °C for 68 h, BD GolgiPlugTM (5 μl) and IL-2 (100 units/ml) were added to each cell suspension and further incubated for 4 h. The cells were harvested and washed twice with PBS. Surface molecules were directly stained with the corresponding fluorescence-conjugated antibodies (Table 1) for 15 min at room temperature. Cells were washed with PBS and fixed in PBS containing 1% paraformaldehyde. For intracellular stainings, cells were incubated with 250 μl of Cytofix/Cytoperm (BD Biosciences) for 10 min at 4 °C, washed with PBS, incubated with the appropriate antibodies for 30 min at 4 °C, and washed again. The FOXP3 staining buffer set (clone PCH101; eBioscience, Frankfurt, Germany) was used for the detection of Tregs according to the manufacturer's instructions.
TABLE 1.
Markers used in flow cytometry
If not stated otherwise antibodies were purchased from BD Biosciences. Bold indicates intracellular staining. PE, phycoerythrin; APC, allophycocyanin; PerCP, peridinin-chlorophyll protein complex; ICOS, inducible T cell co-stimulator.
| Tube | Fluorescence-conjugated monoclonal antibodies |
||||||
|---|---|---|---|---|---|---|---|
| FITC | PE | PerCP | PE-Cy7 | APC | APC-H7 | V450 | |
| 1 | IgG1 | IgG1 | CD3 | CD8 | IgG1 | CD4 | CD45a |
| 2 | CD45RA | CCR7b | CD3 | CD8 | CD28 | CD4 | CD45a |
| 3 | PD1 | ICOS | CD3 | CD8 | CD4 | CD45a | |
| 4 | CD26 | CD69 | CD3 | CD8 | CD56 | CD4 | CD45a |
| 5 | CD57 | CD45RO | CD3 | CD8 | CD56 | CD4 | CD45a |
| 6 | CXCR3b | HLA-DR | CD3 | CD8 | CTLA4 | CD4 | CD45a |
| 7 | IgG1 | IgG2a ratc | CD3 | IgG1 | CD4 | CD45a | |
| 8 | CD25 | FOXP3c | CD3 | INFγa | CD4 | CD45a | |
| 9 | IgG1 | IgG2bc | IgG1 (PE-Cy5)d | CD8 | CD3 | CD4 | CD45a |
| 10 | CD3ζc | Perforinc | CD3ϵ (PE-Cy5)d | CD8 | CD3 | CD4 | CD45a |
| 11 | IgG1 | CD8 | CD3 | CD4 | CD45a | ||
| 12 | IL-4 | CD8 | CD3 | CD4 | CD45a | ||
a Miltenyi Biotec GmbH (Bergisch Gladbach, Germany).
b R&D Systems (Abingdon, UK).
c eBioscience (Frankfurt, Germany).
d Santa Cruz Biotechnology (Heidelberg, Germany).
Apoptosis Assay
Annexin V/7-Aminoactinomycin D Staining
To evaluate TKI-mediated apoptosis induction, 3 × 10⁵ Jurkat cells/well or 1 × 10⁶ isolated T cells were cultured in 6-well microtiter plates (TPP Techno Plastic Products AG) for 72 h. Apoptosis was determined by flow cytometry after staining of cells with allophycocyanin-annexin V (Pharmingen) and propidium iodide (2 mg/ml; Sigma-Aldrich) according to the manufacturer's instructions (Pharmingen). The stained cells were analyzed using a BD FACSCanto II flow cytometer and the FACSDiva software package (BD Biosciences).
Determination of Caspase Activity
Caspase-8 and -9 activities were measured using commercially available Caspase-GloTM-8 and -9 assays (Promega, Mannheim, Germany) according to the manufacturer's instructions. TKI- or DMSO-treated Jurkat cells (48 h; 1 × 10⁵ cells in 10 ml of RPMI 1640 medium) were harvested, and 75 μl of the resulting cell suspension containing 4 × 10⁵ cells/ml were plated in a white 96-well plate prior to analyzing the respective caspase activity. The cleavage of luminogenic caspase-8 and -9 substrates was measured using a MicroLumatPlus LB96V microplate luminometer (Berthold Technologies, Bad Wildbad, Germany).
For detection of active caspase-3, the cleavage of procaspase-3 was determined with the FITC Active Caspase-3 Apoptosis Kit (Pharmingen) using TKI- or DMSO-treated Jurkat cells (72 h; 3 × 10⁵ cells in 5 ml of medium) as wells as isolated T cells (72 h; 1 × 10⁶ cells in 5 ml of medium) according to the manufacturer's instructions. Samples were analyzed on a BD FACSCanto II flow cytometer using FACSDiva software (BD Biosciences), measuring logarithmic FITC fluorescence and counting a minimum of 10,000 events.
Determination of the Mitochondrial Depolarization
To evaluate TKI-mediated mitochondrial depolarization, 3 × 10⁵ Jurkat cells or 1 × 10⁶ T cells isolated from PBMCs were treated with either the respective TKI or DMSO for 72 h. Mitochondrial depolarization was determined by flow cytometry using the J-aggregate-forming lipophilic cationic fluorescence dye JC-1 (5,5′,6,6′-tetrachloro-1,1′,3,3′-tetraethylbenzimidazolylcarbocyanine iodide) according to the manufacturer's instructions (Molecular Probes, Eugene, OR). Stained cells were analyzed using a BD FACSCanto II flow cytometer and FACSDiva software (BD Biosciences). Cells treated with the mitochondrial poison carbonyl cyanide 3-chlorophenylhydrazone served as a positive control.
Cell Cycle Analysis
The cell cycle analysis was performed upon culturing of Jurkat cells (3 × 10⁵ cells in 10 ml of RPMI 1640 medium) in a time kinetic fashion followed by cell staining with propidium iodide (Sigma-Aldrich) and flow cytometry according to a method described elsewhere (17). Cells were treated with 300 μl of RNase A (1 mg/ml; Sigma-Aldrich) for 10 min at 20 °C prior to staining with propidium iodide (5 μl; 2 mg/ml). Cells were analyzed using a BD FACSCanto II flow cytometer and FACSDiva software (BD Biosciences). Cell cycle data were analyzed using the MODFIT software tool.
cDNA Synthesis and Quantitative RT-PCR
Total RNA was extracted from the samples using the Nucleospin Extract II Kit (Macherey-Nagel, Düren, Germany) according to the manufacturer's instructions. cDNA was synthesized from 3 μg of RNA treated with DNase I (Invitrogen) using oligo(dT) primers (Fermentas, Mannheim, Germany) and the RevertAidTM H Minus First Strand cDNA Synthesis Kit (Fermentas, St. Ingbert, Germany) before quantitative RT-PCR was performed with target-specific primers (Table 2) using Platinum® SYBR® Green qPCR SuperMix-UDG (Invitrogen) and applying the following parameters for 40 cycles: 95 °C, 15 s; 65 °C, 30 s. Relative mRNA expression levels for specific genes were normalized to peptidylprolyl isomerase A and hypoxanthine-guanine phosphoribosyltransferase. The transcription levels of DMSO-treated cells were set to 1, and the relative expression ratios in TKI-treated cells were calculated.
TABLE 2.
Primer sequences, annealing temperature, and product size of different genes used in quantitative RT-PCR
PPIA, peptidylprolyl isomerase A.
| Gene | RefGene | Primer sequence | Annealing temperature | Product size | |
|---|---|---|---|---|---|
| °C | bp | ||||
| Bcl-xL | NM_138578.1 | Sense | CCGGGATGGGGTAAACTGGGGT | 70 | 264 |
| Antisense | GTCATGCCCGTCAGGAACCAGC | ||||
| CCNB1 | NM_031966.3 | Sense | TACCTATGCTGGTGCCAGTGCC | 65 | 171 |
| Antisense | ACAGGTCTTCTTCTGCAGGGGC | ||||
| HPRT1 | NM_000194.2 | Sense | GCAGACTTTGCTTTCCTTGG | 60 | 101 |
| Antisense | CTGGCTTATATCCAACACTTCG | ||||
| Mcl-1 | NM_021960 | Sense | TCAGCGACGGCGTAACAAACTGG | 65 | 194 |
| Antisense | GAACTCCACAAACCCATCCCAGCC | ||||
| PPIA | NM_021130.3 | Sense | CCAAGACTGAGTGGTTGGATG | 60 | 192 |
| Antisense | CAGAAGGAATGATCTGGTGG |
Western Blot Analysis
Proteins were extracted from 3 × 10⁶ Jurkat cells or T cells isolated from PBMCs incubated in the absence (DMSO control) or presence of TKIs (0–10 μm) for 72 h, and the respective protein concentrations were determined with the Pierce BCA Protein Assay Kit (Fisher Scientific). Aliquots of 50 μg of protein/lane were separated by 12% SDS-PAGE and subsequently transferred onto nitrocellulose membranes (Schleicher & Schuell). Membranes were processed as described previously (18) using target protein-specific primary antibodies directed against Bcl-xL (Santa Cruz Biotechnology, Heidelberg, Germany), Mcl-1, or GAPDH (Cell Signaling Technology, Frankfurt, Germany) in combination with horseradish peroxidase (HRP)-conjugated secondary antibodies (Cell Signaling Technology). Protein bands were visualized with Lumi-Light Western blotting substrate (Roche Applied Science) and recorded with a LAS 3000 CCD camera system (Fujifilm, Dusseldorf, Germany). The co-detection of the GAPDH signal for each lane on the given blot served as a loading control, and the relative protein expression level for each target was defined using the AIDA software (Raytest, Sprockhoevel, Germany).
Statistical Analysis
The results were expressed as mean ± S.D. of at least three independent experiments. The data were analyzed using SigmaPlot software (Systat Software, Erkrath, Germany). Differences between groups were examined for statistical significance using the Student's t test. A value of p < 0.05 was considered as statistically significant.
RESULTS
TKIs Inhibit T Cell Proliferation and T Cell Viability in a Dose-dependent Manner
To determine whether TKIs have direct effects on CD3/CD28-stimulated immune effector cells, PBMCs from healthy donors and the immortalized T lymphocyte cell line Jurkat were treated with either 0–20 or 0–50 μm concentrations of the distinct TKIs sunitinib, sorafenib, and axitinib, respectively, and subsequently analyzed under short term (72 h; XTT assay) or long term (6 days; 5,6-carboxyfluorescein diacetate succinimidyl ester staining) culture conditions. As shown in Fig. 1, a dose-dependent inhibition of both cell proliferation (Fig. 1, A and C) and cell viability (Fig. 1, B and D) was detected in the presence of each of the three tested TKIs. However, in contrast to the response to treatment with sunitinib or sorafenib, only minor toxicity effects were detectable for axitinib, in particular in the PBMCs (Fig. 1B). In addition, a biphasic growth inhibition curve was observed in response to treatment with axitinib in Jurkat cells (Fig. 1D). The antiproliferative and cytotoxic effects were monitored at different TKI concentrations to define the respective 50% proliferation/growth inhibition concentration (IC50) values (Table 3) via XTT assays. Subsequently the calculated IC50 value for each TKI was used to define their biological/immunological effects.
FIGURE 1.

TKI-mediated inhibition of proliferation and viability of immune cells. PBMCs from healthy donors were prepared by Ficoll density gradient centrifugation and stimulated directly with anti-CD3 and anti-CD28 antibodies (mouse anti-human; 1 μg/ml each; BD Biosciences). Jurkat cells were used without stimulation. Cells were grown for 6 days or 72 h in the absence or presence of various concentrations of TKI (PBMCs, 0–20 μm; Jurkat, 0–50 μm) and analyzed via flow cytometry using covalent 5,6-carboxyfluorescein diacetate succinimidyl ester staining (Invitrogen) (A, PBMCs; C, Jurkat cells) or via XTT assay using the XTT Cell Proliferation Kit (Roche Applied Science) (B, PBMCs; D, Jurkat cells) according to the manufacturer's protocol. Proliferation (A and C) and viability (B and D) are expressed as mean percentage (%) ±S.D. (error bars) based on five independent experiments. The right panel in each segment of Fig. 1 highlights the effects of physiologic TKI concentrations on viability/proliferation, respectively.
TABLE 3.
Summary of antiproliferative and cytotoxic effects of the different TKIs on Jurkat cells and PBMCs
CFSE, 5,6-carboxyfluorescein diacetate succinimidyl ester.
| Treatment | IC50a ±S.D. |
|
|---|---|---|
| CFSE | XTT | |
| μm | ||
| Jurkat | ||
| Sunitinib | 6.4 ± 0.9 | 3.7 ± 0.5 |
| Sorafenib | 7.8 ± 0.3 | 5.2 ± 1.0 |
| Axitinib | 0.6 ± 0.1 | 0.18 ± 0.01 (phase 1) |
| 21.4 ± 0.4 (phase 2) | ||
| PBMCs | ||
| Sunitinib | 2.9 ± 0.2 | 5.4 ± 0.5 |
| Sorafenib | 4.7 ± 0.3 | 8.5 ± 0.4 |
| Axitinib | 0.7 ± 0.1 | 1.7 ± 0.4 (phase 1) |
a IC50 is defined as the concentration that results in a 50% decrease in the number of cells compared with that of the control in the absence of TKI. The data shown represent mean ± S.D. of three independent experiments.
Sunitinib and Sorafenib, but Not Axitinib, Altered the Relative Composition of PBMC and Their Cell Surface Protein Expression Pattern
To monitor the influence of TKI treatment on the relative composition of immune cells within the PBMC fraction as well as on their cell surface markers, PBMCs from healthy donors were prepared using density gradient centrifugation, thereafter stimulated with IL-2 and anti-CD3/anti-CD28 antibodies, and incubated for 72 h in the presence of either TKI (5 μm) or DMSO. Subsequently, immunostainings were performed using a large panel of monoclonal antibodies (Table 1). Although the number of CD3+ T cells was comparable between TKI-treated and DMSO-treated PBMCs, sorafenib-treated cells exhibited a slightly higher percentage of CD4+ and a lower percentage of CD8+ T cells (Fig. 2A). However, no significant changes were detectable in response to sunitinib or axitinib treatment (data not shown). To determine the effects of the different TKIs on the Treg subset, the frequencies of Tregs within stimulated PBMCs in the absence (DMSO control) or presence of TKI were analyzed by flow cytometry. As shown in Fig. 2B, treatment with either 5 μm sunitinib or sorafenib led to a reduction of the Treg subpopulation (CD4+/CD25+/FOXP3+) (p < 0.05) from 13.3 to 2.3 and 8.2%, respectively (Fig. 2B). In contrast, axitinib or physiologic concentrations of sunitinib (0.1 μm) did not affect the relative Treg ratio. Most of the function-associated surface molecules investigated (Table 1) were not significantly altered in response to TKI treatment. However, the numbers of CCR7+/CD4+, CCR7+/CD8+, CD26+/CD4+, CD26+/CD8+, CXCR3+/CD4+, and CXCR3+/CD8+ T cells as well as of CD56+/CD26+ and CD56+/CD69+ NK cells were lower in the sorafenib-treated group, if compared with the DMSO-treated control group (p < 0.05; Fig. 2A), although the relative numbers of NK cells in both groups were unaffected (data not shown). Again, no significant changes were observed for axitinib-treated cells or cells treated with physiologic concentrations of sunitinib (0.1 μm) (data not shown). To assess the functionality of CD4+ T effector cells, the IFNγ expression levels were determined after stimulation of PBMCs with anti-CD3 and anti-CD28 antibodies in the presence of IL-2 and TKI (5 μm; 72 h). The relative production of IFNγ was significantly decreased from 1 to 0.2 and 0.5 (p < 0.05) in response to treatment with sunitinib or sorafenib, respectively, whereas no effects on the relative IFNγ expression levels were observed in axitinib-treated cells (Fig. 2C) or cells treated with physiologic concentrations of sunitinib (0.1 μm) (data not shown).
FIGURE 2.

Sorafenib, but not axitinib, reduced the frequency of specific immune cell subpopulations and the expression levels of specific immune cell markers. PBMCs from healthy donors were prepared by Ficoll density gradient centrifugation and stimulated directly with anti-CD3 and anti-CD28 antibodies (mouse anti-human; 1 μg/ml each; BD Biosciences) and IL-2 (100 units/ml). Cells were grown for 72 h in the absence or presence of 5 μm TKI and analyzed via flow cytometry for lymphocyte markers using seven-color staining (A). Cells were fixed and analyzed by flow cytometry for Tregs (B) and after intracellular staining for IFNγ expression (C). Data are represented as mean percentage (%) ±S.D. (error bars) based on five independent experiments. A, TKI-induced reduction in the percentage of CD8+ T cells as wells as CCR7+, CD26+, and CXCR3+ cells within the total CD4+ and CD8+ T cell population and CD26+ or CD69+ cells within the total NK cell population. B, TKI-induced reduction in the percentage of peripheral blood CD4+ CD25+ FOXP3+ T cells within the total CD4+ T cell population. C, TKI-induced reduction in the percentage of IFNγ-producing cells within the total CD4+ T cell population. *, p < 0.05 (t test).
To further monitor the effects of the various TKIs on the T cell activation process, PBMCs were activated by the addition of phytohemagglutinin M and IL-2 and analyzed for the up-regulation of the activation markers CD25 and CD69 using flow cytometry. The cells were cultured for 72 h in the absence (DMSO control) or presence of the individual TKI. Up-regulation of CD25 expression on CD3+ T cells was impaired in the presence of all TKIs tested, as highlighted by a significant reduction of the relative CD25 expression levels from 100 to 66 and 1% in the presence of 0.1 and 5 μm sunitinib, from 100 to 15% in the presence of 5 μm sorafenib, and from 100 to 90% (p < 0.05) in the presence of 0.2 μm and 5 μm axitinib, respectively (Fig. 3). In line with this finding, the relative CD69 expression levels were also significantly reduced from 100 to 18% (p < 0.05) in the presence of 5 μm sunitinib and sorafenib. However, the up-regulation of CD69 in the presence of physiologic concentrations of sunitinib (0.1 μm) and axitinib was not observed (Fig. 3).
FIGURE 3.
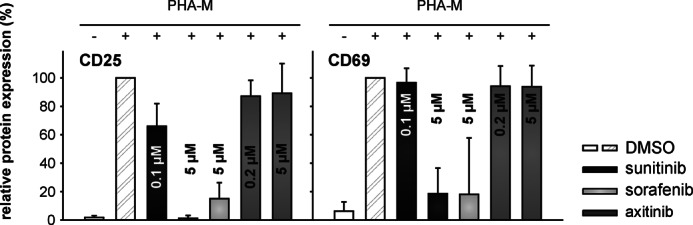
Decreased expression of T cell activation markers (CD25 and CD69) in TKI-treated T cells. PBMCs from healthy donors were prepared by Ficoll density gradient centrifugation and stimulated directly with phytohemagglutinin M (PHA-M) (4 μg/ml) and IL-2 (100 units/ml). Cells were grown for 72 h in the absence or presence of 0–5 μm TKI and analyzed via flow cytometry for the activation markers CD25 and CD69 within the total CD3+ T cell population of PBMCs. Data are represented as mean percentage (%) ±S.D. (error bars) based on five independent experiments.
TKIs Induce Caspase-dependent Apoptosis in Jurkat Cells
To determine whether the reduced cell viability observed in response to TKI treatment was caused by the induction of apoptosis, the translocation of phosphatidylserine was quantified via annexin V and propidium iodide double stainings in Jurkat cells 72 h after the outset of TKI treatments (0–30 μm) (Fig. 4A). The proportion of annexin V+/propidium iodide− Jurkat cells representing early apoptotic cells was significantly increased (p < 0.05) in the presence of 5 μm sunitinib and 10 μm sorafenib compared with the corresponding DMSO control (Fig. 4A). The relative amount of early apoptotic cells increased from 4.3 to 17.3 and 9.6%, respectively (p < 0.05). Surprisingly, axitinib did not induce early apoptotic cells within 72 h. Moreover, the activation of caspase-3, -8, and -9 in the presence of TKI (0–20 μm; 48 h) or DMSO was analyzed for Jurkat cells. As shown in Fig. 4, B and C, caspase-8 and -9 were activated to a similar extent in the presence of these TKIs. In analogy to the annexin V staining, both caspase-8 (Fig. 4B) and -9 (Fig. 4C) activities significantly increased (p < 0.05) at concentrations ≥10 μm for sunitinib and sorafenib, whereas for axitinib, significantly higher caspase activities were observed at lower axitinib concentrations (≤5 μm). In Jurkat cells, the activation of caspase-3 was evaluated by flow cytometry using a FITC-conjugated polyclonal rabbit anti-active caspase-3 antibody. In accordance with the capase-8 and -9 activity assays, the detection of cleaved caspase-3 (Fig. 4D) significantly increased (p < 0.05) for sunitinib and sorafenib at concentrations of ≥7.5 μm, and again higher activity levels at lower concentrations (≥2.5 μm) were measured in axitinib-treated cells. Experiments using T cells isolated from PBMCs confirmed these results. Whereas sunitinib and axitinib failed to induce early apoptotic cells at physiologic concentrations (0.1 and 0.2 μm, respectively), sorafenib induced apoptosis at physiologic concentration (15 μm). Even at a higher concentration (5 μm), axitinib did not induce apoptosis within 72 h of treatment, whereas sunitinib did (Fig. 4E). Similar results were obtained for the activation of caspase-3, and treatment with 5 μm axitinib led only to a slightly increased amount of activated caspase-3 (Fig. 4F).
FIGURE 4.

TKI-mediated apoptosis induction in Jurkat cells and T cells isolated from PBMC. A, quantitative analysis of Jurkat cell apoptosis by annexin V- and propidium iodide-double stained flow cytometry after 72 h of incubation in the presence of various concentrations of TKI (0–20 μm) or DMSO. B, C, and D, TKIs induce caspase-8-, -9-, and -3-dependent apoptosis in Jurkat cells. Caspase-8 (B) and -9 (C) activities were measured using the Caspase-Glo-8 and -9 assays (Promega) as described under “Experimental Procedures” after 72 h of incubation in the presence of various concentrations of TKI (0–20 μm) or DMSO. Data are represented as mean (luminescenceTKI/luminescenceDMSO) ±S.D. (error bars) based on three independent experiments performed in triplicate. Caspase-3 activation (D) was assessed after 72 h in the absence and presence of TKI (0–10 μm) via flow cytometry. E and F, quantitative analysis of apoptosis of T cells isolated from PBMCs. The assays were performed as described above after 72 h of phytohemagglutinin M (PHA-M) stimulation and incubation in the presence of various concentrations of TKI (0–20 μm) or DMSO. All data are represented as mean percentage (%) ±S.D. (error bars) based on three independent experiments performed in triplicate. 7AAD, 7-aminoactinomycin D.
Sunitinib and Sorafenib, but Not Axitinib, Induce Distortions of the Mitochondrial Membrane Potential via Down-regulation of Mcl-1 Expression
TKI-induced apoptosis could be triggered by either the mitochondrial or the death receptor-mediated pathways (19), thereby leading to the activation of effector caspases. Thus, alterations of the mitochondrial membrane potential (Δψm) in response to the treatment with various TKIs were determined. Jurkat cells or T cells isolated from PBMCs were treated for 48 or 72 h, respectively, with TKI (0–10 μm) or DMSO prior to JC-1 staining and analysis by flow cytometry. When compared with DMSO-treated cells, sunitinib- or sorafenib-treated cells exhibited significantly reduced mean FL-2 emission intensities (JC-1 red fluorescence). As representatively shown in Fig. 5, A and B, DMSO-treated Jurkat cells/T cells isolated from PBMCs (control) demonstrated a strong J-aggregation (JC-1 red fluorescence) and a weak/weaker JC-1 monomer staining pattern (green staining; 1.2% for Jurkat and 23.8% for T cells isolated from PBMCs). In contrast, sunitinib or sorafenib treatment resulted in a significant reduction of the mean JC-1 red fluorescence intensity along with a strong increase in the JC-1 monomer staining signal (Jurkat/T cells isolated from PBMCs: 17.1/72.4 and 76.3/58.4% for 10 μm sunitinib and sorafenib, respectively). Concomitantly, decreased J-aggregation-specific staining signals due to the loss of Δψm were detected (Fig. 5, A and B). Treatment of cells with the mitochondrial poison carbonyl cyanide 3-chlorophenylhydrazone resulted in a breakdown of Δψm comparable with that observed in sorafenib-treated cells (data not shown). In contrast, axitinib treatment had no effect/only minor effects on the Δψm of Jurkat cells/T cells isolated from PBMCs even at concentrations of 10 μm (Fig. 5, D and E). The stabilization of the Δψm in axitinib-treated cells was accompanied by an increased expression of Mcl-1. In contrast, treatment with sunitinib or sorafenib, respectively, resulted in a down-regulation of Mcl-1 in Jurkat cells (Fig. 6A). However, Bcl-xL was not altered in Jurkat cells upon TKI treatment. Western blot experiments using T cells isolated from PBMCs confirmed these results. Treatment with sunitinib did not affect the expression levels of Mcl-1 or Bcl-xL, whereas sorafenib treatment (15 μm) resulted in a significant decrease of the expression levels of both proteins. In contrast, axitinib treatment increased the expression levels of Mcl-1 and Bcl-xL in T cells (Fig. 6B).
FIGURE 5.

Sunitinib and sorafenib, but not axitinib, induced loss of mitochondrial potential. A and B, alterations of the Δψm were determined via flow cytometry after treatment of Jurkat cells (A) or T cells isolated from PBMCs (B) with TKI (0–10 μm) for 72 h as described under “Experimental Procedures.” The number provided within the given profile highlights the percentage of cells that emit only green fluorescence, thereby indicating a depolarized mitochondrial membrane. A representative set of three individual experiments with similar results is shown. C and D, TKI-dependent increase in the green/red fluorescence intensity ratio of Jurkat cells (C) or isolated T cells (D). Sunitinib and sorafenib treatment increased the green/red ratio compared with DMSO controls as well as axitinib treatment, indicating mitochondrial membrane depolarization and therefore the loss of the Δψm. Data are expressed as mean of 520/590-nm emission spectrum ±S.D. (error bars) based on three independent experiments.
FIGURE 6.

Axitinib, but not sunitinib or sorafenib, resulted in an up-regulation of Mcl-1. Jurkat cells (A) or T cells isolated from PBMCs (B) were exposed to DMSO, sunitinib, sorafenib, or axitinib (0–10 μm) for 72 h, cells were pelleted and lysed, and 50 μg of protein were separated by SDS-PAGE. Blots were probed with anti-Bcl-xL or anti-Mcl-1 antibodies, and equivalent loading and transfer were ensured using an anti-GAPDH mAb. The graphs show the band intensities ±S.D. (error bars) of Bcl-xL and Mcl-1 corrected for the intensity of the GAPDH standard based on three independent experiments.
Axitinib, but Not Sunitinib or Sorafenib, Induces G2/M Arrest
As illustrated by the representative flow cytometry profiles (Fig. 7A), significant alterations of the cell cycle were detected in response to exposure to axitinib for ∼24 h. Cells appear to accumulate in the G2/M phase of the cell cycle. With continued exposure to axitinib, the observed cell cycle arrest in the G2/M phase was maintained for up to 72 h. Time kinetic analysis revealed that the axitinib-induced G2/M cell cycle arrest (500 nm) was already detectable after 8 h, reaching a plateau at 36 h (37% compared with 6% in DMSO-treated control cells; Fig. 7, B and C). Furthermore, the axitinib-mediated mitotic arrest was associated with an up-regulation of the expression level of cyclin B1 (CCNB1) (Fig. 7D).
FIGURE 7.

Axitinib, but not sunitinib or sorafenib, induced G2/M arrest. Cells were treated with 0.5 μm axitinib for 0–48 h and analyzed as outlined under “Experimental Procedures.” Representative flow cytometry profiles (A) illustrate the absence of G2/M arrest in cells treated with DMSO for 48 h and the progressive accumulation of cells in G2/M at 12, 24, 36, and 48 h after axitinib treatment. Data are additionally expressed as cells in the G0/G1, G2/M, or S phases of the cell cycle in DMSO- (B) or axitinib-treated (C) Jurkat cells. Cells were subjected to quantitative real time RT-PCR analysis to determine mRNA levels of CCNB1 (D) using oligo-(dT)18-primed cDNA. Mean expressions of hypoxanthine-guanine phosphoribosyltransferase and peptidylprolyl isomerase A were used for normalization. Data are represented as mean percentage (%) ±S.D. (error bars) based on three independent experiments. PE, phycoerythrin.
DISCUSSION
Although for some targeted drugs such as sunitinib and sorafenib immunosuppressive activities have been reported previously (6, 13, 20–22), there exists only scarce information about the effects of the recently United States Food and Drug Administration-approved TKI axitinib on immune cells (23). Thus, the current study explored the underlying molecular mechanisms for the frequently observed growth arrest in human immune effector cells induced by these TKIs. Their effects on cell proliferation and cytotoxicity were analyzed both in freshly isolated PBMCs, T cells isolated from PBMCs, and Jurkat cells, the latter serving as a model cell line for functional assays. All three tested TKIs were able to mediate a complete and dose-dependent suppression of T cell proliferation (Fig. 1, A and C). However, only treatment with sunitinib or sorafenib resulted in a complete loss of cell viability (Fig. 1, B and D), whereas exposure to axitinib had no effects on the viability of CD3/CD28-stimulated PBMCs (Fig. 1B). Furthermore, in Jurkat cells, treatment with axitinib revealed a biphasic viability curve (Fig. 1D), suggesting that the first phase (≤10 μm) might exert antiproliferative but not yet toxic effects of axitinib, leading to an induction of a cell cycle arrest as shown previously for the epidermal growth factor receptor inhibitor gefitinib (24).
The recommended oral dosage of sunitinib, sorafenib, and axitinib for treatment of advanced RCC is 50 mg once daily (4 weeks on, 2 weeks off), 400 mg twice daily, and 5 mg twice daily, respectively. The steady-state drug concentrations in the serum of patients were estimated to range from 0.06 to 0.1 μm for sunitinib (25), from 15 to 20 μm for sorafenib (26, 27), and from about 0.1 to 0.2 μm for axitinib (28, 29). However, the IC50 values for the inhibition of proliferation in the presence of sunitinib or axitinib (Table 3) defined in the current study are 30–60- and 3000-fold higher, respectively, than the expected plasma levels for patients undergoing TKI-based therapy regimens. Thus, merely the IC50 value defined for sorafenib (Table 3) seems to be within the range of the sorafenib concentrations expected in the serum of patients receiving the standard therapeutic dose, thereby implying a clinical risk under long term treatment.
In line with this, sorafenib treatment caused a reduction of the frequency of specific immune cell subpopulations like CD8+ T cells and Tregs as well as a down-regulation of the expression levels of specific immune cell activation markers (Fig. 2, A and B). In contrast to the findings of Hipp et al. (30), a decreased frequency of CD8+ T cells was found in the presence of 5 μm sorafenib. Furthermore, sorafenib, but not axitinib, down-regulated the surface expression of the CCR7, which guides T cells from peripheral tissues to afferent lymphatic vessels across a CCL21 gradient (31). This is also in line with a report demonstrating a sorafenib-mediated reduction of CCR7 surface expression in mature dendritic cells that is responsible for guiding dendritic cells from peripheral tissues to local lymph nodes (30). In addition, sorafenib, but not axitinib, reduced the surface expression of the chemokine receptor CXCR3, which is expressed on different cell types including B, NK, and T cells (32). CXCR3 is marginally expressed on resting T cells, but its expression markedly increases upon activation, indicating its importance for T cell function (33). The sorafenib-mediated reduction of the expression of dipeptidyl peptidase IV (CD26) should also negatively interfere with T cell activation by suppressing its co-stimulatory activities in the T cell receptor-mediated activation of T cells (34). Furthermore, CD26 was not only down-regulated on T cells but also on CD16+ CD56+ NK cells where it functions as an activation antigen inducible by IL-2, IL-12, or IL-15 (35). Sunitinib reduced the number of immunosuppressive Tregs more strongly than sorafenib at a concentration of 5 μm (Fig. 2B), thereby shifting the immune balance toward a more stimulating setting (36). Given that high frequencies of Tregs in the peripheral blood and in tumor-infiltrating lymphocytes correlate with poor prognosis (37) and that sorafenib treatment results in an induction of Tregs in the peripheral blood of RCC patients (21), tumor patients might benefit from a sunitinib-mediated Treg reduction. However, because axitinib did not significantly reduce the number of Tregs (Fig. 2B), the immunostimulating effects of axitinib might be caused by other mechanisms. This is supported by the finding that axitinib treatment did not affect the up-regulation of CD25 and CD69, whereas in response to treatment with sunitinib and sorafenib, a down-regulation for both of these activation markers could be defined (Fig. 3) that is likely mediated by blocking ZAP70 signaling (20, 22). In line with this, sorafenib and sunitinib, but not axitinib, suppressed the IFNγ production as demonstrated in this report (Fig. 2C) and as described previously for the secretion of IL-2 (20, 22).
These data suggest that sorafenib exerts major immunosuppressive effects, which might be relevant for patients to which sorafenib is administered in combination with immunotherapy. In contrast, the immunologic effects of sunitinib are currently controversially discussed. Sunitinib can be used to reverse immune suppression caused by Tregs or myeloid-derived suppressor cells (38–41) and to improve type 1 T cell cytokine responses (38, 41). In addition, the expression levels of the negative co-stimulatory molecules CTLA4 and PD-1 in CD4+ and CD8+ T cells were also significantly decreased in sunitinib-treated mice (38), whereas a decrease of the T cell-mediated immune response was observed upon sunitinib treatment in another murine model (20).
The relationship between the TKI-induced inhibition of T cell proliferation/viability and the initiation of apoptosis as demonstrated in Fig. 4A revealed that TKI concentrations of at least 5 μm for sunitinib or 10 μm for sorafenib are necessary to efficiently induce apoptosis. At lower concentrations, no induction of apoptosis and recovery from the state of a temporary blocked cell cycle were found for sunitinib (20) and sorafenib (22). Axitinib failed to induce apoptosis within 72 h of treatment. To determine the underlying mechanisms of the observed TKI-induced T cell cytotoxicity, the activation of caspases and changes in Δψm were studied.
Proapoptotic stimuli can trigger caspase activation by two distinct mechanisms. The extrinsic pathway promotes the assembly of the death-inducing signaling complex including procaspase-8, whereas the intrinsic pathway is characterized by cytochrome c release into the cytosol and the assembly of procaspase-9, Apaf-1, dATP, and cytochrome c to the apoptosome (19). Caspase-3 potentiates caspase-8 and -9 (19), which were significantly increased in the presence of 10 μm sunitinib and sorafenib (Fig. 4, B and C), respectively. In accordance with the annexin V and the cleaved caspase-3 stainings (Fig. 4, D and F), axitinib already induced caspase-8 and -9 activation at lower concentrations (<5 μm). Both sunitinib as well as sorafenib significantly induced the active form of caspase-3 at concentrations of 10 μm, whereas axitinib induced caspase-3 activation at concentrations <5 μm. Caspase-8 might also be processed independently of death receptors during TKI-induced apoptosis via interchain proteolysis after postmitochondrial caspase-3 activation (42), indicating an amplifying function of caspase-8 within the intrinsic pathway. To further prove mitochondrial involvement in apoptosis, the modulation of the Δψm under TKI treatment was analyzed. The data presented in Fig. 5 indicate that sunitinib and sorafenib decreased the level of the Δψm dose-dependently, thereby strongly suggesting that mitochondrial damage is involved in TKI-induced apoptosis. Loss of the Δψm and mitochondrial outer membrane permeabilization are two independent and consecutive events (43), but only the loss of the Δψm depends on caspase-9 activation in vivo (43). Despite the clearly detected activation of caspase-9 in the presence of axitinib, the Δψm remained intact at least for 48 h even in the presence of up to 10 μm axitinib (Fig. 5). The activation of the mitochondrial death pathways involves the deregulation of members of the Bcl-2 family (19). To investigate the involvement of antiapoptotic proteins in TKI-induced apoptosis, the expression pattern of the antiapoptotic Bcl-2 family proteins Bcl-xL and Mcl-1, which are both involved in inhibiting mitochondrial permeabilization (44, 45), were analyzed (Fig. 6). It has been demonstrated previously that the sorafenib-induced down-regulation of Mcl-1 is mediated by inhibition of its translation (46) via induction of endoplasmic reticulum stress (47), although both the Mcl-1 mRNA expression levels and the protein stability remain unaffected (46, 48). Moreover, sunitinib- and sorafenib-induced down-regulation of Mcl-1 protein did not affect the expression levels of other Bcl-2 family members (46–48). Quite in contrast, an up-regulation of Mcl-1 in the presence of 10 μm axitinib was detected (Fig. 6), suggesting that Jurkat cells (Fig. 6A) as well as T cells isolated from PBMCs (Fig. 6B) might block the induction of apoptosis during axitinib treatment via stabilization/enhancement of Mcl-1 expression. As the Mcl-1 protein levels are regulated during the cell cycle and peak during mitosis (49), the more pronounced expression of Mcl-1 in axitinib-treated cells could be additionally explained by a cell cycle arrest in the G2/M phase. Indeed, Jurkat cells treated with 0.5 μm axitinib accumulated persistently and in a time-dependent manner in the G2/M cell cycle phase (Fig. 7C). The mRNA expression level of the G2/M marker CCNB1 (Fig. 7D) also peaks in the G2/M cell cycle phase (50). This indicates that TKI treatment might have distinct effects on the progression of the cell cycle, thereby depending on its nature. Although axitinib suppressed the growth of Jurkat cells by an irreversible block of the cell cycle in the G2/M phase, a G0/G1 arrest was reported for sunitinib and sorafenib (20, 22). As described previously, stabilization of Mcl-1 during mitotic arrest (49) together with the inactivation of caspase-9 via phosphorylation at Thr-125 (51) restrained apoptosis during mitotic arrest. This mechanism of caspase-9 inactivation might explain the underlying mechanism of the survival strategy in the presence of axitinib in the first 48 h of treatment and is in accordance with the reduced caspase-9 activity (Fig. 4C) as well as the reduced amplifying executioner function of caspase-8 observed with increasing axitinib concentrations (Fig. 4D). Phosphorylation of Mcl-1 at Thr-92 by cyclin-dependent kinase 1-cyclin B1 initiates degradation of Mcl-1 in cells arrested in mitosis by microtubule poisons (49). Thus, anaphase-promoting complex/cyclosome (Cdc20)-mediated destruction of Mcl-1 initiates apoptosis if the axitinib-treated cells fail to undergo mitosis (49).
In conclusion, our results showed for the first time a number of unique features of the TKI axitinib when compared with its competitors sunitinib and sorafenib. Axitinib did not significantly affect T cell viability or the induction of T cell apoptosis but strongly suppressed T cell proliferation, which might affect the expansion of tumor-specific T cells. Despite this finding, one could assume that axitinib exerts less immunosuppressive properties if compared with sunitinib and sorafenib. This is supported by a report describing a reduction of suppressor cell populations (myeloid-derived suppressor cells and Tregs) in a melanoma mouse model treated with a combination therapy using axitinib plus specific peptide-based vaccination (23). Thus, axitinib might be better suited to be combined with other therapy strategies, in particular with immunotherapy.
Taken together, the limited T cell activation under treatment with sunitinib and sorafenib along with their impact on the IFNγ secretion capacity might further limit the mounting of an effective antitumor-directed immune response. At physiologic concentrations, sunitinib revealed minor effects in regard to the expression of the T cell activation marker CD25, suggesting that it might indeed limit the activation of T cells and therefore negatively interfere with the establishment of an effective antitumor-directed immune response. In contrast, it was reported that so called “adjuvant-like qualities” of sunitinib facilitate the activation and recruitment of therapeutic antitumor immunity in concert with specific vaccination in murine melanoma and colon carcinoma models (38, 52, 53) and that sunitinib additionally benefits adoptive T cell immunotherapy (54). Taking further into account that long term treatment regimens relying on a single targeted drug might be infeasible due to the occurrence of drug-specific resistance mechanisms (8, 9), rather sequential treatment strategies and combinations with other therapy options might be required.
The data presented above elucidate TKI-mediated effects on T cells, thereby providing further insights into their side effects both at the molecular and functional level, in particular with regard to the establishment and maintenance of a T cell-mediated antitumor-directed immune response. Based on the results provided, axitinib might be the leading candidate to further explore combinatorial treatment regimens at least in combination with immunotherapy.
Acknowledgments
We thank the companies Pfizer GmbH and Bayer GmbH for kindly providing the TKIs.
This work was supported by the Mildred Scheel, Else Kroener Fresenius, and Sander Foundations.
- RCC
- renal cell carcinoma
- Mcl-1
- induced myeloid leukemia cell differentiation protein
- TKI
- tyrosine kinase inhibitor
- Δψm
- mitochondrial membrane potential
- Treg
- regulatory T cell
- NK
- natural killer
- PBMC
- peripheral blood mononuclear cell
- XTT
- 2,3-bis(2-methoxy-4-nitro-5-sulfophenyl)-2H-tetrazolium-5-carboxanilide
- JC-1
- 5,5′,6,6′-tetrachloro-1,1′,3,3′-tetraethylbenzimidazolylcarbocyanine iodide
- CCNB1
- cyclin B1
- CCR7
- chemokine CC motif receptor 7.
REFERENCES
- 1. Flanigan R. C., Campbell S. C., Clark J. I., Picken M. M. (2003) Metastatic renal cell carcinoma. Curr. Treat. Options Oncol. 4, 385–390 [DOI] [PubMed] [Google Scholar]
- 2. Naito S., Koga H., Yokomizo A., Sakamoto N., Kotoh S., Nakashima M., Kiue A., Kuwano M. (2000) Molecular analysis of mechanisms regulating drug sensitivity and the development of new chemotherapy strategies for genitourinary carcinomas. World J. Surg. 24, 1183–1186 [DOI] [PubMed] [Google Scholar]
- 3. Thompson R. H., Dong H., Lohse C. M., Leibovich B. C., Blute M. L., Cheville J. C., Kwon E. D. (2007) PD-1 is expressed by tumor-infiltrating immune cells and is associated with poor outcome for patients with renal cell carcinoma. Clin. Cancer Res. 13, 1757–1761 [DOI] [PubMed] [Google Scholar]
- 4. Porta C., Bonomi L., Lillaz B., Paglino C., Rovati B., Imarisio I., Morbini P., Villa C., Danova M., Mensi M., Rovereto B. (2007) Renal cell carcinoma-induced immunosuppression: an immunophenotypic study of lymphocyte subpopulations and circulating dendritic cells. Anticancer Res. 27, 165–173 [PubMed] [Google Scholar]
- 5. Gouttefangeas C., Stenzl A., Stevanović S., Rammensee H. G. (2007) Immunotherapy of renal cell carcinoma. Cancer Immunol. Immunother. 56, 117–128 [DOI] [PMC free article] [PubMed] [Google Scholar]
- 6. Seliger B., Massa C., Rini B., Ko J., Finke J. (2010) Antitumour and immune-adjuvant activities of protein-tyrosine kinase inhibitors. Trends Mol. Med. 16, 184–192 [DOI] [PubMed] [Google Scholar]
- 7. Hutson T. E. (2011) Targeted therapies for the treatment of metastatic renal cell carcinoma: clinical evidence. Oncologist 16, Suppl. 2, 14–22 [DOI] [PMC free article] [PubMed] [Google Scholar]
- 8. Finke J., Ko J., Rini B., Rayman P., Ireland J., Cohen P. (2011) MDSC as a mechanism of tumor escape from sunitinib mediated anti-angiogenic therapy. Int. Immunopharmacol. 11, 856–861 [DOI] [PMC free article] [PubMed] [Google Scholar]
- 9. Rini B. I., Atkins M. B. (2009) Resistance to targeted therapy in renal-cell carcinoma. Lancet Oncol. 10, 992–1000 [DOI] [PubMed] [Google Scholar]
- 10. Li B., Lalani A. S., Harding T. C., Luan B., Koprivnikar K., Huan Tu G., Prell R., VanRoey M. J., Simmons A. D., Jooss K. (2006) Vascular endothelial growth factor blockade reduces intratumoral regulatory T cells and enhances the efficacy of a GM-CSF-secreting cancer immunotherapy. Clin. Cancer Res. 12, 6808–6816 [DOI] [PubMed] [Google Scholar]
- 11. Facciabene A., Peng X., Hagemann I. S., Balint K., Barchetti A., Wang L. P., Gimotty P. A., Gilks C. B., Lal P., Zhang L., Coukos G. (2011) Tumour hypoxia promotes tolerance and angiogenesis via CCL28 and T(reg) cells. Nature 475, 226–230 [DOI] [PubMed] [Google Scholar]
- 12. Chouaib S., Messai Y., Couve S., Escudier B., Hasmim M., Noman M. Z. (2012) Hypoxia promotes tumor growth in linking angiogenesis to immune escape. Front. Immunol. 3, 21. [DOI] [PMC free article] [PubMed] [Google Scholar]
- 13. Porta C., Paglino C., Imarisio I., Ganini C., Pedrazzoli P. (2011) Immunological effects of multikinase inhibitors for kidney cancer: a clue for integration with cellular therapies? J. Cancer 2, 333–338 [DOI] [PMC free article] [PubMed] [Google Scholar]
- 14. Jonasch E., Corn P., Pagliaro L. C., Warneke C. L., Johnson M. M., Tamboli P., Ng C., Aparicio A., Ashe R. G., Wright J. J., Tannir N. M. (2010) Upfront, randomized, phase 2 trial of sorafenib versus sorafenib and low-dose interferon α in patients with advanced renal cell carcinoma: clinical and biomarker analysis. Cancer 116, 57–65 [DOI] [PMC free article] [PubMed] [Google Scholar]
- 15. Procopio G., Verzoni E., Bracarda S., Ricci S., Sacco C., Ridolfi L., Porta C., Miceli R., Zilembo N., Bajetta E. (2011) Sorafenib with interleukin-2 vs sorafenib alone in metastatic renal cell carcinoma: the ROSORC trial. Br. J. Cancer 104, 1256–1261 [DOI] [PMC free article] [PubMed] [Google Scholar]
- 16. Biswas S., Eisen T. (2009) Immunotherapeutic strategies in kidney cancer—when TKIs are not enough. Nat. Rev. Clin. Oncol. 6, 478–487 [DOI] [PubMed] [Google Scholar]
- 17. Pozarowski P., Darzynkiewicz Z. (2004) Analysis of cell cycle by flow cytometry. Methods Mol. Biol. 281, 301–311 [DOI] [PubMed] [Google Scholar]
- 18. Leich F., Stöhr N., Rietz A., Ulbrich-Hofmann R., Arnold U. (2007) Endocytotic internalization as a crucial factor for the cytotoxicity of ribonucleases. J. Biol. Chem. 282, 27640–27646 [DOI] [PubMed] [Google Scholar]
- 19. Hengartner M. O. (2000) The biochemistry of apoptosis. Nature 407, 770–776 [DOI] [PubMed] [Google Scholar]
- 20. Gu Y., Zhao W., Meng F., Qu B., Zhu X., Sun Y., Shu Y., Xu Q. (2010) Sunitinib impairs the proliferation and function of human peripheral T cell and prevents T-cell-mediated immune response in mice. Clin. Immunol. 135, 55–62 [DOI] [PubMed] [Google Scholar]
- 21. Flörcken A., Takvorian A., Van Lessen A., Singh A., Hopfenmüller W., Dörken B., Pezzutto A., Westermann J. (2012) Sorafenib, but not sunitinib, induces regulatory T cells in the peripheral blood of patients with metastatic renal cell carcinoma. Anticancer Drugs 23, 298–302 [DOI] [PubMed] [Google Scholar]
- 22. Zhao W., Gu Y. H., Song R., Qu B. Q., Xu Q. (2008) Sorafenib inhibits activation of human peripheral blood T cells by targeting LCK phosphorylation. Leukemia 22, 1226–1233 [DOI] [PubMed] [Google Scholar]
- 23. Bose A., Lowe D. B., Rao A., Storkus W. J. (2012) Combined vaccine+axitinib therapy yields superior antitumor efficacy in a murine melanoma model. Melanoma Res. 22, 236–243 [DOI] [PMC free article] [PubMed] [Google Scholar]
- 24. Zhou X., Zheng M., Chen F., Zhu Y., Yong W., Lin H., Sun Y., Han X. (2009) Gefitinib inhibits the proliferation of pancreatic cancer cells via cell cycle arrest. Anat. Rec. 292, 1122–1127 [DOI] [PubMed] [Google Scholar]
- 25. Minkin P., Zhao M., Chen Z., Ouwerkerk J., Gelderblom H., Baker S. D. (2008) Quantification of sunitinib in human plasma by high-performance liquid chromatography-tandem mass spectrometry. J. Chromatogr. B Analyt. Technol. Biomed. Life Sci. 874, 84–88 [DOI] [PMC free article] [PubMed] [Google Scholar]
- 26. Awada A., Hendlisz A., Gil T., Bartholomeus S., Mano M., de Valeriola D., Strumberg D., Brendel E., Haase C. G., Schwartz B., Piccart M. (2005) Phase I safety and pharmacokinetics of BAY 43–9006 administered for 21 days on/7 days off in patients with advanced, refractory solid tumours. Br. J. Cancer 92, 1855–1861 [DOI] [PMC free article] [PubMed] [Google Scholar]
- 27. Strumberg D., Richly H., Hilger R. A., Schleucher N., Korfee S., Tewes M., Faghih M., Brendel E., Voliotis D., Haase C. G., Schwartz B., Awada A., Voigtmann R., Scheulen M. E., Seeber S. (2005) Phase I clinical and pharmacokinetic study of the novel Raf kinase and vascular endothelial growth factor receptor inhibitor BAY 43-9006 in patients with advanced refractory solid tumors. J. Clin. Oncol. 23, 965–972 [DOI] [PubMed] [Google Scholar]
- 28. Sharma S., Abhyankar V., Burgess R. E., Infante J., Trowbridge R. C., Tarazi J., Kim S., Tortorici M., Chen Y., Robles R. L. (2010) A phase I study of axitinib (AG-013736) in combination with bevacizumab plus chemotherapy or chemotherapy alone in patients with metastatic colorectal cancer and other solid tumors. Ann. Oncol. 21, 297–304 [DOI] [PubMed] [Google Scholar]
- 29. Rugo H. S., Herbst R. S., Liu G., Park J. W., Kies M. S., Steinfeldt H. M., Pithavala Y. K., Reich S. D., Freddo J. L., Wilding G. (2005) Phase I trial of the oral antiangiogenesis agent AG-013736 in patients with advanced solid tumors: pharmacokinetic and clinical results. J. Clin. Oncol. 23, 5474–5483 [DOI] [PubMed] [Google Scholar]
- 30. Hipp M. M., Hilf N., Walter S., Werth D., Brauer K. M., Radsak M. P., Weinschenk T., Singh-Jasuja H., Brossart P. (2008) Sorafenib, but not sunitinib, affects function of dendritic cells and induction of primary immune responses. Blood 111, 5610–5620 [DOI] [PubMed] [Google Scholar]
- 31. Bromley S. K., Thomas S. Y., Luster A. D. (2005) Chemokine receptor CCR7 guides T cell exit from peripheral tissues and entry into afferent lymphatics. Nat. Immunol. 6, 895–901 [DOI] [PubMed] [Google Scholar]
- 32. Dar W. A., Knechtle S. J. (2007) CXCR3-mediated T-cell chemotaxis involves ZAP-70 and is regulated by signalling through the T-cell receptor. Immunology 120, 467–485 [DOI] [PMC free article] [PubMed] [Google Scholar]
- 33. Mohan K., Cordeiro E., Vaci M., McMaster C., Issekutz T. B. (2005) CXCR3 is required for migration to dermal inflammation by normal and in vivo activated T cells: differential requirements by CD4 and CD8 memory subsets. Eur. J. Immunol. 35, 1702–1711 [DOI] [PubMed] [Google Scholar]
- 34. De Meester I., Korom S., Van Damme J., Scharpé S. (1999) CD26, let it cut or cut it down. Immunol. Today 20, 367–375 [DOI] [PubMed] [Google Scholar]
- 35. Bühling F., Kunz D., Reinhold D., Ulmer A. J., Ernst M., Flad H. D., Ansorge S. (1994) Expression and functional role of dipeptidyl peptidase IV (CD26) on human natural killer cells. Nat. Immun. 13, 270–279 [PubMed] [Google Scholar]
- 36. Chen M. L., Pittet M. J., Gorelik L., Flavell R. A., Weissleder R., von Boehmer H., Khazaie K. (2005) Regulatory T cells suppress tumor-specific CD8 T cell cytotoxicity through TGF-β signals in vivo. Proc. Natl. Acad. Sci. U.S.A. 102, 419–424 [DOI] [PMC free article] [PubMed] [Google Scholar]
- 37. Liotta F., Gacci M., Frosali F., Querci V., Vittori G., Lapini A., Santarlasci V., Serni S., Cosmi L., Maggi L., Angeli R., Mazzinghi B., Romagnani P., Maggi E., Carini M., Romagnani S., Annunziato F. (2011) Frequency of regulatory T cells in peripheral blood and in tumour-infiltrating lymphocytes correlates with poor prognosis in renal cell carcinoma. BJU Int. 107, 1500–1506 [DOI] [PubMed] [Google Scholar]
- 38. Ozao-Choy J., Ma G., Kao J., Wang G. X., Meseck M., Sung M., Schwartz M., Divino C. M., Pan P. Y., Chen S. H. (2009) The novel role of tyrosine kinase inhibitor in the reversal of immune suppression and modulation of tumor microenvironment for immune-based cancer therapies. Cancer Res. 69, 2514–2522 [DOI] [PMC free article] [PubMed] [Google Scholar]
- 39. Ko J. S., Zea A. H., Rini B. I., Ireland J. L., Elson P., Cohen P., Golshayan A., Rayman P. A., Wood L., Garcia J., Dreicer R., Bukowski R., Finke J. H. (2009) Sunitinib mediates reversal of myeloid-derived suppressor cell accumulation in renal cell carcinoma patients. Clin. Cancer Res. 15, 2148–2157 [DOI] [PubMed] [Google Scholar]
- 40. Xin H., Zhang C., Herrmann A., Du Y., Figlin R., Yu H. (2009) Sunitinib inhibition of Stat3 induces renal cell carcinoma tumor cell apoptosis and reduces immunosuppressive cells. Cancer Res. 69, 2506–2513 [DOI] [PMC free article] [PubMed] [Google Scholar]
- 41. Finke J. H., Rini B., Ireland J., Rayman P., Richmond A., Golshayan A., Wood L., Elson P., Garcia J., Dreicer R., Bukowski R. (2008) Sunitinib reverses type-1 immune suppression and decreases T-regulatory cells in renal cell carcinoma patients. Clin Cancer Res. 14, 6674–6682 [DOI] [PubMed] [Google Scholar]
- 42. Sohn D., Schulze-Osthoff K., Jänicke R. U. (2005) Caspase-8 can be activated by interchain proteolysis without receptor-triggered dimerization during drug-induced apoptosis. J. Biol. Chem. 280, 5267–5273 [DOI] [PubMed] [Google Scholar]
- 43. Samraj A. K., Sohn D., Schulze-Osthoff K., Schmitz I. (2007) Loss of caspase-9 reveals its essential role for caspase-2 activation and mitochondrial membrane depolarization. Mol. Biol. Cell 18, 84–93 [DOI] [PMC free article] [PubMed] [Google Scholar]
- 44. Vander Heiden M. G., Chandel N. S., Williamson E. K., Schumacker P. T., Thompson C. B. (1997) Bcl-xL regulates the membrane potential and volume homeostasis of mitochondria. Cell 91, 627–637 [DOI] [PubMed] [Google Scholar]
- 45. Andersen J. L., Kornbluth S. (2012) Mcl-1 rescues a glitch in the matrix. Nat. Cell Biol. 14, 563–565 [DOI] [PubMed] [Google Scholar]
- 46. Rahmani M., Davis E. M., Bauer C., Dent P., Grant S. (2005) Apoptosis induced by the kinase inhibitor BAY 43-9006 in human leukemia cells involves down-regulation of Mcl-1 through inhibition of translation. J. Biol. Chem. 280, 35217–35227 [DOI] [PubMed] [Google Scholar]
- 47. Rahmani M., Davis E. M., Crabtree T. R., Habibi J. R., Nguyen T. K., Dent P., Grant S. (2007) The kinase inhibitor sorafenib induces cell death through a process involving induction of endoplasmic reticulum stress. Mol. Cell. Biol. 27, 5499–5513 [DOI] [PMC free article] [PubMed] [Google Scholar]
- 48. Yu C., Bruzek L. M., Meng X. W., Gores G. J., Carter C. A., Kaufmann S. H., Adjei A. A. (2005) The role of Mcl-1 downregulation in the proapoptotic activity of the multikinase inhibitor BAY 43-9006. Oncogene 24, 6861–6869 [DOI] [PubMed] [Google Scholar]
- 49. Harley M. E., Allan L. A., Sanderson H. S., Clarke P. R. (2010) Phosphorylation of Mcl-1 by CDK1-cyclin B1 initiates its Cdc20-dependent destruction during mitotic arrest. EMBO J. 29, 2407–2420 [DOI] [PMC free article] [PubMed] [Google Scholar]
- 50. Hwang A., Maity A., McKenna W. G., Muschel R. J. (1995) Cell cycle-dependent regulation of the cyclin B1 promoter. J. Biol. Chem. 270, 28419–28424 [DOI] [PubMed] [Google Scholar]
- 51. Allan L. A., Clarke P. R. (2007) Phosphorylation of caspase-9 by CDK1/cyclin B1 protects mitotic cells against apoptosis. Mol. Cell 26, 301–310 [DOI] [PubMed] [Google Scholar]
- 52. Bose A., Taylor J. L., Alber S., Watkins S. C., Garcia J. A., Rini B. I., Ko J. S., Cohen P. A., Finke J. H., Storkus W. J. (2011) Sunitinib facilitates the activation and recruitment of therapeutic anti-tumor immunity in concert with specific vaccination. Int. J. Cancer 129, 2158–2170 [DOI] [PMC free article] [PubMed] [Google Scholar]
- 53. Farsaci B., Higgins J. P., Hodge J. W. (2012) Consequence of dose scheduling of sunitinib on host immune response elements and vaccine combination therapy. Int. J. Cancer 130, 1948–1959 [DOI] [PMC free article] [PubMed] [Google Scholar]
- 54. Kujawski M., Zhang C., Herrmann A., Reckamp K., Scuto A., Jensen M., Deng J., Forman S., Figlin R., Yu H. (2010) Targeting STAT3 in adoptively transferred T cells promotes their in vivo expansion and antitumor effects. Cancer Res. 70, 9599–9610 [DOI] [PMC free article] [PubMed] [Google Scholar]