Background: HDAC1 and -2 homo- or heterodimers within corepressor complexes are displaced from chromatin during mitosis.
Results: CK2-mediated mitotic phosphorylated HDAC1 and -2 are dissociated from each other but not from corepressor complexes.
Conclusion: HDAC1 or HDAC2 homodimers, but not heterodimers, are responsible for the activity of mitotic corepressor complexes.
Significance: Mitotically phosphorylated HDAC1 and -2 potentially target different cellular proteins.
Keywords: Corepressor Transcription, Histone Deacetylase, Mitosis, Protein Kinases, Protein Phosphorylation, HDAC2 Phosphorylation, Protein Kinase CK2
Abstract
Histone deacetylase 1 (HDAC1) and HDAC2 are components of corepressor complexes that are involved in chromatin remodeling and regulation of gene expression by regulating dynamic protein acetylation. HDAC1 and -2 form homo- and heterodimers, and their activity is dependent upon dimer formation. Phosphorylation of HDAC1 and/or HDAC2 in interphase cells is required for the formation of HDAC corepressor complexes. In this study, we show that during mitosis, HDAC2 and, to a lesser extent, HDAC1 phosphorylation levels dramatically increase. When HDAC1 and -2 are displaced from the chromosome during metaphase, they dissociate from each other, but each enzyme remains in association with components of the HDAC corepressor complexes Sin3, NuRD, and CoREST as homodimers. Enzyme inhibition studies and mutational analyses demonstrated that protein kinase CK2-catalyzed phosphorylation of HDAC1 and -2 is crucial for the dissociation of these two enzymes. These results suggest that corepressor complexes, including HDAC1 or HDAC2 homodimers, might target different cellular proteins during mitosis.
Introduction
Lysine acetyltransferases and histone deacetylases (HDACs)4 have important roles in the control of gene expression by remodeling chromatin through their regulation of dynamic acetylation of histones, transcription factors, and chromatin-modifying enzymes. Class I HDAC1 and -2 have roles in the regulation of gene transcription and pre-mRNA splicing (1–3). They are highly homologous proteins with respect to DNA (75% identity) and protein sequences (85% identity) (4). Although they have undergone little functional divergence and co-exist in multiprotein complexes, HDAC1 and -2 also have specific and distinct roles (5–7). Both are dysregulated in disease states and are overexpressed in cancer cells, whereas HDAC2 is underexpressed in chronic obstructive pulmonary disease (8, 9). HDAC1 and -2 are phosphorylated, a modification that is required for these enzymes to be assembled into the multiprotein Sin3, NuRD, and CoREST corepressor complexes (4, 10–13). In these complexes, HDAC1 and -2 exist as heterodimers, although it is possible that the enzymes are present as homodimers of HDAC1 or HDAC2. Regardless of the configuration, dimer formation of HDAC1 and -2 is a requirement for catalytic activity (14). Further, HDAC1 and -2 activities are augmented by phosphorylation, with the nonphosphorylated HDAC1/2 showing low activity (4, 10, 12). HDAC1 and -2 are phosphorylated at multiple serines in the C-terminal portion of the protein by protein kinase CK2 (HDAC1 at Ser-393, Ser-421, and Ser-423; HDAC2 at Ser-394, Ser-422, and Ser-424). Mutation in any of the three phosphorylation sites is sufficient to disrupt the interaction of HDAC1 and HDAC2 with RbAp48 and other binding partners of the corepressor complexes (4, 10–13). However, these mutations have no major effect on the binding of HDAC2 with HDAC1 (4). The corepressor complexes with HDAC1 and -2 are directed to regulatory regions of transcribed genes by a number of transcription factors, such as Sp1 and Sp3 (12, 15). Although the HDAC1/2 corepressor complexes containing phosphorylated HDAC2 are recruited to regulatory regions of transcribed genes, the nonphosphorylated HDAC2 is directed to coding regions of transcribed genes (12).
During mitosis both lysine acetyltransferases and HDACs are displaced from mitotic chromosomes (16, 17); however, the enzymes maintain their activities in the cell. HDAC inhibitors do not induce histone hyperacetylation in mitotic HeLa cells (18), which is consistent with the observation that although the HDACs are catalytically active during mitosis, the enzymes are not located on the chromatin substrate. Further during mitosis, HDAC2 becomes highly phosphorylated, but the protein kinase responsible remains to be identified (19). Evidence was also presented that when HDAC1 and HDAC2 were in an highly phosphorylated state induced by okadaic acid, they dissociated from each other and from corepressor complexes (19). Whether similar events occur in mitosis is currently not known.
In this study, we investigated the distribution of HDAC1 and HDAC2, their phosphorylation state, and the state of the HDAC1/2 corepressor complexes during mitosis using high resolution microscopy and biochemical approaches. Our results demonstrate an important role of protein kinase CK2 in the phosphorylation of HDAC2 during mitosis, an event that results in the dissociation of HDAC1 from HDAC2 but not the dissociation of HDAC1 or -2 from the HDAC corepressor complexes.
EXPERIMENTAL PROCEDURES
Cell Culture
HeLa, HEK 293, MCF7, and Flp-In 293 cells were grown and maintained in Dulbecco's modified Eagle's medium (Invitrogen) supplemented with 10% fetal bovine serum (FBS), 1.0% d-glucose, 2 mm l-glutamine, 100 units/ml penicillin, 100 μg/ml streptomycin, and 250 ng/ml amphotericin B at 37 °C in a humidified atmosphere containing 5% CO2.
Mitotic HDAC1 and HDAC2 Sample Preparation
Whole protein extracts were prepared as described (20) from HeLa cells treated with taxol (T7402, Sigma), nocodazole (M1404, Sigma) (1 μm each), or DMSO either in the presence or absence of inhibitors (phosphatase inhibitors: 20 mm β-glycerophosphate, 100 μm sodium orthovanadate, 50 mm sodium fluoride, 20 mm sodium pyrophosphate, 10 mm sodium butyrate). Phosphatase inhibitors were omitted for samples used in calf intestinal phosphatase (CIP) assays.
Calf Intestinal Phosphatase Assay
Protein extract (150 μg) from phosphatase inhibitor-free samples was supplemented with an adequate volume of 10× NEBuffer2 (New England Biolabs) and incubated with 10 units of CIP (New England Biolabs) at 37 °C for 2 h. Phosphatase inhibitor-containing or phosphatase inhibitor-free control samples were treated only with buffer. Equal volumes of CIP-treated and -untreated samples were analyzed by SDS-PAGE with antibodies specific for HDAC1 and -2 (produced in the laboratory of C. S.), and Cdc27. The Cdc27 antibody was a gift from Dr. Jan-Michael Peters (Research Institute of Molecular Pathology, Vienna, Austria). For two-dimensional SDS-PAGE analysis, 50 μg of protein extract and 3–4 units of CIP were used.
Double Thymidine Block and Mitotic Block
60–70% confluent HeLa cells were treated with thymidine (Sigma) at a final concentration of 2 mm for 19 h. After the incubation period, cells were washed three times with DMEM and incubated with fresh serum-rich medium for 10 h before the addition of thymidine (2 mm) again. Cells were incubated for 16–17 h and washed as described. Protein extracts and FACS samples were prepared 6, 7, 8, 10, and 12 h after second release. For mitotic block, protein samples were prepared after a 20-h treatment with nocodazole or taxol. In the immunoprecipitation experiments, cells treated with 1 μm nocodazole for a 16-h time period were used to obtain the mitotic protein extracts.
Two-dimensional Gel Electrophoresis
Fifty μg of proteins of total cell lysate from untreated and nocodazole-treated HeLa cells were loaded on isoelectric focusing strips (pH 3–10 and 4–7) and electrophoresed according to the manufacturer's instructions (Bio-Rad). The second dimension electrophoresis was performed on SDS-7.5% PAGE, and immunoblotting was performed with HDAC1, HDAC2, and HDAC2ph (Ser-394) (Abcam) antibodies.
Indirect Immunofluorescence
Indirect immunolocalization of HDAC1 and -2 during mitosis was performed as described previously (17). Mouse monoclonal antibody against HDAC2 (1:250; Millipore) and rabbit polyclonal antibody against HDAC1 (1:5000; Affinity BioReagents) were used. Alexa Fluor 488 donkey anti-mouse or -rabbit IgG (Molecular Probes, Inc., Eugene, OR) and Alexa Fluor 594 donkey anti-rabbit or -mouse IgG (Molecular Probes, Inc.), were used as secondary antibodies. DNA was counterstained with 4′, 6-diamidino 2-phenylindole (DAPI). Control experiments including epitope peptide blocking or primary antibody omission demonstrated the specificity of the antibodies used. Digital images were captured with a Zeiss Axio Imager Z1 microscope and AxioCam HRm camera. The images were captured with 100 slices at stepwise of 200 nm. The deconvolution analysis of stack images was performed with the Axio Vision software (Carl Zeiss).
Immunoprecipitation and Immunoblotting
HeLa cells were lysed in IP buffer (50 mm Tris-HCl, pH 8.0, 150 mm NaCl, 1.0 mm EDTA, 0.5% Nonidet P-40) containing phosphatase and protease inhibitors, and immunoprecipitations were performed as described earlier (11). Briefly, 500 μg of total cell extract were incubated with 3.0 μg of different antibodies overnight at 4 °C. Thirty μl of protein G-Sepharose beads were added the following day and incubated for 3–4 h at 4 °C. The beads were then washed three times with ice-cold IP buffer. For each cell lysate, an immunoprecipitation with isotype-specific non-related IgG was also performed as a negative control to check for nonspecific immunoprecipitation. Also, an immunodepleted fraction corresponding to each immunoprecipitation reaction was included in immunoblotting analysis to test the immunoprecipitation efficiency. Immunoblot analysis was carried out as described previously (21). Rabbit polyclonal antibodies against human HDAC1 (Affinity BioReagents), HDAC2 (Affinity BioReagents), Sin3A (Affinity BioReagents), CoREST (Abcam), and V5 (Abcam) and mouse monoclonal antibodies against HDAC1 (Millipore), HDAC2 (Millipore), RbAp48 (Abcam), and V5 (Invitrogen) were used. For quantification purposes, RbAp48 antibody immunoprecipitates from control and nocodazole-treated cell lysates were immunoblotted with anti-HDAC1 or anti-HDAC2 antibodies. The corresponding immunoblot membranes were imaged with a Fluorchem 9900 imaging system (Alpha Innotech). The densitometry values of the bands of input and immunodepleted fractions were quantified and were normalized to the background levels. The unbound fractions were determined as relative to input (percentage of input). The average values of three independent experiments were used to calculate the bound fractions by subtracting the unbound fractions from 100%.
HDAC Activity Assay
HDAC activity assay was performed with the Fluor-de-Lys® HDAC fluorometric activity assay kit (Enzo Life Sciences) following the manufacturer's instructions. Briefly, HDAC1 or HDAC2 complexes were immunoprecipitated from 100 μg of HeLa cell lysates (cycling and mitotic) with 1 μg of rabbit polyclonal anti-HDAC1 or anti-HDAC2 antibodies. The beads with antibody-HDAC complex were washed three times with the IP buffer and once with the HDAC activity assay buffer before they were used for the HDAC activity assay. For the assay, the beads were incubated with or without 1.0 μm trichostatin A (TSA) before the addition of 150 μm Fluor-de-Lys® substrate. The reactions were then incubated at room temperature for 30 min while shaking on a rocker. After that, the developer I solution containing 1 μm TSA was added, and the reactions were incubated for another 15 min to stop the reactions. The fluorescence signal was measured using a fluorometric plate reader (Spectra MAX GEMINI XS, Molecular Devices).
Treatment Conditions for CK2 Inhibitors
Cells were treated with 100 μm 4,5,6,7-tetrabromobenzotriazole (TBB) (Calbiochem) or 50 μm quinalizarin (EMD Biosciences) for 12 h before the addition of nocodazole (1 μm) and incubation for 16 h. The cell lysates were analyzed by immunoprecipitation and immunoblotting with HDAC1 and -2 antibodies.
Flp-In 293-HDAC2 (WT)-V5 and Flp-In 293-HDAC2 (M3A)-V5 Stable Cell Line Construction
Flp-In 293 host cell lines were purchased from Invitrogen. Plasmid HDAC2-WT and HDAC2-triple 3A mutant (Ser to Ala mutations) were constructed by using plasmid FLAG-HDAC2 and FLAG-HDAC2-M3A as described previously (12) as templates and with the primers 5′-ACCATGGCGTACAGTCAAGGAGGAGGCAA-3′ (forward) and 5′-AGGGTTGCTGAGTTGTTCTGACTTTC-3′ (reverse) and cloned in pcDNA5/FRT expression vector. Stable Flp-In 293 cell lines expressing the wild type HDAC2 and M3A mutant HDAC2 were established according to the manufacturer's instructions (Invitrogen).
Plasmids and Transfection
Plasmid HDAC1-MYC was previously described (22), and plasmids HDAC1-FLAG and FLAG-HDAC2 were kind gifts from Dr. Edward Seto. Plasmids FLAG-HDAC2-S394A and FLAG-HDAC2-S422A/S424A were constructed using the GENEART site-directed mutagenesis kit (Invitrogen). Mutagenesis PCR was carried out using FLAG-HDAC2 as template and primer pairs S394A (5′-GATGCTGTTCATGAAGACGCTGGAGATGAGGATGGAGAAG-3′ (forward) and 5′-CTTCTCCATCCTCATCTCCAGCGTCTTCATGAACAGCATC-3′ (reverse), mutated sites underlined) and S422A/S424A (5′-GCTTGCGATGAAGAGTTTGCAGATGCTGAGGATGAAGGTGAAG-3′ (forward) and 5′-CTTCACCTTCATCCTCAGCATCTGCAAACTCTTCATCGCAAGC-3′ (reverse)) for FLAG-HDAC2-S394A and FLAG-HDAC2-S422A/S424A, respectively. All of the plasmid constructs were verified by DNA sequencing. Four μg of HDAC1-MYC and HDAC1-FLAG plasmids were co-transfected into HEK 293 cells using the Lipofectamine 2000 transfection reagent (Invitrogen) according to the manufacturer's instructions. FLAG-HDAC2 or FLAG-HDAC2-S394A or FLAG-HDAC2-S422A/S424A plasmids were transfected individually into HEK 293 cells. Approximately 32 h after transfection, the cells were treated with 1.0 μm nocodazole for 16 h. After the treatment period, cells were harvested by mitotic shake off. Cell lysates were prepared for immunoprecipitation with antibodies against anti-FLAG (Sigma), anti-MYC (Sigma), and anti-HDAC1 (Affinity Bioreagents).
RESULTS
Increased Phosphorylation of HDAC1 and -2 during Mitosis
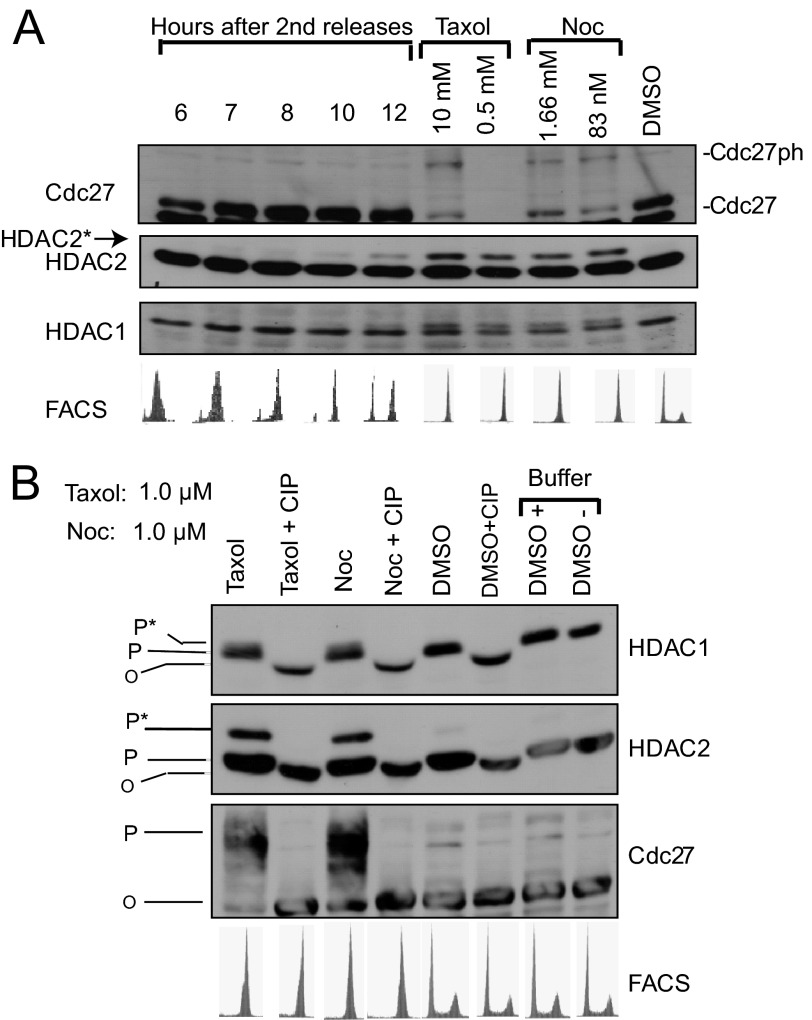
It has been reported previously that HDAC2 is hyperphosphorylated in nocodazole-treated cells that arrest in prometaphase (19). To further explore the levels of HDAC1 and -2 phosphorylation throughout the cell cycle, HeLa cells were synchronized in the G1/S phase of the cell cycle by using a double thymidine block. Following release from the block, cells were collected at various time points. At each time point, the cellular extracts were prepared and analyzed by immunoblotting for HDAC1 and HDAC2. The level of phosphorylated HDAC2 increased at 10 and 12 h postrelease of the block, at which time cells had entered mitosis (Fig. 1A). Consistent with previous observations, phosphorylated HDAC2 (HDAC2*) had a reduced mobility in SDS-PAGE (11, 19). Cells blocked in mitosis by treatment with taxol or nocodazole (microtubule inhibitors) also had increased levels of HDAC2* as well as phosphorylated Cdc27, a component of the anaphase-promoting complex that is phosphorylated during mitosis. HDAC1 of mitotic cells had a retarded band that typically migrated very close to the parent band (Fig. 1A). To confirm that the slower migrating bands observed for HDAC1, HDAC2, and Cdc27 corresponded to the phosphorylated forms of these proteins, the cell lysate was treated with CIP prior to SDS-PAGE (Fig. 1B). CIP treatment increased the mobility of HDAC1 and HDAC2 in mitotic cell extracts as well as cycling cell extracts. The retarded bands seen for HDAC1, HDAC2, and Cdc27 in mitotic extracts were not observed following treatment with CIP. These data indicate that the differences in migration patterns of these proteins between the control and mitotic extract were due to phosphorylation and not other post-translational modifications.
FIGURE 1.
Mitotic phosphorylation of HDAC1 and -2. Whole cell protein extracts were prepared in the presence of protein phosphatase inhibitors except for samples used in the CIP assay. For thymidine double block, protein and FACS samples were prepared 6, 7, 8, 10, and 12 h after second release. For mitotic block, protein samples were prepared after 20-h treatment with taxol or nocodazole (Noc). A and B, protein samples were analyzed by immunoblotting using the indicated antibodies. The state of phosphorylation is indicated as O, P, or P*, representing unmodified, phosphorylated, and hyperphosphorylated isoforms, respectively.
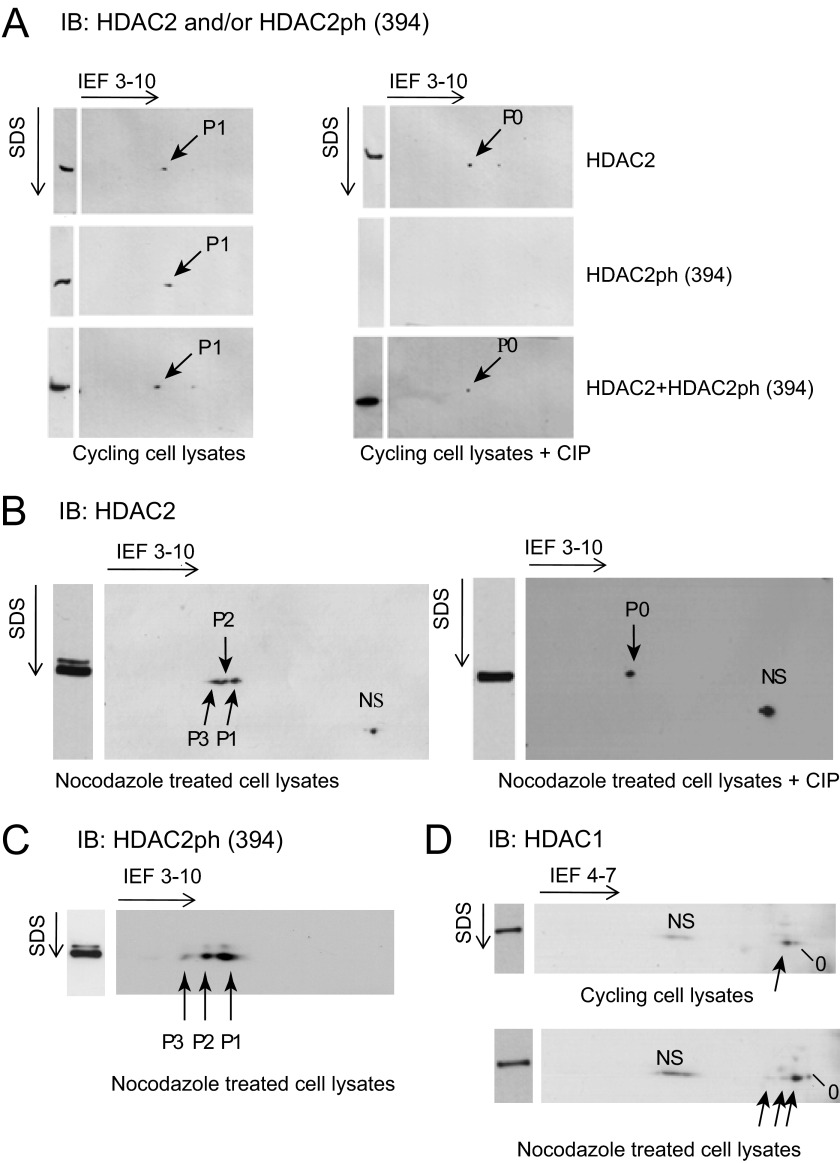
Further analyses of HDAC1 and HDAC2 modifications in cycling and mitotic HeLa cells were performed by resolving the cell lysates by two-dimensional PAGE followed by immunoblotting. In cycling HeLa cells, only one HDAC2 isoform was detected with the anti-HDAC2 antibody (Fig. 2A). The same HDAC2 isoform was also detected with anti-HDAC2 Ser-394 phosphoantibody in a two-dimensional PAGE pattern. However, treatment of the cycling HeLa cell lysate with CIP resulted in detection of HDAC2 with the anti-HDAC2 antibody but not with the anti-HDAC2 Ser-394 phosphoantibody (Fig. 2A). We thus conclude that in HeLa cycling cells, most HDAC2 is in a monophosphorylated state.
FIGURE 2.
HDAC2 is highly phosphorylated in mitotic HeLa cells. Fifty μg of whole cell lysates from cycling and nocodazole-treated HeLa cells were separated by isoelectric focusing (IEF) and then by SDS-PAGE and subsequently immunoblotted (IB) with anti-HDAC2 (A and B), anti-HDAC2ph (Ser-394) (A and C), or anti-HDAC1 (D) antibodies. Cycling and nocodazole-arrested samples treated with CIP were also analyzed (A and B). Shown are unmodified (P0), monophosphorylated (P1), diphosphorylated (P2), and triphosphorylated (P3) protein and nonspecific (NS) protein that was not reproducibly observed with antibodies against HDAC2.
In mitotic cells, three isoforms of HDAC2 were detected with anti-HDAC2 antibody, which were also detected with the HDAC2 Ser-394 phosphoantibody (Fig. 2, B and C, respectively). Treatment of the mitotic cell lysate with CIP resulted in the detection of only one HDAC2 form with the anti-HDAC2 antibody, the non-phosphorylated isoform (Fig. 2B). Based upon these results, we have assigned the three isoforms as the mono-, di-, and triphosphorylated HDAC2. These data demonstrate the dramatic increase in the steady state level of HDAC2 phosphorylation in the mitotic HeLa cells.
In addition, we provide evidence that the steady state of HDAC1 in HeLa cycling cells is the monophosphorylated state (Fig. 2D). Mitotic cells had increased levels of multiple phosphorylated isoforms of HDAC1; however, the increase in the steady state of the di- and triphosphorylated forms of HDAC1 in mitotic cells was not as pronounced as for HDAC2, in agreement with results shown in Fig. 1.
HDAC1 or -2 Corepressor Complexes during Mitosis
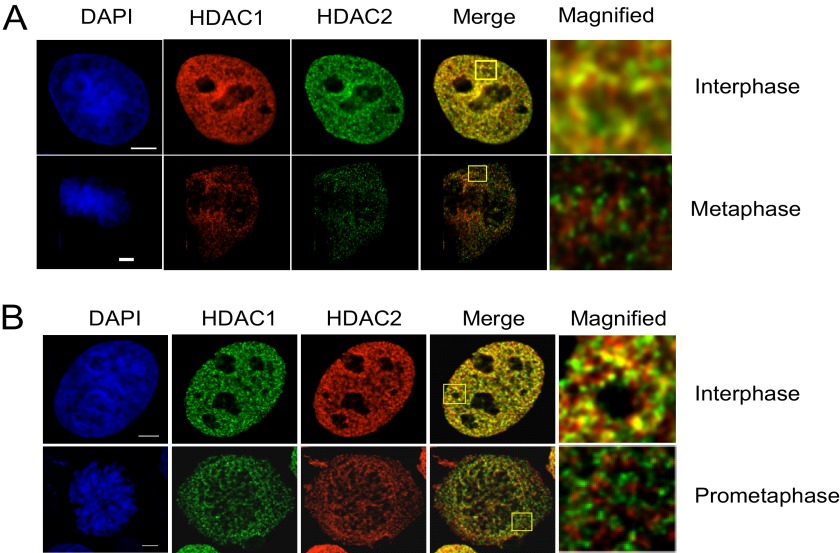
Previous reports showed that HDAC1 and HDAC2 dissociate from condensed chromosomes during mitosis (16). To determine whether HDAC1 and HDAC2 remained as heterodimers in mitosis, as observed in the cycling cells, we studied the distributions of HDAC1 and -2 in a cycle-asynchronized cell population of HeLa cells by fluorescence microscopy after indirect immunofluorescence labeling of cells grown and fixed on coverslips (Fig. 3). The cell cycle phases were determined by DAPI staining. In the interphase stage, there was partial co-localization of HDAC1 and HDAC2 (see merge in Fig. 3A). However, in metaphase cells, there was no co-localization of the two enzymes. We repeated the above analyses with human breast cancer cell line MCF7 to evaluate the generality of these observations. As observed in HeLa cells, HDAC1 and HDAC2 were co-localized in interphase MCF7 cells but not in the prometaphase stage (Fig. 3B). We have reported previously that in cycling MCF7 cells, Sp1 and Sp3 occupied nuclear sites different from those occupied by HDAC1 and HDAC2 (23).
FIGURE 3.
HDAC1 and HDAC2 locate at distinct foci during mitosis. A, HeLa cells were subjected to indirect immunofluorescence labeling with HDAC1 or -2 antibodies and co-stained with DAPI for identification of cell cycle stages. Yellow signals in the merged image signify colocalization. Bar, 5 μm. B, MCF7 cells were digitally imaged as described in A.
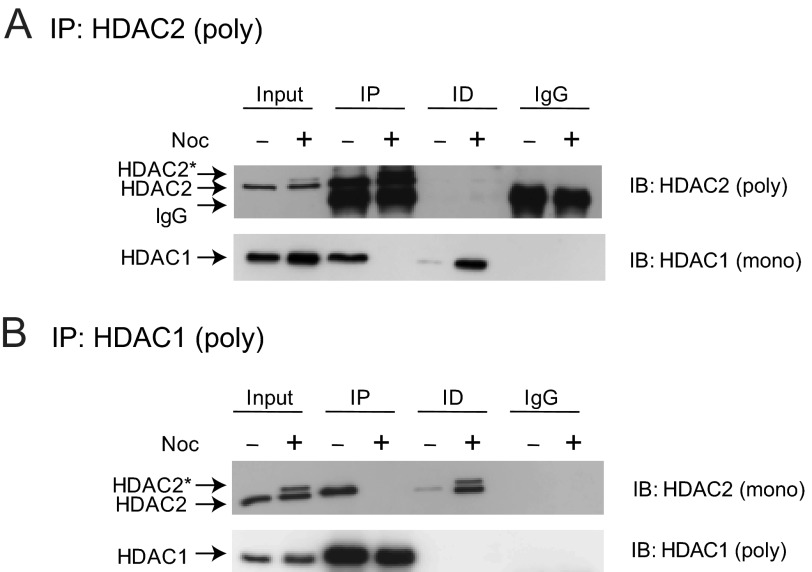
The dissociation of HDAC1 from HDAC2 during mitosis was further studied in co-immunoprecipitation assays with cellular lysates from cycling and mitotic HeLa cells. To isolate HeLa cells arrested in prometaphase, cells were cultured in the presence of nocodazole for 16 h, followed by shake off of mitotic cells from the tissue culture plate. Cycling and prometaphase-arrested cell lysates were incubated with anti-HDAC2 or anti-HDAC1 antibodies under low stringency conditions, and the immunoprecipitated fractions were analyzed by immunoblotting with anti-HDAC1 or anti-HDAC2 antibodies, respectively, to test if these proteins interacted with each other. Consistent with previous studies using MCF7 cells, HDAC1 and HDAC2 co-immunoprecipitated from cycling cell lysates (Fig. 4, A and B) (23). However, co-association of these two enzymes was not observed in the lysates of nocodazole treated (prometaphase-arrested) cells. These observations show that HDAC1 and HDAC2 do not form heterodimers during mitosis.
FIGURE 4.
Mitotic phosphorylation results in the dissociation of HDAC1 and -2. Total cell lysates (500 μg) from cycling and nocodazole (Noc)-treated HeLa cells were incubated with 3.0 μg of rabbit polyclonal anti-HDAC2 (A) or anti-HDAC1 (B) (poly) antibodies. The co-immunoprecipitations were checked by immunoblotting with mouse monoclonal anti-HDAC1 and -2 (mono), or rabbit polyclonal anti-HDAC1 and -2 (poly) antibodies. Immunoprecipitated and immunodepleted fractions are indicated as IP and ID, respectively. The phosphorylated form of HDAC2, which has reduced mobility in SDS-PAGE, is shown as HDAC2*.
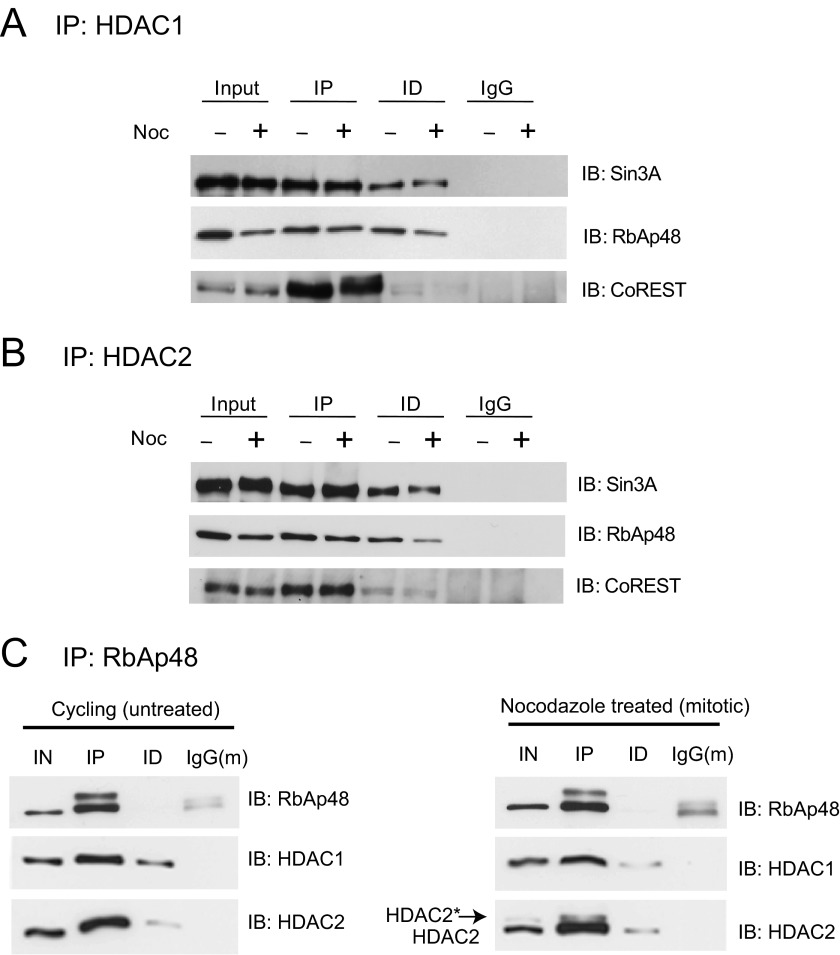
HDAC1 and HDAC2 exist in large multiprotein complexes, Sin3A, NuRD, and CoREST. We investigated whether the mitotic increased phosphorylation of HDAC2 resulted in dissolution of the complexes, as observed previously in cells treated with the phosphatase inhibitor okadaic acid (19). To this end, the HDAC1 and HDAC2 immunoprecipitated fractions from cycling and mitotic extracts of HeLa cells were analyzed for the presence of Sin3A, RbAp48, and CoREST. Sin3A, RbAp48, and CoREST proteins were co-immunoprecipitated with HDAC1 and HDAC2 in HeLa cycling as well as nocodazole arrested prometaphase cells (Fig. 5, A and B, respectively). We reproducibly observed an increase of RbAp48 with HDAC1 in mitotic versus cycling cells, whereas the amount of HDAC2 with RbAp48 did not change (Fig. 5C). Quantification of the amount of RbAp48 in cycling versus mitotic HeLa cells demonstrated an increase in RbAp48 association with HDAC1 (27 ± 3% in cycling versus 54 ± 2% in mitotic, n = 3) and to a lesser extent with HDAC2 (64 ± 1% in cycling and 66 ± 1% in mitotic, n = 3) in mitotic cells. Together, these results suggest that mitotic cells harbor corepressor complexes containing homodimers of either HDAC1 or HDAC2.
FIGURE 5.
HDAC1 and -2 maintains the interactions with corepressor complex proteins during mitosis. A and B, total cell lysates (500 μg) from cycling and nocodazole (Noc)-treated HeLa cells were incubated with 3.0 μg of rabbit anti-HDAC1 (A) or anti-HDAC2 (B) antibodies. The immunoprecipitated fractions were checked with antibodies against Sin3A, RbAp48, or CoREST. Isotype-specific non-related rabbit IgG was used as negative control. IP and ID, immunoprecipitated and immunodepleted fractions, respectively. C, total cellular lysates (500 μg) from cycling (untreated) and nocodazole-treated (mitotic) HeLa cells were incubated with 3.0 μg of mouse anti-RbAp48 antibody. The immunoprecipitated fractions were analyzed by anti-HDAC1 and anti-HDAC2 antibodies. Isotype-specific non-related mouse IgG was used as negative control. IN, IP, and ID represent input, immunoprecipitated, and immunodepleted fractions, respectively. The slower migrating band in the RbAp48 immunoprecipitated fraction may be phosphorylated RbAp48, but this has not been validated. The representative immunoblots are shown from one of three independent experiments, which are used for quantifications as mentioned under “Experimental Procedures.”
To determine whether the HDAC1 and HDAC2 complexes were enzymatically active, we immunoprecipitated HDAC1 and HDAC2 complexes from cycling and mitotic HeLa cells (nocodazole-treated) and assayed the HDAC complex for HDAC activity (Fig. 6A). As shown in Fig. 6B, the HDAC1 and HDAC2 immunoprecipitates from cycling cells had both HDAC1 and HDAC2. In mitotic cells (nocodazole-treated), only HDAC1 or HDAC2 was immunoprecipitated with their respective antibodies. The immunoprecipitated HDAC1 and HDAC2 complexes from cycling and mitotic cells had HDAC activity, which was inhibited by the HDAC inhibitor TSA. Control immunoprecipitates lacked HDAC activity.
FIGURE 6.
HDAC1 or HDAC2 complexes are catalytically active during mitosis. A, HDAC1 or HDAC2 complexes were isolated by immunoprecipitation with anti-HDAC1 or anti-HDAC2 antibodies from cycling (cyc) and nocodazole-treated HeLa cells (mit). HDAC activity in the immunoprecipitated fractions was measured by fluorometric activity assay kit. The activity of the HDAC1/2 complexes represents the average of three independent experiments and is relative to the activity from a non-related IgG control in cycling cells (without TSA treatment, which is set to 1 in all experiments) in arbitrary units. Error bars, S.D. B, representative immunoblot analysis (IB) from three independent experiments of HDAC1 and HDAC2 complexes in cycling (Noc−) and mitotic HeLa cells (Noc+) for corresponding HDAC activity assay shows that HDAC1 and HDAC2 did not interact with each other during mitosis. HDAC2*, phosphorylated form of HDAC2.
Increased Mitotic Phosphorylation of HDAC2 and Protein Kinase CK2
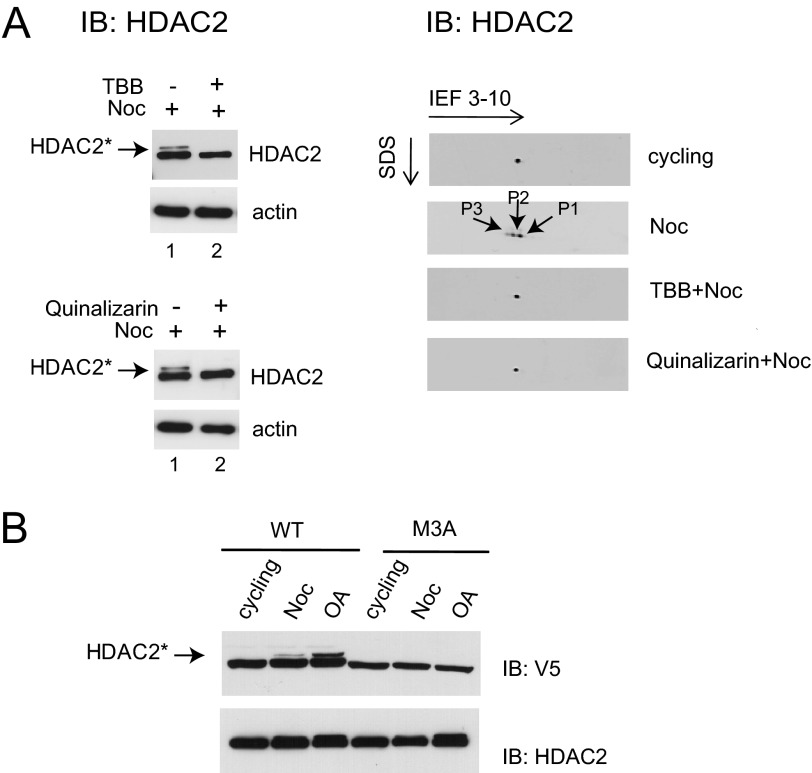
In cycling cells, protein kinase CK2 phosphorylates HDAC2 at Ser-394, Ser-422, and Ser-424. We therefore investigated whether CK2 was involved in the increased phosphorylation of HDAC2 during mitosis. For this, HeLa cells were incubated with the CK2 inhibitor TBB before the addition of nocodazole, and the protein extracts were analyzed by immunoblotting. We found that the slowly migrating HDAC2 band (HDAC2*) disappeared in extracts from mitotic cells pretreated with TBB (Fig. 7A, left, compare lanes 1 and 2). Similar results were obtained when the experiments were repeated with another CK2 inhibitor, quinalizarin (Fig. 7A, left). Pretreatment with quinalizarin prevented the appearance of the slowly migrating HDAC2 band in the mitotic cell lysate. Further, two-dimensional immunoblotting analyses of the HDAC2 phosphorylation state following pretreatment of nocodazole-incubated cells with the CK2 inhibitors (TBB or quinalizarin) detected one form of HDAC2 under these conditions, the same form as in cycling cells (Fig. 7A, right).
FIGURE 7.
CK2 mediated increased phosphorylation of HDAC2 during mitosis. A, whole cell lysates from TBB-nocodazole (Noc) or quinalizarin-nocodazole-treated HeLa cells were analyzed by SDS-PAGE (left) and two-dimensional gel electrophoresis (right) and subsequently immunoblotted (IB) with anti-HDAC2 antibody to check for phosphorylation levels. β-Actin levels in extracts were also examined on an immunoblot to demonstrate that there was equal loading of protein from each of the lysates. B, immunoblot analysis of V5 and HDAC2 from cellular extracts of Flp-In 293 cells stably expressing HDAC2-WT-V5 (WT) or HDAC2-M3A-V5 proteins (M3A), treated with nocodazole (Noc) or okadaic acid (OA). HDAC2*, phosphorylated form of HDAC2.
To investigate our observations in further detail, we established Flp-In 293 cell lines stably expressing HDAC2 wild type (WT) or triple mutant HDAC2 (M3A) V5-tagged proteins, where the three CK2 phosphosites were mutated from serine to alanine (Ser → Ala mutation at Ser-394, Ser-422, and Ser-424). Treatment of these stable cell lines with nocodazole or okadaic acid resulted in the appearance of a slower migrating HDAC2 band in the cellular extract for the wild type constructs but not for the mutants (Fig. 7B). Alanine substitutions for Ser-394, Ser-422, and Ser-424 abolished the slowly migrating HDAC2 band in mitotic extracts, implying a role for phosphorylation of these residues in altering the mobility and conformation of this protein in SDS-PAGE. This observation provides evidence that the reduced mobility of HDAC2 is due to CK2-mediated phosphorylation at one or more of the Ser-422 and Ser-424 phosphosites. Taken together, our data demonstrate that protein kinase CK2 plays a key role in the enhanced phosphorylation of HDAC2 during mitosis.
Protein Kinase CK2 and Separation of HDAC1 and -2 during Mitosis
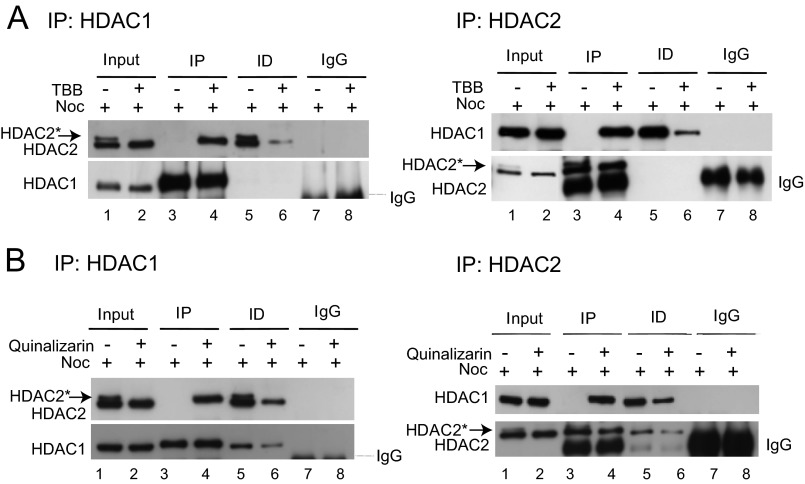
Because protein kinase CK2 is involved in the enhanced mitotic phosphorylation of HDAC2, we next sought to determine whether the CK2-mediated phosphorylation of HDAC2 had a role in the disruption of the HDAC1/2 heterodimers during mitosis. HDAC1 or HDAC2 was immunoprecipitated from lysates of cells incubated with nocodazole or TBB and nocodazole. Immunoblotting analysis on the immunoprecipitated fractions with anti-HDAC2 or anti-HDAC1 antibodies demonstrated that HDAC2 was not associated with HDAC1 in nocodazole-incubated cells, in agreement with results shown in Fig. 4. However, this interaction was preserved when the cells were incubated with the CK2 inhibitor TBB before nocodazole treatment (Fig. 8A, lanes 3 and 4). To check for the reproducibility of our findings, we repeated the experiment with another CK2 inhibitor, quinalizarin. Co-immunoprecipitation followed by immunoblotting analyses showed that HDAC1 or HDAC2 immunocomplexes from quinalizarin-pretreated nocodazole-incubated cellular extracts contained both HDAC1 and HDAC2, whereas fractions immunoprecipitated by anti-HDAC1 or anti-HDAC2 antibodies from nocodazole-treated cells had either HDAC1 or HDAC2 (Fig. 8B).
FIGURE 8.
Inhibition of protein kinase CK2 activity prevents dissociation of HDAC1 and HDAC2 during mitosis. A and B, total cell lysates (500 μg) from nocodazole (Noc)- and TBB-nocodazole-treated (A) or from nocodazole- and quinalizarin-nocodazole-treated (B) HeLa cells were immunoprecipitated with 3.0 μg rabbit polyclonal anti-HDAC1 or anti-HDAC2 or control isotype-specific non-related rabbit IgG antibodies. The co-immunoprecipitates were checked by immunoblotting with mouse monoclonal anti-HDAC2 and rabbit polyclonal anti-HDAC1 antibodies (left panels of A and B) or mouse monoclonal anti-HDAC1 and rabbit polyclonal anti-HDAC2 antibodies (right panels of A and B). HDAC2*, phosphorylated form of HDAC2. IP and ID, immunoprecipitated and immunodepleted fractions, respectively.
We surmised that if CK2-mediated phosphorylation was sufficient to dissociate HDAC1 from HDAC2 during mitosis, then mutating all CK2-phosphorylated serines on HDAC2 would prevent HDAC1/2 dimer dissociation during mitosis. To test this idea, we prepared cell lysates from Flp-In 293-HDAC2 (WT)-V5 and triple mutant HDAC2 (M3A)-V5 cell lines and performed immunoprecipitation with an antibody against the V5 tag. In lysates from cycling Flp-In 293-HDAC2 (WT)-V5 cells, HDAC1 and HDAC2 co-immunoprecipitated with the HDAC2-V5 (Fig. 9A, left). In nocodazole-incubated cells, the HDAC2 (WT)-V5 did not associate with HDAC1 (Fig. 9A, right). However, the triple mutant HDAC2 (M3A)-V5 co-immunoprecipitated with HDAC1 and HDAC2 in cycling and nocodazole-treated cells (Fig. 9A).
FIGURE 9.
Formation of HDAC1 or HDAC2 homodimers in mitosis. A, HDAC2-WT-V5 and HDAC2-M3A-V5 mutant proteins were immunoprecipitated with anti-V5 antibody from cycling (left) and nocodazole (Noc)-treated (right) Flp-In 293 cells stably expressing HDAC2 WT or HDAC2 M3A mutant V5-tagged proteins. The immunoprecipitated fractions were analyzed for the presence of indicated proteins. B, HEK 293 cells were transfected individually with the indicated FLAG-HDAC2 plasmids. Thirty-two h after transfection, cells were treated with nocodazole for 16 h. Following this period, immunoprecipitations were carried out with anti-FLAG (left) or anti-HDAC1 (right) antibodies. The co-immunoprecipitates were analyzed by immunoblotting with anti-HDAC1 and anti-FLAG antibodies. Isotype-specific non-related rabbit IgG was used as negative control. C, 40 μg of total cellular lysates from Flp-In 293-HDAC2 (WT)-V5 stable cells (lanes 1) and HeLa cells (lanes 2) were separated on a SDS-7.5% PAGE and were analyzed by immunoblotting with anti-V5, anti-V5 and anti-HDAC2 (together), or anti-HDAC2 antibodies. The shifted band corresponds to HDAC2-V5 protein. HeLa cellular lysates were used as a control. D, HEK 293 cells were co-transfected with HDAC1-MYC and HDAC1-FLAG plasmids. Thirty-two h after transfection, cells were left untreated or treated with nocodazole for 16 h. Following this period, immunoprecipitation of HDAC1 complexes was performed with anti-FLAG (left) and anti-MYC (right) antibodies. The immunoprecipitated fractions were analyzed for the presence of the indicated proteins. IB, immunoblot.
To determine the relative contribution of the three HDAC2 phosphorylation sites to the dissociation of HDAC2/HDAC1 during mitosis, we constructed two FLAG-HDAC2 plasmids, FLAG-HDAC2-S394A and FLAG-HDAC2-S422A/S424A, where the Ser-394 residue and S422A/S424A residues were mutated to alanine, respectively. HEK 293 cells were transfected with FLAG-HDAC2 wild type (WT), FLAG-HDAC2-S394A, or FLAG-HDAC2-S424/424A plasmids. Following transfection, cell lysates were prepared from the nocodazole-treated cells, followed by immunoprecipitation with anti-FLAG antibodies and immunoblotting with anti-HDAC1 antibodies. Fig. 9B (left) shows that in nocodazole-treated cells, FLAG-HDAC2 (WT) did not associate with HDAC1. FLAG-HDAC2 (S422A/S424A) associated with HDAC1 to a greater level than did FLAG-HDAC2 (S394A) with HDAC1. In the reciprocal experiment, nocodazole-treated cell lysates were immunoprecipitated with anti-HDAC1 antibodies, and the immunoprecipitated fractions were immunoblotted with anti-FLAG antibodies. Fig. 9B (right) shows that HDAC1 did not co-immunoprecipitate with FLAG-HDAC2 (WT) from lysates of nocodazole-treated HeLa cells. In contrast, HDAC1 associated with FLAG-HDAC2 (S422A/S424A) and to a lesser extent with FLAG-HDAC2 (S394A).
Overall, these data demonstrate that HDAC1 forms a heterodimer with HDAC2 in cycling cells; however, during mitosis, the dramatic increase in the steady state level of HDAC2 phosphorylation mediated by CK2 results in the dissociation of the HDAC1/2 heterodimer. Further, the results show that phosphorylation at Ser-422, Ser-424, and, to a lesser extent, Ser-394 contributes to the dissociation of the HDAC1 from HDAC2 during mitosis.
HDAC1 and HDAC2 Form Homodimers during Mitosis
Fig. 9C shows that V5-HDAC2 migrates slower than the endogenous HDAC2 and can be distinguished from untagged HDAC2. Thus, Fig. 9A (right) shows that HDAC2-V5 co-immunoprecipitates with untagged HDAC2 in nocodazole-treated cells, providing evidence that HDAC2 forms homodimers in mitotic cells. To determine whether HDAC1 forms homodimers during mitosis, HEK 293 cells were co-transfected with HDAC1-FLAG and HDAC1-MYC constructs. Cells were either left untreated or treated with nocodazole. Immunoprecipitations were carried out with anti-FLAG or anti-MYC antibodies, and immunoprecipitated fractions were analyzed with anti-FLAG or anti-MYC antibodies. Fig. 9D (left) shows that in cycling and nocodazole-treated HEK 293 cells, HDAC1-FLAG co-immunoprecipitated with HDAC1-MYC. Similar results were obtained in the reciprocal order, where immunoprecipitations were performed with anti-MYC antibodies, and the immunoprecipitates were analyzed with anti-FLAG antibodies (Fig. 9D, right). Again HDAC1-MYC co-immunoprecipitated with HDAC1-FLAG from nocodazole-treated cell lysates.
DISCUSSION
During mitosis, protein kinase CK2 activity is stimulated by CDC2 kinase (24). Further, protein phosphatase 2A is excluded from the nucleus in early prophase, whereas CK2 remains nuclear until prometaphase (25). Also, protein phosphatase 1 activity is low until metaphase and increases at the metaphase-anaphase transition period (26). Our studies show that the highly phosphorylated state of HDAC2 is due to the activity of CK2. Interestingly, although both HDAC1 and HDAC2 are substrates for CK2, HDAC2 is more extensively phosphorylated than HDAC1 by CK2 during mitosis in HeLa cells. A similar observation was reported for the differential phosphorylation of HDAC2 versus HDAC1 in mitotic K562 cells (19).
In interphase HeLa cells, most of the HDAC2 (86.5%, data not shown) is associated with HDAC1. In these cells, we found HDAC1 and -2 to be in a monophosphorylated state. Our data show that phosphorylation at Ser-394 of HDAC2 is one of the HDAC2 monophosphorylated forms. Also, our data show that monophosphorylation of HDAC2 at Ser-394 is not sufficient to result in the reduced mobility observed for some of the HDAC2 phosphorylated forms. The reduced mobility of HDAC2 observed during mitosis must be due to phosphorylation at Ser-422 and/or Ser-424 of HDAC2 in a mono-, di-, or triphosphorylated state.
The elevated phosphorylation level of HDAC2 and, to a lesser extent, HDAC1 during mitosis in HeLa cells results in dissociation of the HDAC1/2 heterodimer; however, the HDAC1 or -2 corepressor complexes remain intact. Previous reports demonstrate that HDACs, although displaced from mitotic chromosomes, are catalytically active (16, 27). Our results measuring the activity of HDAC1- or HDAC2-containing complexes isolated from mitotic cell lysates concur with this observation. Further, our data show that in mitotic cells, the catalytically active HDAC1 and HDAC2 complexes consist of HDAC1 and HDAC2 homodimers, respectively, consistent with the requirement that HDAC1 and HDAC2 form a homodimer or a heterodimer to be catalytically active (7, 14).
Current evidence suggests that the extent of phosphorylation of proteins associated with the HDAC1/2 multiprotein complexes has an impact on the composition and integrity of the complexes. Treatment of K562 cells with okadaic acid to inhibit protein phosphatase activity resulted in the hyperphosphorylation of HDAC2, the dissociation of HDAC1 from HDAC2, and the dissociation of the Sin3 HDAC complex (19). Under these conditions, multiple proteins, including those in the multiprotein HDAC complexes, probably become highly phosphorylated and contribute to the dissociation of the HDAC1/2 complex. However, during mitosis, CK2-mediated phosphorylation of HDAC2 is sufficient to dissociate HDAC1 from HDAC2, but the multiprotein complex remains intact and catalytically active. Further, the CK2-mediated phosphorylation of HDAC1 and -2 during mitosis may promote increased levels of HDAC1 or -2 corepressor complex formation, as indicated by the increased association of RbAp48, a component of the Sin3A and NuRD corepressor complexes, with HDAC1 during mitosis.
The significance and the functional role of the formation of HDAC1 or HDAC2 homodimers within the corepressor complexes during mitosis awaits further analysis; however, the HDAC1/2 complexes may have an opportunity to deacetylate various proteins during mitosis. Multiple proteins are acetylated during mitosis (27). HDAC inhibitors, such as apicidin, an HDAC2 and -3 specific HDAC inhibitor, increase the acetylation state of the anaphase-promoting complex 1 and the dynein/dynactin-associated and Polo-like kinase 1 (Plk1)-interacting protein NudC. The acetylated state of these proteins may govern their function in mitosis and/or cytokinesis (27). HDAC1 and -2 have both distinct and redundant functions (3, 7). As an example of a specific role for HDAC2, it is the HDAC2 homodimer CoREST corepressor complex, not the HDAC1 complex, that is involved in the silencing of genes involved in synaptic plasticity and memory in hippocampus neurons (6). It is possible that corepressor complexes with HDAC1 or HDAC2 homodimers are directed to specific substrates during mitosis.
Acknowledgments
We thank Geneviève Delcuve for preparation of the manuscript and Nehal Patel for technical assistance. We acknowledge the strong support of the Manitoba Institute of Child Health and CancerCare Manitoba Foundation for facilities (Genomic Centre for Cancer Research and Diagnosis) at the Manitoba Institute of Cell Biology.
This work was supported by Canadian Institutes of Health Research Grant MOP-9186, a Canada Research Chair (to J. R. D.), and a Manitoba Health Research Council/CancerCare Manitoba studentship (to D. K.).
- HDAC
- histone deacetylase
- TBB
- 4,5,6,7-tetrabromobenzotriazole
- CIP
- calf intestinal phosphatase
- TSA
- trichostatin A
- IP
- immunoprecipitation.
REFERENCES
- 1. Hnilicová J., Staněk D. (2011) Where splicing joins chromatin. Nucleus 2, 182–188 [DOI] [PMC free article] [PubMed] [Google Scholar]
- 2. Zhou H. L., Hinman M. N., Barron V. A., Geng C., Zhou G., Luo G., Siegel R. E., Lou H. (2011) Hu proteins regulate alternative splicing by inducing localized histone hyperacetylation in an RNA-dependent manner. Proc. Natl. Acad. Sci. U.S.A. 108, E627–E635 [DOI] [PMC free article] [PubMed] [Google Scholar]
- 3. Delcuve G. P., Khan D. H., Davie J. R. (2012) Roles of histone deacetylases in epigenetic regulation. Emerging paradigms from studies with inhibitors. Clin. Epigenetics 4, 5. [DOI] [PMC free article] [PubMed] [Google Scholar]
- 4. Tsai S. C., Seto E. (2002) Regulation of histone deacetylase 2 by protein kinase CK2. J. Biol. Chem. 277, 31826–31833 [DOI] [PubMed] [Google Scholar]
- 5. Brunmeir R., Lagger S., Seiser C. (2009) Histone deacetylase HDAC1/HDAC2-controlled embryonic development and cell differentiation. Int. J. Dev. Biol. 53, 275–289 [DOI] [PubMed] [Google Scholar]
- 6. Guan J. S., Haggarty S. J., Giacometti E., Dannenberg J. H., Joseph N., Gao J., Nieland T. J., Zhou Y., Wang X., Mazitschek R., Bradner J. E., DePinho R. A., Jaenisch R., Tsai L. H. (2009) HDAC2 negatively regulates memory formation and synaptic plasticity. Nature 459, 55–60 [DOI] [PMC free article] [PubMed] [Google Scholar]
- 7. Jurkin J., Zupkovitz G., Lagger S., Grausenburger R., Hagelkruys A., Kenner L., Seiser C. (2011) Distinct and redundant functions of histone deacetylases HDAC1 and HDAC2 in proliferation and tumorigenesis. Cell Cycle 10, 406–412 [DOI] [PMC free article] [PubMed] [Google Scholar]
- 8. Marshall G. M., Gherardi S., Xu N., Neiron Z., Trahair T., Scarlett C. J., Chang D. K., Liu P. Y., Jankowski K., Iraci N., Haber M., Norris M. D., Keating J., Sekyere E., Jonquieres G., Stossi F., Katzenellenbogen B. S., Biankin A. V., Perini G., Liu T. (2010) Transcriptional upregulation of histone deacetylase 2 promotes Myc-induced oncogenic effects. Oncogene 29, 5957–5968 [DOI] [PubMed] [Google Scholar]
- 9. Upadhyay A. K., Ajay A. K., Singh S., Bhat M. K. (2008) Cell cycle regulatory protein 5 (Cdk5) is a novel downstream target of ERK in carboplatin induced death of breast cancer cells. Curr. Cancer Drug Targets 8, 741–752 [DOI] [PubMed] [Google Scholar]
- 10. Pflum M. K., Tong J. K., Lane W. S., Schreiber S. L. (2001) Histone deacetylase 1 phosphorylation promotes enzymatic activity and complex formation. J. Biol. Chem. 276, 47733–47741 [DOI] [PubMed] [Google Scholar]
- 11. Sun J. M., Chen H. Y., Moniwa M., Litchfield D. W., Seto E., Davie J. R. (2002) The transcriptional repressor Sp3 is associated with CK2 phosphorylated histone deacetylase 2. J. Biol. Chem. 277, 35783–35786 [DOI] [PubMed] [Google Scholar]
- 12. Sun J. M., Chen H. Y., Davie J. R. (2007) Differential distribution of unmodified and phosphorylated histone deacetylase 2 in chromatin. J. Biol. Chem. 282, 33227–33236 [DOI] [PubMed] [Google Scholar]
- 13. Segré C. V., Chiocca S. (2011) Regulating the regulators. The post-translational code of class I HDAC1 and HDAC2. J. Biomed. Biotechnol. 2011, 690848. [DOI] [PMC free article] [PubMed] [Google Scholar]
- 14. Luo Y., Jian W., Stavreva D., Fu X., Hager G., Bungert J., Huang S., Qiu Y. (2009) Trans-regulation of histone deacetylase activities through acetylation. J. Biol. Chem. 284, 34901–34910 [DOI] [PMC free article] [PubMed] [Google Scholar]
- 15. de Ruijter A. J., van Gennip A. H., Caron H. N., Kemp S., van Kuilenburg A. B. (2003) Histone deacetylases (HDACs). Characterization of the classical HDAC family. Biochem. J. 370, 737–749 [DOI] [PMC free article] [PubMed] [Google Scholar]
- 16. Kruhlak M. J., Hendzel M. J., Fischle W., Bertos N. R., Hameed S., Yang X. J., Verdin E., Bazett-Jones D. P. (2001) Regulation of global acetylation in mitosis through loss of histone acetyltransferases and deacetylases from chromatin. J. Biol. Chem. 276, 38307–38319 [DOI] [PubMed] [Google Scholar]
- 17. He S., Davie J. R. (2006) Sp1 and Sp3 foci distribution throughout mitosis. J. Cell Sci. 119, 1063–1070 [DOI] [PubMed] [Google Scholar]
- 18. Patzlaff J. S., Terrenoire E., Turner B. M., Earnshaw W. C., Paulson J. R. (2010) Acetylation of core histones in response to HDAC inhibitors is diminished in mitotic HeLa cells. Exp. Cell Res. 316, 2123–2135 [DOI] [PMC free article] [PubMed] [Google Scholar]
- 19. Galasinski S. C., Resing K. A., Goodrich J. A., Ahn N. G. (2002) Phosphatase inhibition leads to histone deacetylases 1 and 2 phosphorylation and disruption of corepressor interactions. J. Biol. Chem. 277, 19618–19626 [DOI] [PubMed] [Google Scholar]
- 20. Winter S., Simboeck E., Fischle W., Zupkovitz G., Dohnal I., Mechtler K., Ammerer G., Seiser C. (2008) 14-3-3 proteins recognize a histone code at histone H3 and are required for transcriptional activation. EMBO J. 27, 88–99 [DOI] [PMC free article] [PubMed] [Google Scholar]
- 21. Samuel S. K., Spencer V. A., Bajno L., Sun J.-M., Holth L. T., Oesterreich S., Davie J. R. (1998) In situ cross-linking by cisplatin of nuclear matrix-bound transcription factors to nuclear DNA of human breast cancer cells. Cancer Res. 58, 3004–3008 [PubMed] [Google Scholar]
- 22. Taplick J., Kurtev V., Kroboth K., Posch M., Lechner T., Seiser C. (2001) Homo-oligomerisation and nuclear localisation of mouse histone deacetylase 1. J. Mol. Biol. 308, 27–38 [DOI] [PubMed] [Google Scholar]
- 23. He S., Sun J. M., Li L., Davie J. R. (2005) Differential intranuclear organization of transcription factors Sp1 and Sp3. Mol. Biol. Cell 16, 4073–4083 [DOI] [PMC free article] [PubMed] [Google Scholar]
- 24. Escargueil A. E., Plisov S. Y., Filhol O., Cochet C., Larsen A. K. (2000) Mitotic phosphorylation of DNA topoisomerase II α by protein kinase CK2 creates the MPM-2 phosphoepitope on Ser-1469. J. Biol. Chem. 275, 34710–34718 [DOI] [PubMed] [Google Scholar]
- 25. Escargueil A. E., Larsen A. K. (2007) Mitosis-specific MPM-2 phosphorylation of DNA topoisomerase IIα is regulated directly by protein phosphatase 2A. Biochem. J. 403, 235–242 [DOI] [PMC free article] [PubMed] [Google Scholar]
- 26. Wang W., Cronmiller C., Brautigan D. L. (2008) Maternal phosphatase inhibitor-2 is required for proper chromosome segregation and mitotic synchrony during Drosophila embryogenesis. Genetics 179, 1823–1833 [DOI] [PMC free article] [PubMed] [Google Scholar]
- 27. Chuang C., Lin S. H., Huang F., Pan J., Josic D., Yu-Lee L. Y. (2010) Acetylation of RNA processing proteins and cell cycle proteins in mitosis. J. Proteome Res. 9, 4554–4564 [DOI] [PMC free article] [PubMed] [Google Scholar]


