

Abstract
Identifying policies that will cut or constrain US health care spending and spending growth dominates reform efforts, yet little is known about whether the drivers of spending levels and of spending growth are the same. Policies that produce a one-time reduction in the level of spending, for example by making hospitals more efficient, may do little to reduce subsequent annual spending growth. To identify factors causing health care spending to grow the fastest, we focused on three conditions in the Medicare population: heart attacks, congestive heart failure, and hip fractures. We found that spending on postacute care—long-term hospital care, rehabilitation care, and skilled nursing facility care—was the fastest growing major spending category and accounted for a large portion of spending growth in 1994–2009. During that period average spending for postacute care doubled for patients with hip fractures, more than doubled for those with congestive heart failure, and more than tripled for those with heart attacks. We conclude that policies aimed at controlling acute care spending, such as bundled payments for short-term hospital spending and physician services, are likely to be more effective if they include postacute care, as is currently being tested under Medicare’s Bundled Payment for Care Improvement Initiative.
The United States is an outlier among developed countries for its high level of spending on health care and its high rate of annual health care spending growth.1 The Congressional Budget Office, economists, and health policy experts have extensively documented the negative fiscal implications of continued high rates of health care spending growth.2 But what is not well known is whether the drivers of spending growth are the same as the drivers of the level of spending. This is a key issue because policies that produce a one-time reduction in the level of spending—for example, by making hospitals more efficient—may do little to reduce spending growth.
Another way of making this point is to note that if per capita US health care spending is $8,000 annually and grows at 5 percent per year, spending will double to $16,000 in fourteen years. Even if annual per capita spending could be reduced to $6,400—a reduction of 20 percent—without harming patients, a 5 percent growth rate would mean that per capita spending would still exceed $12,500 in fourteen years.
The goal of this article is to identify the areas where expenditures on health care are growing fastest and to discuss the implications for payment policy. We focused on three conditions: heart attacks (acute myocardial infarctions), congestive heart failure, and hip fractures. These conditions are among the most expensive conditions for which Medicare patients are treated, collectively accounting for approximately 12 percent of Medicare’s total yearly expenditures.3 Heart attacks are also one of the most studied conditions and have been the focus of many of the seminal papers on the productivity of medical spending.4–6
Spending trends for these three conditions may not be representative of all health care spending trends. However, heart attacks, congestive heart failure, and hip fractures may be useful proxies for acute conditions, chronic conditions, and acute conditions requiring rehabilitation, respectively.
In addition, nearly every patient with one or more of the three conditions is diagnosed and treated, so a well-defined cohort of patients can be identified by using the presence of an initial hospital admission for the condition, also known as an “index event.” Finally, each of the three conditions has a high mortality rate, which allowed us to explore the productivity of medical spending by using the reduction in mortality as a measure of output.
We documented annual spending for each condition, paying particular attention to the types of care responsible for the greatest share of spending growth. We hypothesized that cost growth was concentrated in areas where analyses of cost-effectiveness and comparative effectiveness were rare or difficult and where fee-for-service reimbursement encouraged the use of procedures with unproven effectiveness.
Having few incentives to keep costs low, as is the case with fee-for-service reimbursement, promotes the development of new therapies or treatments that may be marginally beneficial but are not cost-effective.7 Many postacute services—which we defined as services provided in long-term hospital care, rehabilitation care, or care offered in a skilled nursing facility—fall into this category, where marginal benefit drives innovation but not cost-effectiveness.
Finally, our work is directly relevant to the design of bundled payments. Although existing studies have shown that bundled payments may be able to reduce the level of spending,8,9 it is not known whether bundled payments can affect the trend in spending growth. It is also not known whether the optimal bundle would include payments for hospital, physician, and outpatient care during the acute phase of treatment, or whether it should be broader and also include postacute care after the initial hospitalization. These questions are currently being examined in the context of Medicare’s Bundled Payments for Care Improvement Initiative, an experiment in which some 500 providers across the country are now participating. We believe that the answers to these questions will depend, in part, on where spending growth has occurred.
Study Data And Methods
Data
We used the 5 percent sample of the Medicare Provider Analysis and Review files from the period 1992–2010 to identify people who suffered a heart attack, congestive heart failure, or hip fracture according to their principal International Classification of Diseases, Ninth Revision, Clinical Modification (ICD-9-CM), diagnostic codes. The heart attack cohort was defined by the codes 410.X1, 410.X0, 410, and 410.X;10 the congestive heart failure cohort by the codes 428.X and 428.XX;11 and the hip fracture cohort by the codes 820.XX and 820.X.12
Enrollment and demographic information were extracted from the 5 percent denominator and beneficiary summary file. The cohorts comprised beneficiaries ages sixty-six and older in the contiguous forty-eight states who were continuously enrolled until death in traditional fee-for-service Medicare for twelve months before the identifying claim date and for 1 + X months afterward, where X was the number of months needed to calculate relevant cost and mortality statistics. For example, 30-day costs and mortality required a fourteen-month (12 + 1 + 1) window of continuous enrollment, and 365-day costs required a twenty-five-month window (12 + 1 + 12). We required that beneficiaries had been enrolled for twelve months before the identifying claim date so that we could calculate comorbidity profiles for each patient. The extra month was required because enrollment information was available only on a monthly basis.
Cohort members with an initial admission after September 2010 were dropped from the sample to avoid claims that had not been properly adjudicated. We required at least one year to elapse before a new index event was identified, although patients in one disease cohort, such as the heart attack cohort, might simultaneously have been in another cohort, such as the congestive heart failure cohort. Allowing one year to elapse meant that we could identify separate episodes of care and avoid double counting costs for very sick patients who had multiple events in a one-year period.
For 365-day cost and mortality measures for all years in our sample, we obtained a sample size of 189,056 patients for the heart attack cohort, 313,362 for the congestive heart failure cohort, and 164,626 for the hip fracture cohort after applying the restrictions above to each cohort. Yearly sample sizes for these cohorts, as well as for the cohorts used to calculate thirty-day costs, are available in online Appendix Exhibit 1.13
Expenditures and procedure-specific information were obtained from the 5 percent Medicare Provider Analysis and Review, Outpatient, and Carrier files (for physician care). Each patient’s comorbidity profile was constructed using a one-year look back at Medicare Provider Analysis and Review claims from the date of admission for the index event, excluding comorbidities from the index hospitalization.
ICD-9-CM diagnostic codes were mapped into the 189 Hierarchical Condition Categories developed for the Centers for Medicare and Medicaid Services, as described by Gregory Pope and colleagues.14 These categories were aggregated into seventeen groups developed by Harlan Krumholz and coauthors.15
Analyses
To obtain risk-adjusted measures of spending and mortality, we estimated linear regression models controlling for age (measured in five-year increments), race, sex, Hierarchical Condition Categories comorbidity groups and interaction terms for all demographic variables. This method adjusted for the increase in prevalence of disease and comorbidities over time, but it was susceptible to overadjusting for these factors if diagnosis creep—that is, when providers use disease codes that allow them to bill for more lucrative diagnoses—was becoming more prevalent over time.16,17
As a sensitivity analysis, we reestimated our models adjusting only for age, race, and sex. All reimbursement amounts reported were calculated in real 2011 dollars using the urban Consumer Price Index from the Department of Labor.18
Limitations
Our study was not without limitations. One limitation was that we did not differentiate between spending incurred to treat the condition that triggered an index hospitalization and unrelated medical costs. By casting a wide net, our estimates of costs per disease episode were able to incorporate all spending that resulted from complications and readmissions to care. However, we also included other expenditures that may have had little connection to a given index hospitalization.
As a consequence, we could not identify which portion of cost increases was illness-specific and which portion was attributable to other unrelated conditions. To shed light on this issue, we examined trends in spending growth both with and without adjustment for Hierarchical Condition Categories. This analysis reassured us that illness adjustment did not alter our findings.
Data limitations also restricted the scope of conclusions we could draw. Mortality was the most readily available statistic and is one of the most accurate measures of patient health outcomes. However, relying only on short-term mortality data was inherently imperfect because it excluded other important outcomes that may not be related to mortality, such as the patient’s functional status and quality of life, and the care-giver burden.
In addition we excluded payments made for durable medical equipment, hospice care, home health care, and Part D Medicare claims for prescription drugs. This exclusion prevented us from providing a full picture of all spending under Medicare, although we believe that including these categories would not alter our findings about the increasing costs of postacute care.
Study Results
In the period 1994–2009 average real risk-unadjusted health expenditures during the year following a heart attack, congestive heart failure, or hip fracture increased. For heart attack, expenditures increased 27 percent, from $39,300 to $49,900. For congestive heart failure, the increase was 43 percent, from $33,700 to $48,200; and for hip fracture, it was 39 percent, from $41,000 to $56,800. The risk-adjusted increases were $10,500, $12,600, and $14,400, respectively (Exhibits 1–4).
Exhibit 1.
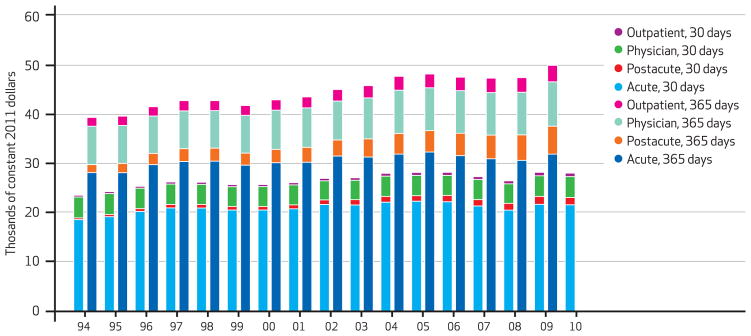
Medicare Cost Per Heart Attack Episode At 30 And 365 Days, By Type Of Care, 1994–2010
SOURCE Authors’ analysis of Medicare claims data, 1993–2010. NOTES The shorter bars indicate 30-day costs, and the longer bars 365-day costs. Costs were risk-adjusted for age, race, sex, and Hierarchical Condition Categories aggregated into seventeen comorbidity groups.
Exhibit 4.
Per Episode Medicare Cost For Heart Attack, Congestive Heart Failure, And Hip Fracture At 365 Days, 1994 And 2009
| Condition/type of care | 1994 cost ($ thousands) | 2009 cost ($ thousands) | Absolute cost growth ($ thousands) | Cumulative cost growth (%) | Percent of 365-day growth |
|---|---|---|---|---|---|
|
Heart attack
| |||||
| Acute | 28.2 | 31.9 | 3.7 | 13.3 | 35.5 |
| Postacute | 1.6 | 5.7 | 4.0 | 250.4 | 38.4 |
| Outpatient | 1.8 | 3.3 | 1.5 | 85.3 | 14.6 |
| Physician | 7.8 | 9.0 | 1.2 | 16.0 | 11.8 |
| Total | 39.5 | 50.0 | 10.5 | 26.7 | 100.0 |
|
| |||||
| Congestive heart failure | |||||
|
| |||||
| Acute | 22.0 | 26.8 | 4.8 | 21.9 | 38.2 |
| Postacute | 2.8 | 7.5 | 4.7 | 164.2 | 37.2 |
| Outpatient | 2.4 | 3.5 | 1.1 | 43.3 | 8.4 |
| Physician | 6.4 | 8.4 | 2.0 | 31.4 | 16.0 |
| Total | 33.7 | 46.3 | 12.6 | 37.3 | 100.0 |
|
| |||||
| Hip fracture | |||||
|
| |||||
| Acute | 22.0 | 24.8 | 2.8 | 12.6 | 19.2 |
| Postacute | 10.0 | 19.9 | 9.9 | 99.9 | 69.0 |
| Outpatient | 1.9 | 2.4 | 0.4 | 21.3 | 2.9 |
| Physician | 7.0 | 8.2 | 1.3 | 18.1 | 8.8 |
| Total | 40.9 | 55.4 | 14.4 | 35.2 | 100.0 |
SOURCE Authors’ analysis of Medicare claims data, 1993–2010.
NOTES Costs were measured in thousands of constant 2011 dollars and were risk-adjusted for age, race, sex, and Hierarchical Condition Categories aggregated into seventeen comorbidity groups. Costs were rounded to the first decimal place after all other calculations were made, so readers who manually calculate total costs or any of the cost growth statistics using the rounded numbers from the exhibit will arrive at growth estimates that may differ slightly from the ones in the exhibit. Total spending includes a small amount of other Medicare Part A spending—such as psychiatric care or care at hospitals in demonstration projects—that cannot be categorized as either acute or long-term hospital care.
Although spending grew for all major categories of care, it grew fastest for postacute services. As Exhibit 4 shows, average risk-adjusted spending on acute hospital care in the year following the index hospitalization was the category of spending that grew the slowest between 1994 and 2009 for all three conditions. In contrast, average spending for postacute care doubled for hip fracture patients, more than doubled for congestive heart failure patients, and more than tripled for heart attack patients during the same period.
For care between 30 and 365 days after an initial hospitalization, postacute spending growth was the main driver of increases in spending for the study period (results not shown). During this period postacute spending comprised 47 percent, 39 percent, and73 percent of the growth in expenditures for heart attack, congestive heart failure, and hip fracture, respectively.
In contrast, acute care contributed only 11 percent, 28 percent, and 7 percent of cost growth for these conditions during this period. See Appendix Exhibit 2 for cost growth during three periods lasting up to a year following an index event.13
To explore whether these increases in spending were associated with improvements in outcomes, we examined changes in mortality. Consistent with other studies on heart attack19 and congestive heart failure,20 we found that risk-adjusted mortality fell between 1993 and 2009. For patients with heart attacks during the study period, the thirty-day risk-adjusted mortality rate declined from 19.1 percent to 10.2 percent—a 47 percent reduction—and for patients with congestive heart failure, the rate fell from 10.6 percent to 7.4 percent—a31 percent reduction (see Appendix Exhibits 3–5).13
For patients with hip fractures, the thirty-day risk-adjusted mortality rate rose from 6.3 percent to 6.4 percent—a 1 percent increase during the study period. Mortality rates changed in two phases: Between 1994 and 2007 mortality gradually rose to a peak of 7.7 percent in 2002 before falling again. Our finding that mortality rates for hip fracture patients were subject to only small changes was consistent with a study of hip fracture mortality in the Medicare population, which showed that mortality decreased from 1986 through 1995 but stayed fairly constant after 1995.12
For patients with heart attacks and those with congestive heart failure, short-term survival gains persisted through one year after the index event. For patients with heart attacks, risk-adjusted 365-day mortality fell to 23.8 percent from 33.0 percent. The vast majority of this decline occurred in the first 30 days, with only small changes in the mortality rates between 30 and 365 days. For patients with congestive heart failure, risk-adjusted 365-day mortality fell to 31.7 percent from 36.9 percent, and risk-adjusted mortality between 30 and 365 days also fell between 1994 and 2009. Improvements in short-term survival were thus retained through the first year after the index event for patients with heart attacks and were improved on for patients with congestive heart failure.
For patients with hip fractures trends in 365-day mortality and 30-day mortality followed similar patterns. Risk-adjusted 365-day mortality for these patients rose from 23.2 percent in 1994 to a peak of 27.4 percent in 2002 and then declined to 23.8 percent in 2009. The peak in mortality rates during the interim years of the sample is partly a result of increased mortality between 30 and 365 days for patients with hip fractures during this period.
One concern with risk adjustment is that there is a general trend toward more thorough documentation of comorbidities on Medicare claims forms over time, which may make the study population appear to be getting sicker although it is not.21 To ensure that our risk-adjusted trends were not being driven by trends in coding practice, we calculated the same mortality trends while risk-adjusting only for age, race, and sex, and interaction terms between these variables.
During the study period, 365-day mortality rates adjusted only for age, race, and sex declined to 28.0 percent from 33.3 percent for patients with heart attacks—a 16 percent reduction. For patients with congestive heart failure the mortality rate declined to 36.4 percent from 37.4 percent—a 2.7 percent reduction. And for patients with hip fractures the mortality rate rose to 26.6 percent from 23.6 percent—a 12.7 percent increase.
Excluding comorbidities in the risk-adjustment formulas thus resulted in a much smaller drop in one-year risk-adjusted mortality, which implies that our original results were partially driven by increases in the reported disease burden. This may indicate that risk-adjustment was biased by increases in the coding of disease. However, it could also indicate that more recent cohorts were actually sicker, reflecting the increase in diabetes and obesity in the population.
Nevertheless, it was reassuring that the overall trends in mortality, and the relative mortality reductions for each cohort, were similar whether we fully adjusted for risk or adjusted only for age, race, and sex and their interactions.
Discussion
Since the introduction of the hospital inpatient prospective payment system in 1983, the Centers for Medicare and Medicaid Services has introduced independent prospective payment systems for all major care settings. Prospective payment systems have been successful in controlling growth in acute care costs. Between 1994 and 2009 Medicare’s expenditures for acute care increased by 13.3 percent, 21.9 percent, and 12.6 percent for patients with heart attacks, congestive heart failure, and hip fractures, respectively (Exhibit 4).
However, Medicare’s prospective payment systems failed to control growth in spending in postacute care settings such as skilled nursing facilities. Between 1994 and 2009 Medicare’s spending on postacute care increased by 250.4 percent, 164.2 percent, and 99.9 percent for patients with heart attacks, congestive heart failure, and hip fractures, respectively (Exhibit 4).
The median length-of-stay at inpatient facilities for patients with hip fractures and heart attacks decreased during the study period. However, other studies have shown that the number of patients who were transferred to a skilled nursing facility following treatment increased substantially over a similar period.12,19 Spending at postacute care facilities accounted for the largest fraction of one-year spending growth for patients in both cohorts. For patients with congestive heart failure, spending at post-acute care facilities accounted for the second largest fraction, just slightly behind that for acute care (Exhibit 4). Spending at skilled nursing facilities represented the largest portion of both the level and the growth rate of spending at postacute care facilities.
Increased spending on postacute care can be both valuable to patients and economical, particularly if expensive hospital care is replaced by less expensive postacute care. However, determining how much postacute care is appropriate is a hard policy question, because this spending is unlikely to have been validated by cost-effectiveness or comparative effectiveness analysis.22
There is no clear consensus on the amount and intensity of postacute care that is appropriate for a particular condition. Thus, the quantity and intensity of follow-up care is up to the discretion of health care providers in consultation with their patients. In a fragmented fee-for-service system, well-meaning doctors have an incentive to overprescribe postacute care—as measured, for example, by the length-of-stay in skilled nursing facilities—because there are few side effects of this additional care, even if the potential benefits of increased care are small.1
We were surprised to find that periods that had the greatest spending growth showed little improvement in terms of reductions in mortality—a finding that mirrors results in the literature on geographic variations of expenditures.16,17 Of the three conditions in our study, the most dramatic gains in terms of reduced mortality were for patients with heart attacks, even though they had the smallest increases in cost growth in both absolute and percentage terms over the study period.
In contrast, despite having the smallest reduction in mortality rates, patients with hip fractures had average expenditures that rose more than the average expenditures for either of the other two conditions in absolute terms. Moreover, most of the one-year survival gains for patients with heart attacks and those with congestive heart failure were made in the first thirty days after initial hospitalization, despite large increases in spending in the postacute period.
In other words, consistent with other research,1,23,24 our study found that spending growth and mortality improvement between 1994 and 2009 were far from automatically correlated and that the determinants of spending growth for long-term care may be very different from the determinants of mortality reductions.
Nevertheless, the increased reliance on post-acute care suggests that the current fragmented approach to controlling spending in Medicare through separate prospective payment systems is becoming less effective over time. Other studies have shown that bundling payments across all providers helps reduce unnecessary payments resulting from the excessive use of discretionary procedures, postacute care, and hospital readmissions.8,9,25,26
Because spending growth was concentrated in postacute facilities for the three conditions in our study, large bundles that included all patient care would probably be more effective at controlling costs over time than an approach that dealt only with inpatient care. Between 1994 and 2009 the portion of Medicare’s 365-day spending that went to postacute care increased from 4 percent to 11 percent for patients with heart attacks, from 8 percent to 16 percent for those with congestive heart failure, and from 24 percent to 36 percent for those with hip fractures.
Including this growing portion of spending in payment bundles would discourage providers from delivering services of dubious benefit. It would also reward providers who delivered services at the lowest cost rather than those who have the highest reimbursement rate for a given procedure.
Moreover, including spending for postacute care in payment bundles does not necessarily imply standardization of use, because if post-acute care is a substitute for some forms of acute care, hospitals may differ in the portions of acute and postacute services they provide to patients. The optimal bundling policy may also differ across conditions, because spending on post-acute care for chronic conditions such as congestive heart failure is very different from spending on such care for acute conditions, including heart attacks.
For example, a bundled payment is normally paid in full to a primary provider, which is responsible for determining what care the patient received and dividing the fee among the providers. It makes sense for an episode of care triggered by a heart attack to be coordinated by an acute care provider, because acute spending accounts for more than 60 percent of the total costs for heart attack patients. However, a post-acute care provider may be better able to coordinate care for a patient suffering from a hip fracture. Also, a one-size-fits-all bundled payment approach would not be the most appropriate one in cases where some outlier patients have a much higher disease burden than others with the same condition.
Although our analysis focused on the experience of the Medicare program, it is also relevant to other types of medical spending. Health care utilization for patients with Medicare is correlated with utilization for patients who have commercial insurance,27 and both Medicare’s reimbursements and its coverage decisions are widely believed to affect the practice of medicine in all populations.28
There is also evidence that payment reform initiatives, such as the hospital inpatient prospective payment system introduced by Medicare in 1983, have been rapidly adopted by private plans. Thus, although Medicare is of great interest in its own right because of its role in affecting the long-term fiscal health of the United States, it is also possible that policies that reduce the level of spending growth in Medicare may have spillover effects for the non-Medicare population.
Conclusion
Although the majority of Medicare spending in 2009 for patients with heart attacks, congestive heart failure, and hip fractures occurred in acute care hospitals, the majority of spending growth since 1994 occurred in other settings, particularly in long-term postacute care. Given that postacute care is less suited to evaluation by clinical trials, and given that fee-for-service reimbursement has few incentives to promote cost-effectiveness when benefits to care are uncertain, we expect that cost savings could be achieved by bundling payments.
It remains to be seen whether separate bundling schemes for acute and postacute care would perform better than large bundles that included both. However, we expect that the latter would produce greater efficiency gains by aligning the incentives of providers and by allowing them flexibility to choose whether patients received care at acute or postacute care facilities.
The Bundled Payments for Care Improvement Initiative implemented this year by the Centers for Medicare and Medicaid Services should be able to provide estimates of the extent of cost savings from bundled payments. Two of the four models under this initiative include postacute care. Outside of this experiment, under current policies it is likely that postacute spending will continue on its existing growth trajectory because of the lack of incentives for cost-saving innovations. By rewarding hospitals that drive down costs, payment bundling might also succeed in reducing the growth rate of spending at postacute care facilities over time.
Exhibit 2.
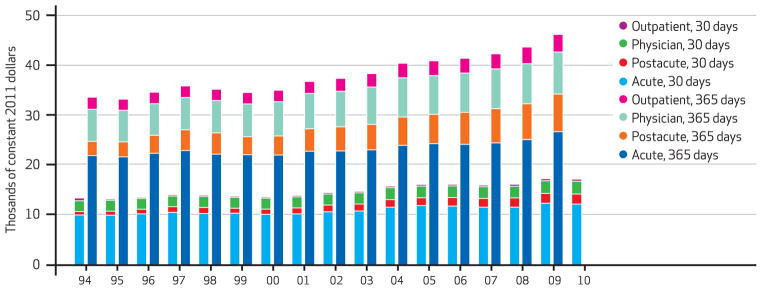
Medicare Cost Per Congestive Heart Failure Episode At 30 And 365 Days, By Type Of Care, 1994–2010
SOURCE Authors’ analysis of Medicare claims data, 1993–2010. NOTES The shorter bars indicate 30-day costs, and the longer bars 365-day costs. Costs were risk-adjusted for age, race, sex, and Hierarchical Condition Categories aggregated into seventeen comorbidity groups.
Exhibit 3.
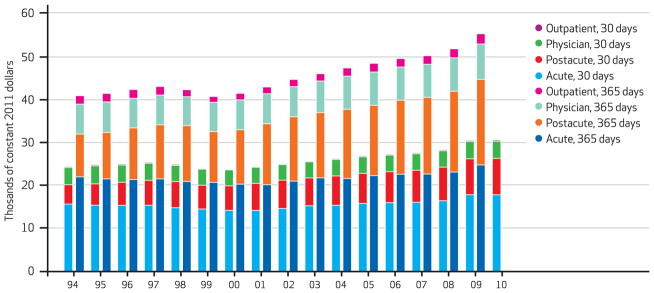
Medicare Cost Per Hip Fracture Episode At 30 And 365 Days, By Type Of Care, 1994–2010
SOURCE Authors’ analysis of Medicare claims data, 1993–2010. NOTES The shorter bars indicate 30-day costs, and the longer bars 365-day costs. Costs were risk-adjusted for age, race, sex, and Hierarchical Condition Categories aggregated into seventeen comorbidity groups.
Acknowledgments
Amitabh Chandra acknowledges support from the National Institute on Aging (Grant Nos. P01-AG005842-24 and P01-AG19783).
Biographies
 Amitabh Chandra is a professor at the Kennedy School of Government, Harvard University.
In this month’s Health Affairs, Amitabh Chandra and coauthors report on their analysis of health care spending levels and spending growth, as examined through spending on Medicare patients with heart attacks, congestive heart failure, and hip fractures from 1994 to 2009. They found that a disproportionate amount of spending growth for treatment of these conditions over that period came from postacute care provided in long-term hospitals, rehabilitation units, and skilled nursing facilities. For example, for patients with heart attacks, spending on postacute care more than tripled over the period. The authors conclude that policies aimed at controlling acute care spending will be more effective if they also attack postacute care, as is currently being tested under Medicare’s Bundled Payment for Care Improvement Initiative.
Chandra is a professor of public policy and director of health policy research at the Kennedy School of Government, Harvard University. He is also a member of the Panel of Health Advisers at the Congressional Budget Office and a research associate at the Institute for the Study of Labor, in Bonn, Germany, and at the National Bureau of Economic Research.
Chandra’s research focuses on productivity and cost growth in health care, medical malpractice, and racial disparities in health care. He is an editor of the Review of Economics and Statistics and a former editor of the Journal of Human Resources, and he serves on the editorial boards of Economics Letters and the American Economic Journal. Chandra earned a doctorate in economics from the University of Kentucky.
 Maurice A. Dalton is a survey data specialist at the National Bureau of Economic Research.
Maurice Dalton is a survey data specialist at the National Bureau of Economic Research, where he has worked extensively with the Medicare claims data and on the creation of a cross-national health index through the harmonization of several international aging surveys. Dalton received a master’s degree in economics from Tufts University.
 Jonathan Holmes is a research fellow at the Kennedy School of Government.
Jonathan Holmes is a research fellow working with Chandra and with Rema Hanna at the Kennedy School of Government. His current research uses nonparametric and quasi-experimental methods in the fields of education, health, and environmental economics. Holmes has a master’s degree in economics from Queen’s University, in Ontario.
Contributor Information
Amitabh Chandra, Email: amitabh_chandra@harvard.edu, Kennedy School of Government, Harvard University, in Cambridge, Massachusetts.
Maurice A. Dalton, National Bureau of Economic Research, in Cambridge.
Jonathan Holmes, Harvard’s Kennedy School of Government.
NOTES
- 1.Chandra A, Skinner J. Technology growth and expenditure growth in health care. J Econ Lit. 2012;50(3):645–80. [Google Scholar]
- 2.Newhouse JP. Accessing health reform’s impact on four key groups of Americans. Health Aff (Millwood) 2010;29(9):1714–24. doi: 10.1377/hlthaff.2010.0595. [DOI] [PubMed] [Google Scholar]
- 3.Andrews RM, Elixhauser A. The national hospital bill: growth trends and 2005 update on the most expensive conditions by payer [Internet] Rockville (MD): Agency for Healthcare Research and Quality; 2007. Dec, [cited 2013 Mar 28]. (Healthcare Cost and Utilization Project Statistical Brief No. 42). Available from: http://www.hcup-us.ahrq.gov/reports/statbriefs/sb42.pdf. [PubMed] [Google Scholar]
- 4.Cutler DM, McClellan M. Is technological change in medicine worth it? Health Aff (Millwood) 2001;20(5):11 –29. doi: 10.1377/hlthaff.20.5.11. [DOI] [PubMed] [Google Scholar]
- 5.Skinner JS, Staiger DO, Fisher ES. Is technological change in medicine always worth it? The case of acute myocardial infarction. Health Aff (Millwood) 2006;25(2):w34–47. doi: 10.1377/hlthaff.25.w34. [DOI] [PMC free article] [PubMed] [Google Scholar]
- 6.Skinner J, Staiger D. Technology diffusion and productivity growth in health care [Internet] Cambridge (MA): National Bureau of Economic Research; 2009. Apr, [cited 2013 Mar 28]. (NBER Working Paper No. 14865). Available from: http://www.nber.org/papers/w14865.pdf. [Google Scholar]
- 7.Weisbrod BA. The health care quadrilemma: an essay on technological change, insurance, qualify of care, and cost containment. J Econ Lit. 1991;29(2):523–52. [Google Scholar]
- 8.Miller DC, Gust C, Dimick JB, Birkmeyer N, Skinner J, Birkmeyer JD. Large variations in Medicare payments for surgery highlight savings potential from bundled payment programs. Health Aff (Millwood) 2011;30(11):2107–15. doi: 10.1377/hlthaff.2011.0783. [DOI] [PMC free article] [PubMed] [Google Scholar]
- 9.Cutler DM, Ghosh K. The potential for cost savings through bundled episode payments. N Engl J Med. 2012;366(12):1075–7. doi: 10.1056/NEJMp1113361. [DOI] [PMC free article] [PubMed] [Google Scholar]
- 10.Udvarhelyi SI, Gatsonis C, Epstein AM, Pashos CL, Newhouse JP, McNeil BJ. Acute myocardial infarction in the Medicare population. JAMA. 1992;268(18):2530–6. [PubMed] [Google Scholar]
- 11.Lee DS, Donovan L, Austin PC, Gong Y, Liu PP, Rouleau JL, et al. Comparison of coding of heart failure and comorbidities in administrative and clinical data for use in outcomes research. Med Care. 2005;43(2):182–8. doi: 10.1097/00005650-200502000-00012. [DOI] [PubMed] [Google Scholar]
- 12.Brauer CA, Coca-Perraillon M, Cutler DM, Rosen AB. Incidence and mortality of hip fractures in the United States. JAMA. 2009;302(14):1573–9. doi: 10.1001/jama.2009.1462. [DOI] [PMC free article] [PubMed] [Google Scholar]
- 13.To access the Appendix, click on the Appendix link in the box to the right of the article online.
- 14.Pope GC, Kautter J, Ellis RP, Ash AS, Ayanian JZ, Iezzoni LI, et al. Risk adjustment of Medicare capitation payments using the CMS-HCC model. Health Care Financ Rev. 2004;25(4):119–41. [PMC free article] [PubMed] [Google Scholar]
- 15.Krumholz HM, Normand ST, Galusha DH, Mattera JA, Rich AS, Wang Y, et al. Risk-adjustment models for AMI and HF 30-day mortality: methodology [Internet] Baltimore (MD): Centers for Medicare and Medicaid Services; 2007. Jan 23, [cited 2013 Mar 28]. Available for download from: http://www.qualitynet.org/dcs/ContentServer?c=Page&pagename=QnetPublic/Page/QnetTier3&cid=1163010421830. [Google Scholar]
- 16.Welch HG, Sharp SM, Gottlieb DG, Skinner JS, Wennberg JE. Geographic variation in diagnosis frequency and risk of death among Medicare beneficiaries. JAMA. 2011;305(11):1113–8. doi: 10.1001/jama.2011.307. [DOI] [PMC free article] [PubMed] [Google Scholar]
- 17.Song Y, Skinner J, Bynum J, Sutherland J, Wennberg JE, Fisher ES. Regional variations in diagnostic practices. N Engl J Med. 2010;363(1):45–53. doi: 10.1056/NEJMsa0910881. [DOI] [PMC free article] [PubMed] [Google Scholar]
- 18.Bureau of Labor Statistics. Databases, tables, and calculators by subject: inflation and prices: all urban consumers [Internet] Washington (DC): Department of Labor; [cited 2013 Mar 28]. Available from: http://www.bls.gov/data/ [Google Scholar]
- 19.Krumholz HM, Wang Y, Chen J, Drye EE, Spertus JA, Ross JS, et al. Reduction in acute myocardial infarction mortality in the United States: risk-standardized mortality rates from 1995–2006. JAMA. 2009;302(7):767–73. doi: 10.1001/jama.2009.1178. [DOI] [PMC free article] [PubMed] [Google Scholar]
- 20.Bueno H, Ross JS, Wang Y, Chen J, Vidan MT, Normand SLT. Outcomes among Medicare patients hospitalized for heart failure, 1993–2006. JAMA. 2010;303(21):2141–7. doi: 10.1001/jama.2010.748. [DOI] [PMC free article] [PubMed] [Google Scholar]
- 21.Finlayson EV, Birkmeyer JD, Stukel TA, Siewers AE, Lucas FL, Wennberg DE. Adjusting surgical mortality rates for patient comorbidities: more harm than good? Surgery. 2002;132(5):787–94. doi: 10.1067/msy.2002.126509. [DOI] [PubMed] [Google Scholar]
- 22.Chandra A, Jena AB, Skinner JS. The pragmatist’s guide to comparative effectiveness research. J Econ Perspect. 2011;25(2):27–46. doi: 10.1257/jep.25.2.27. [DOI] [PMC free article] [PubMed] [Google Scholar]
- 23.Fisher ES, Wennberg DE, Stukel TA, Gottlieb DJ, Lucas FL, Pinder EL. The implications of regional variations in Medicare spending. Part 2: health outcomes and satisfaction with care. Ann Intern Med. 2003;138(4):288–98. doi: 10.7326/0003-4819-138-4-200302180-00007. [DOI] [PubMed] [Google Scholar]
- 24.Baicker K, Chandra A. Medicare spending, the physician workforce, and beneficiaries’ quality of care. Health Aff (Millwood) 2004;23:w4-184–97. doi: 10.1377/hlthaff.w4.184. [DOI] [PubMed] [Google Scholar]
- 25.Hackbarth G, Reischauer R, Mutti A. Collective accountability for medical care—toward bundled Medicare payments. N Engl J Med. 2008;259:3–5. doi: 10.1056/NEJMp0803749. [DOI] [PubMed] [Google Scholar]
- 26.Sood N, Huckfeldt PJ, Escarce JJ, Grabowski DC, Newhouse JP. Medicare’s bundled payment pilot for acute and postacute care: analysis and recommendations on where to begin. Health Aff (Millwood) 2011;30(9):1708–17. doi: 10.1377/hlthaff.2010.0394. [DOI] [PMC free article] [PubMed] [Google Scholar]
- 27.Chernew ME, Sabik LM, Chandra A, Gipson TB, Newhouse JP. Geographic correlation between large-firm commercial spending and Medicare spending. Am J Manag Care. 2010;16(2):131–8. [PMC free article] [PubMed] [Google Scholar]
- 28.Baicker K, Chandra A, Skinner JS. Geographic variation in health care and the problem of measuring racial disparities. Perspect Biol Med. 2005;48(1 Suppl):S42–53. [PubMed] [Google Scholar]